Download presentation
Presentation is loading. Please wait.

2
2014 OUTLOOK Ray Grabanski Progressive Ag Fargo, ND Trading futures and options involves risk. Past performance is not indicative of future results.

3
North Dakota Marketing Year Average Price Year Spring Wheat SoyeansCorn 1971-20061.30 - 4.712.87 - 7.371.00 - 3.16 20077.459.634.06 20087.199.713.74 20094.909.263.18 20106.7810.905.01 20118.1711.905.81 20128.1914.006.46

4
2013 – IN REVIEW Jan-13Dec-13Change Chi Wht H7.78006.0500-22.2% Chi Wht N7.94006.1700-22.3% KC Wht H8.31006.4000-23.0% KC Wht N8.2700 6.4300-22.2% Mpls Wht H8.6500 6.3500-26.6% Mpls Wht U8.95006.6600-25.6%

5
2013 – IN REVIEW Jan-13Dec-13Change Corn H6.98004.2200-39.5% Corn Z5.86004.5000-23.2% Soybean H14.190013.1200-7.5% Soybean X13.030011.3500-12.9% Soybean Oil H49.1638.82-21.0% Soybean Meal H420.60437.704.1%

6
2013 – IN REVIEW Jan-13Dec-13Change Live Cattle G129.900134.5003.5% Feeder Cattle F151.400166.70010.1% Lean Hog G85.72085.420-0.3%

7
2013 – IN REVIEW Jan-13Dec-13Change GOLD G1677.101201.90-28.3% Silver H30.3819.34-36.3% Copper G3.643.44-5.5% Platinum F1538.701371.10-10.9% Palladium H717.40702.65-2.1%

8
2013 – IN REVIEW Jan-13Dec-13Change Crude Oil G91.7998.427.2% RBOB G2.812.79-0.9% Heating Oil G3.053.081.1% Ethanol G2.191.91-12.7% Natural Gas G3.374.2325.6%

9
2013 – IN REVIEW Jan-13Dec-13Change Dow Jones H13070.0016494.0026.2% S&P 500 H1422.501841.1029.4% Nasdaq H2652.003584.0035.1% Dollar79.8880.320.6% CRB Index313.37277.68-11.4%

10
Stocks Breakout to New Highs

11
10 year Monthly DJIA

12
CORN

13
Corn’s Issues Bigger than expected crop (158.8 bu) Demand Exports started poor/cancellation/improving Ethanol pace slowing EPA changing RFS 1.6 Million less Soft Red Acres
 Demand Exports started poor/cancellation/improving Ethanol pace slowing EPA changing RFS 1.6 Million less Soft Red Acres")
15
Corn Exports To Date SalesShipmentsUSDA 2012.5380.312.731 20131.32 60.0/week 1.8/3.12 BB 0.574 26.1/week 783/1.357 1.6 22 weeks into corn’s marketing year, 30 weeks to go Sales need to average 9.3/Shipments 34.2

16
Corn Category 09/10 10/11 11/12 12/13 13/14 14/15 Supply Beginning Stocks1,6731,7081,1289898211,481 Production13,09212,44712,36010,78013,92513,871 Imports8 28291623515 Total Supply14,77414,18213,51711,93214,78115,367 Use Food, Seed, Ind.1,3701,4071,4281,3961,4001,425 Ethanol4,5915,0195,0004,6485,0004,600 Feed and Residual5,1254,7954,5574,3355,3005,000 Exports1,9801,8341,5437311,6001,750 Total Use13,06613,05512,52811,11113,30012,775 Ending Stocks1,7081,1289898211,4812,592 Stocks/Use Ratio13.18.67.97.411.120.3 5 Year Average 11.2 Planted Acres86.488.291.997.295.492.5 Harvested Acres79.581.484.087.487.785.1 Yield Per Acre (Bu.)164.7152.8147.2123.4158.8163.0 Average Price3.555.186.226.894.503.35
 Average Price")
17
USDA 2014 L-R Projections n 93.5 million acres, 86.1 hvstd. n 165.6 bu/acre yield n 14.26 billion bu crop n Ethanol 4.9 billion bu. n 2.6 billion carryout ($3.65) n But reduce 400 mb since Nov. (2.2 B)
 n But reduce 400 mb since Nov. (2.2 B).")
18
USDA 10 yr. projections n 2014-2018: $3.30-$3.65 n 2019-2024: $3.75-$4.20 n B/E now is $4.14 n Target Price is now $3.70

19
Monthly corn: Consolidation?

20
Weekly Chart: Bottoming???

21
Mar 14 Corn: $4.45 sell July

22
Dec 14 Corn: $4.65/$5.35?

28
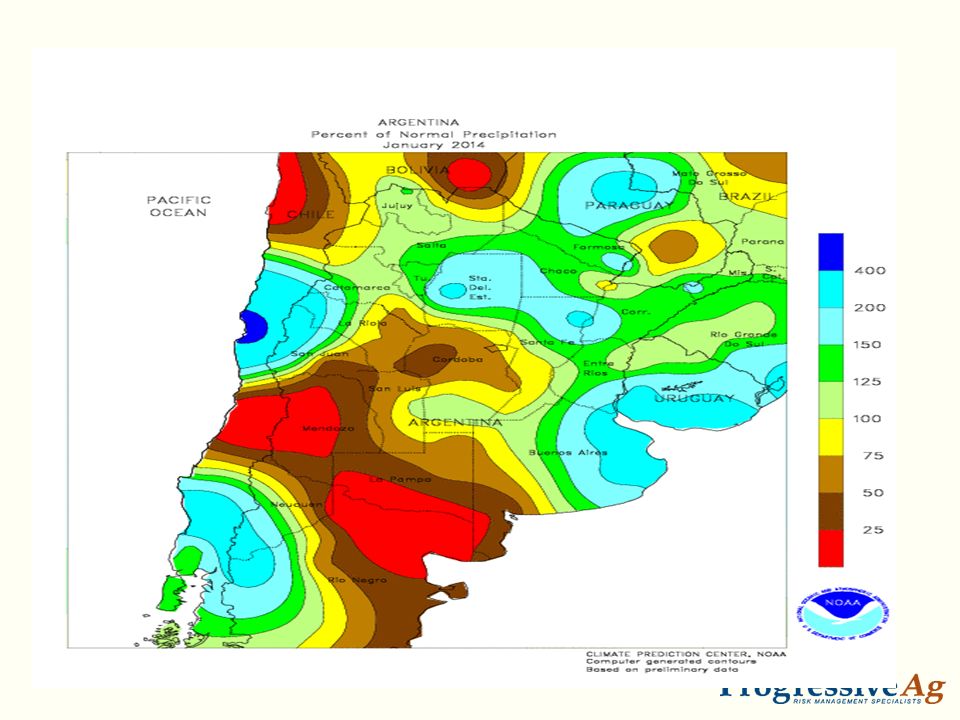
SAM Weather

32
SOYBEAN

33
Soybean Issues South America: Brazil: huge acres, 5 to 8% increase, early harvest good, getting hot south Argentina: hot dry conditions/improving US demand impressively strong Crush demand very strong meal demand main reason Exports very strong but China has huge

34
Soybean Exports To Date SalesShipmentsUSDA 20121.251.011.32 20131.58 71.8/week 2.15/3.73 BB 1.16 52.7/week 1.58/2.74 BB 1.51 22 weeks into corn’s marketing year, 30 weeks to go Sales are over expectations/Shipments need 11.7

35
Soybean Export Destinations

36
Soybeans Category09/10 10/11 11/12 12/13 13/14 14/15 Supply Beginning Stocks138151215169141150 Production3,3593,3293,0943,0343,2893,484 Imports151416363015 Total Supply3,5123,4953,3253,2393,4593,649 Use Crush1,7521,6481,7031,6891,7001,750 Exports1,4991,5011,3651,3201,5101,550 Seed and Feed908790898790 Residual2043-211225 Total Use3,3613,2803,1553,0993,3093,415 Ending Stocks151215169141150234 Stocks/Use Ratio4.56.65.44.5 6.9 5 Year Average 5.2 Planted Acres77.577.475.077.276.579.5 Harvested Acres76.476.673.876.275.978.3 Yield Per Acre (Bu.)44.043.541.939.843.344.5 Average Price9.5911.3012.5014.4012.7010.35
 Average Price")
37
USDA Baseline 2014 no’s n 78 million acres n 45.2 bu/acre yield n 3.480 billion bu crop n 203 million bu carryout ($9.75) But reduced 20 mb after Nov. (183)
.")
38
USDA 10 yr. projections n 2014-2021: $8.85 to $9.75 n 2022-2024: $9.95 - $10.15 n Target price is $8.40

39
Soybean Monthly: Downside Risk?

40
Weekly: Consolidation???

41
Mar 14 Sbns: inverted, sell

42
Nov 14 Sbns: $11.65/$12.35

45
Check Out Our Website www.progressiveag.com Daily Comments: User name: daily Password: heart Weekly Comments: User name: weekly Password: superbowl randy@progressiveag.com rwww.progressiveag.com

46
WHEAT

47
Wheat’s Issues - US US Winter Wheat going into dormancy at very good condition Exports started strong, slowing due to strong dollar Winter Wheat crop high quality Spring Wheat average quality, discounts Oct/Nov/Dec Crop Production Report BEARISH, not expected

48
Wheat’s Issues - US US Winter Wheat Crop Condition Rating KS: 63% G/E58%35% OK: 77% G/E63%36% TX: 32% G/E 38/35/37%19% CO: 55% G/E 18 States: 62% G/E Last Year: 33% G/E

49
Winter Wheat Acres Down State20072008200920102011201220132014 KS10.409.609.308.608.809.409.508.80-7% TX6.205.806.405.405.305.706.20 0% OK5.905.605.705.205.105.405.605.30-5% MT2.242.602.552.002.252.302.002.5025% CO2.502.152.602.402.302.352.302.9026% IL1.001.200.850.350.800.660.880.74-15% IN0.420.580.470.300.430.350.470.43-9% NE2.051.751.701.501.521.381.471.502% OH0.821.121.010.800.880.500.690.63-9% Total45.0146.3143.3137.1040.6541.2043.1041.90-3%

50
WW Acres

51
Wheat Exports To Date SalesShipmentsUSDA 20120.7720.5991.007 20130.981 28.0/week 476 MB/1.46 0.811 23.2/week 394 MB/1.21 1.175 35 weeks into marketing year, 17 weeks to go Sales need average 11.4/Shipments 21.4

52
Wheat Category 09/10 10/11 11/12 12/13 13/14 14/15 Supply Beginning Stocks657976862743718558 Production2,2182,2071,9992,2662,1302,366 Imports11997112123170120 Total Supply2,9933,2792,9743,1313,0183,044 Use Food919926941945960950 Seed697176737475 Feed and Residual150132162388250275 Exports8791,2891,0511,0071,1751,200 Total Use2,0182,4172,2312,4142,4592,500 Ending Stocks Total Ending Stocks976862743718558544 Stocks/Use Ratio48.435.733.329.722.721.8 10 Year Average 28.5 Planted Acres59.253.654.455.756.257.5 Harvested Acres49.947.645.748.945.252.0 Yield Per Acre (Bu.)44.546.343.746.347.245.5 Average Price4.875.707.247.776.806.50
 Average Price")
53
2014 USDA Baseline no’s n 57 million acres, 48.5 hvstd. n 45.8 bu/acre n 2.220 billion bu production n 642 million bu carryout ($4.90) Only 7 mb reduction since Nov. (635)
 Only 7 mb reduction since Nov. (635).")
54
USDA 10 yr. projections n 2014-2020: $4.30 - $4.90 n 2021-2024: $4.90-$5.35 n Target Price is $5.50 in new farm bill

55
Mar Mpls: $6.95/$7.35 sell

56
Sept 14 Mpls: $7.00/$7.35

Similar presentations