Download presentation
Presentation is loading. Please wait.

1
High-Stakes Workshop December 17, 2010 Doug Marshall Farm Mgt. Instructor Madison Area Technical College

2
Looking At The Numbers… Whose Perspective?

3
Farm Transfers Is there enough money for everyone? –2 projections need to be done Exiting Cash Flow (Parents) Entering (You)
 Entering (You).")
4
Exiting Cash Flow Budget Enough Money to be “Comfortable” –Living costs Food Household operating Travel Car Any remaining debt –Health care / insurance –Nursing home / insurance

5
Entering Farmer Questions? Same or different type of farm? Same or different management? Same or different financial control? Answers dictate budgeting numbers…

6
What Type of Operation Are You Going to Have? Where have we been? = Analyze past performance New Management = New ways? Coordinated effort with prior generation?

7
Commercial Commodity Production? High level of Competition between Producers Long run, who produces the cheapest Slim margins High Volume X Slim Margin = Living Higher Investment

8
Value Added Commodity Production? Specialty product Name, organic, natural, humane, etc. Lower Volume Wider margin Lower Volume x wider margin = living Higher labor pay rate

9
Get Help!!!!! UW Extension Agents Tech School Farm Business Instructors Independent Consultants Wisconsin Farm Center - DATCP

10
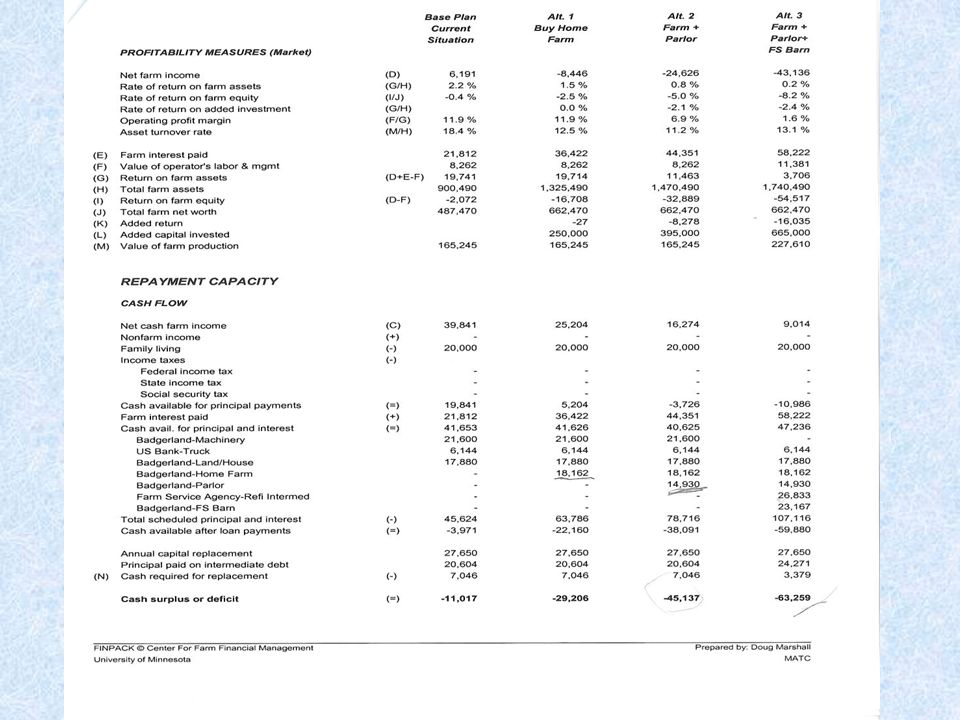
Entering Farmer Must Do Feasibility / Cash Flow Budgets FINPACK Computer program to see where the farm is now and determine long run feasibility of your farming operation as you intend to run it…. –Looks at everything: Investment Income/Expense Cropping & livestock Added debt and repayment Calculates profitability and cash surplus/deficit Tax impact

12
Determine it’s Feasible, Then…. Do monthly cash flow budgets to see how you get there. This is your best estimate of how money will move in your business. First 2 years the hardest.

13
Where Do I Go for Planning Numbers? Depends on direction you’re going… –Same operation mode ? –Same management ? –Etc.

14
Where do I go for planning numbers? Industry benchmarks or standards are a good place to start. Use as a guide and interject past actual farm numbers where applicable. Every farm is different: –Graze or not –Tillable acres –Genetic potential –Etc.

15
Benchmarks? Wisconsin –UW Center for Dairy Profitability –www.cdp.wisc.eduwww.cdp.wisc.edu Click on Financial Benchmarks Ag Financial Advisor Several hundred Wisconsin Dairies Sort by herd size, production level, crop acres, etc. Production and Financial performance benchmarks Handout

16
Benchmarks University of Minnesota Center for Farm Financial Management –“Finbin” Production data on all types of farms –Crops, dairy, hogs, cattle –www.cffm.umn.edu/www.cffm.umn.edu/

17
Assessing past and future performance????

18
Each Leg is Important Productivity Debt/Investment Cost Control

19
Cost Control is Important… Expense including Interest as % of Income should be 70% or less. Expense without Interest 60% or less

20
Debt & Investment Structure is Important Limit Investment to $10000 per cow Limit debt to $2500 to $5000 per cow Asset/liabilities = 40% or less Not feasible at the start….

21
Productivity is Important Decent production per cow 22000+ Good crop yields 5-7 TDM Alfalfa 160-180 bu corn 50+ bu beans 20-25 ton Silage

22
Liquidity Measures Indicators of positive cash flow Current Ratio of 1.5 to 2.0 Working Capital should be positive

23
Solvency Measures Debt / Asset Ratio <.4 or 40% in debt –Not at entry Equity / Asset Ratio >.6 Debt / Equity Ratio <.66

24
Profit Measures Net Farm Income should be as high as possible --- really no standard Rate of Return On Assets > 5% Rate of Return on Equity > RROA Operating Profit Margin > 15%

25
Loan Repayment Capacity Measures Term Debt Coverage Ratio > 1.2

26
Financial Efficiency Measures Asset Turnover > 30% Operating Expense Ratio < 70% Without Interest < 60% Depreciation Expense Ratio < 15% Interest Expense Ratio < 10% Net Farm Income Ratio > 15%

27
Thumb-rule per cow costs Breeding fees Purchased feed Supplies Vet, Medicine Seed, Chemicals, Fertilizer Fuel Repairs Other $56. $600. add $40/1000Lb RHA $150. $125 $500 $125 $225 $ 364

28
Generally Looks Like This Per Cow…. Gross Farm Income = $3300 Gross Operating Expense = $2145 65% Debt Service = $ 500 15% Family Living = $ 500 15% Left for Cap. Replacement = $ 155 5%

29
Dr. David Kohl’s Quick Analysis RedYellowGreen Liquidity Liquidity Current Ratio Working Capital < 100% < 20% 100 – 150% 20 – 50% > 150% > 50% Solvency Debt/Asset > 70%30 – 70%< 30% Profitability Return on Assets < 1%1 – 5%> 5% Repayment Term debt coverage < 100%100 – 150%> 150% Efficiency Operating Expense > 80%65 – 80%< 65%

30
Business Success Factors Baseline Yr 1Yr 2Benchmark Breakeven/cwt Milk< $14.50 CDRD (Repayability)>115% Expense Ratio<70% Solvency> 50% Term Debt/cwt<$20 Net Cash Income/cow>$600 Net Profit/cow>$200 Return on Assets (ROA) >9%
>115% Expense Ratio<70% Solvency> 50% Term Debt/cwt<$20 Net Cash Income/cow>$600 Net Profit/cow>$200 Return on Assets (ROA) >9%")
31
Business Success Factors Baselin e Yr 1 Yr 2Benchmark Return on Equity (ROE) > 12% C&I Equity50% Working Capital/AGI10% CDRC Margin/AGI>5% Debt/cow (total cows)<$3,500 Milk Income/cow (avg. milking) >$2,500 Debt Service as % of total income <25%
 >$2,500 Debt Service as % of total income <25%.")
32
Business Success Factors BaselineYr 1Yr 2Benchmark Principal Reduction/ cow/year $200 Interest Expense/ Gross Revenue <12% Feed Costs - $/cwt<$3.50 Debt Service - $/cwt<$3.20 Labor Costs - $/cwt<$2.25 Labor Costs as % of Total Income <15%

33
In Summary…. 1.Analyze past business performance –Strengths/weaknesses 2.Determine future production scheme 3.Project feasibility and cash flow 4.Monitor financial performance

Similar presentations

 and.>")


