Download presentation
Presentation is loading. Please wait.

1
Trends in Biomedical Science Summary and Review 2

2
Action potential propagation along an axon

3
Diagram of a gap junction

4
An electrical synapse is a mechanical and electrically conductive link between two connecting neurons. The synapse forms at a narrow gap between the pre- and postsynaptic neurons known as a gap junction. At gap junctions, such cells approach within about 3.5 nm of each other, a much shorter distance than the 20 to 40 nm distance that separates cells at chemical synapse.

5
Compared to chemical synapses, electrical synapses conduct nerve impulses faster, but unlike chemical synapses, the signal in the postsynaptic neuron is the same or smaller than that of the originating neuron. Electrical synapses are often found in neural systems that require the fastest possible response, such as defensive reflexes.

6
Measuring potentials a, The first action potential recorded intracellularly from a neuron, by Hodgkin and Huxley; inset, the electrode inserted into a giant squid axon. b, The multisite optical recording of action potentials in a cerebellar neuron by using voltage sensitive dyes

9
The cell-attached patch clamp uses a micropipette attached to the cell membrane to allow recording from a single ion channel.

11
Stimulation of neurons c, The electrical stimulation of a frog nerve as illustrated by Galvani. d, Optical deep-brain stimulation of neurons expressing microbial opsin genes.

12
b, Imaging can show where things happen. Shown are calcium in a single hippocampal spine measured using a genetically encoded calcium sensor and two-photon microscopy; local calcium transient triggered by parallel-fibre synaptic input to a fine spiny branchlet in the dendritic tree of a cell; a pyramidal neuron filled with a calcium dye and visualized in mouse visual cortex in vivo using two-photon microscopy; an orientation map in rat visual cortex measured using two-photon microscopy; and optical imaging of voltage-sensitive-dye fluorescence to record receptive- field properties across cat visual cortex.

13
The design of genetically encoded voltage sensors involves making a gene which codes a green fluorescent protein (GFP) and something else, such as a voltage-gated channel.
 and something else, such as a voltage-gated channel.")
14
Specially designed ion channels can be switched on or off by using light.

15
Example of using several techniques. Cultured mouse hippocampal neurons were infected with non-toxic viruses that contained the DNA which codes for a light- activated channel protein in their membranes. When irradiated with a 10-millisecond flash of blue light, these proteins allow sodium ions to enter the neurons

16
S Watanabe et al. Nature 000, 1-6 (2013) doi:10.1038/nature12809 Channelrhodopsin activation induces action-potential-driven vesicle fusion.
 doi: /nature12809 Channelrhodopsin activation induces action-potential-driven vesicle fusion..")
17
S Watanabe et al. Nature 000, 1-6 (2013) doi:10.1038/nature12809 Docked vesicles are the morphological correlates of the readily-releasable pool.
 doi: /nature12809 Docked vesicles are the morphological correlates of the readily-releasable pool..")
18
S Watanabe et al. Nature 000, 1-6 (2013) doi:10.1038/nature12809 Large invaginations immediately next to the active zone are endocytic intermediates.
 doi: /nature12809 Large invaginations immediately next to the active zone are endocytic intermediates..")
19
S Watanabe et al. Nature 000, 1-6 (2013) doi:10.1038/nature12809 Endocytosis is localized to sites flanking the active zone.
 doi: /nature12809 Endocytosis is localized to sites flanking the active zone..")
20
S Watanabe et al. Nature 000, 1-6 (2013) doi:10.1038/nature12809 Ultrafast endocytosis is mediated by actin and dynamin.
 doi: /nature12809 Ultrafast endocytosis is mediated by actin and dynamin..")
22
If we want to look at the brain working in a larger scale we can use functional Magnetic Resonance Imaging (fMRI)
")
24
Functional MRI Functional MRI (fMRI) measures signal changes in the brain that are due to changing neural activity. The brain is scanned at low resolution but at a rapid rate (typically once every 2–3 seconds). Increases in neural activity cause changes in the MR signal; this mechanism is referred to as the BOLD (blood-oxygen-level dependent) effect.
. Increases in neural activity cause changes in the MR signal; this mechanism is referred to as the BOLD (blood-oxygen-level dependent) effect..")
25
Increased neural activity causes an increased demand for oxygen, and the vascular system increases the amount of oxygenated hemoglobin relative to deoxygenated hemoglobin. Because deoxygenated hemoglobin reduces the MR signal, the vascular response leads to a signal increase that is related to the neural activity.

26
A fMRI scan showing regions of activation in orange, including the primary visual cortex.

27
These fMRI images are from a study showing parts of the brain lighting up on seeing houses and other parts on seeing faces.

28
Fig. 1 Standard types of fMRI analysis.(A) Univariate activation refers to the average amplitude of BOLD activity evoked by events of an experimental condition. N B Turk-Browne Science 2013;342:580-584 Published by AAAS
 Univariate activation refers to the average amplitude of BOLD activity evoked by events of an experimental condition. N B Turk-Browne Science 2013;342: Published by AAAS.")
29
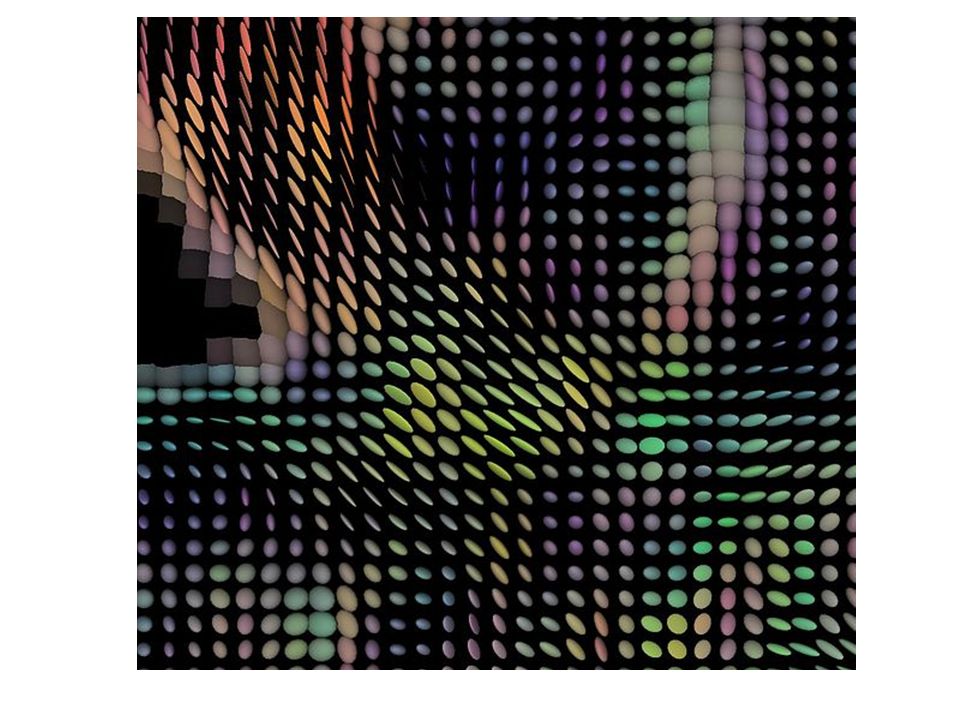
Diffusion MRI (or dMRI) is a magnetic resonance imaging (MRI) method. It allows the mapping of the diffusion of molecules, mainly water, in biological tissues, in vivo and non- invasively. Molecular diffusion in tissues depends on interactions with many obstacles, such as macromolecules, fibers, membranes, etc. Water molecule diffusion patterns can therefore reveal microscopic details about tissue architecture, either normal or in a diseased state.

32
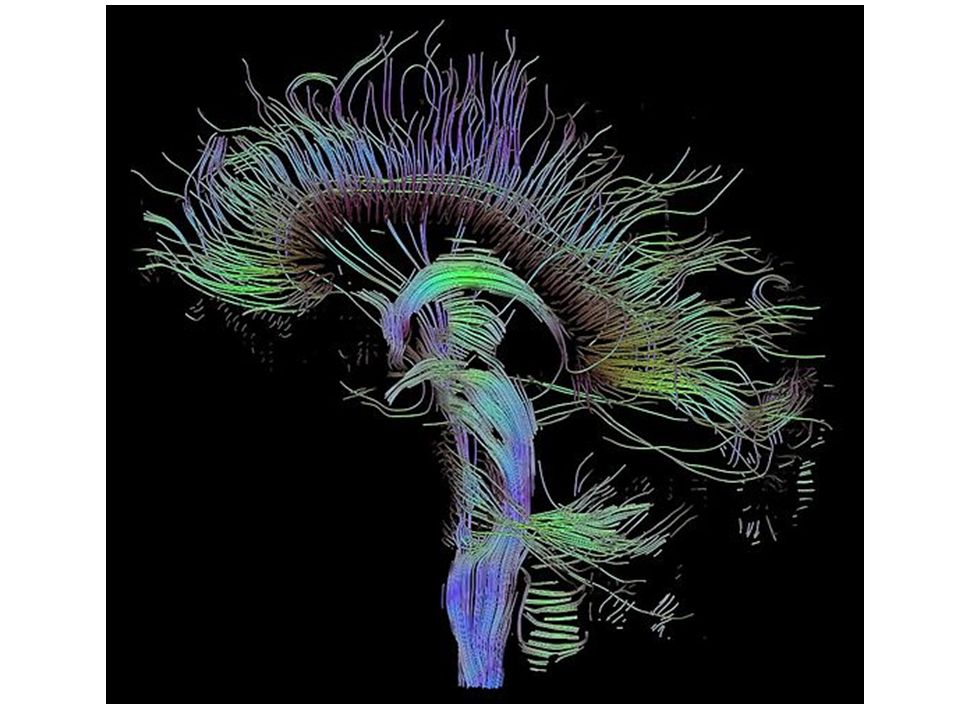
Figure 2. Tractography. Hagmann P, Kurant M, Gigandet X, Thiran P, et al. (2007) Mapping Human Whole-Brain Structural Networks with Diffusion MRI. PLoS ONE 2(7): e597. doi:10.1371/journal.pone.0000597 http://www.plosone.org/article/info:doi/10.1371/journal.pone.0000597
 Mapping Human Whole-Brain Structural Networks with Diffusion MRI. PLoS ONE 2(7): e597. doi: /journal.pone")
33
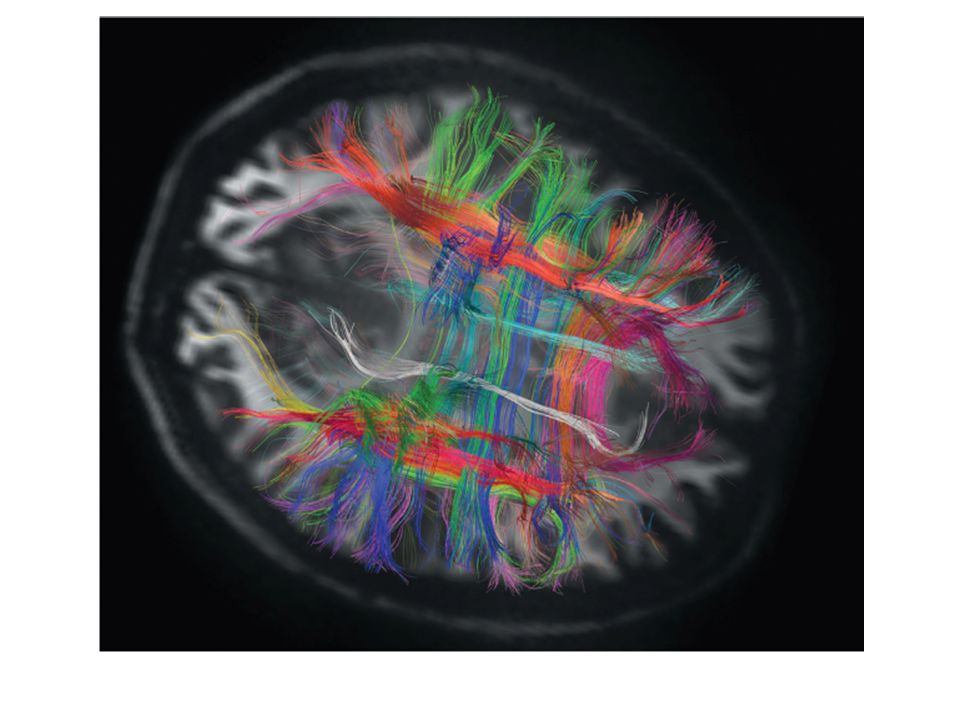
Fig. 2 Convergence: structural and functional brain network organization.(A) Whole-brain fiber bundles reconstructed from diffusion tensor MRI are colored according to their connection similarity (8). H Park, and K Friston Science 2013;342:1238411 Published by AAAS
 Whole-brain fiber bundles reconstructed from diffusion tensor MRI are colored according to their connection similarity (8). H Park, and K Friston Science 2013;342: Published by AAAS.")
34
P Stern Science 2013;342:577 Published by AAAS

36
Figure 1. Mapping the network of brain structural connectivity with diffusion MRI is a process made of four steps. Hagmann P, Kurant M, Gigandet X, Thiran P, et al. (2007) Mapping Human Whole-Brain Structural Networks with Diffusion MRI. PLoS ONE 2(7): e597. doi:10.1371/journal.pone.0000597 http://www.plosone.org/article/info:doi/10.1371/journal.pone.0000597
 Mapping Human Whole-Brain Structural Networks with Diffusion MRI. PLoS ONE 2(7): e597. doi: /journal.pone")
37
Figure 6. Visual system white matter connectivity derived from tractography: Views from the left (a), from the top (b), zoomed anterior (c) and posterior (d). Hagmann P, Kurant M, Gigandet X, Thiran P, et al. (2007) Mapping Human Whole-Brain Structural Networks with Diffusion MRI. PLoS ONE 2(7): e597. doi:10.1371/journal.pone.0000597 http://www.plosone.org/article/info:doi/10.1371/journal.pone.0000597
, from the top (b), zoomed anterior (c) and posterior (d). Hagmann P, Kurant M, Gigandet X, Thiran P, et al. (2007) Mapping Human Whole-Brain Structural Networks with Diffusion MRI. PLoS ONE 2(7): e597. doi: /journal.pone")
Similar presentations


. Neuromuscular junction Neuromuscular junction : the synapse between motor neuron and muscle fibre Motor neurons : are the.>")


, Magnetoencephalography.>")