Download presentation
Presentation is loading. Please wait.

1
Greater Oxford Area Tree Canopy Analysis 2006 vs. 1976 Oxford Tree Board / Ole Miss Funded by an Urban & Community Forestry Grant from the MS Forestry Commission & Ole Miss

2
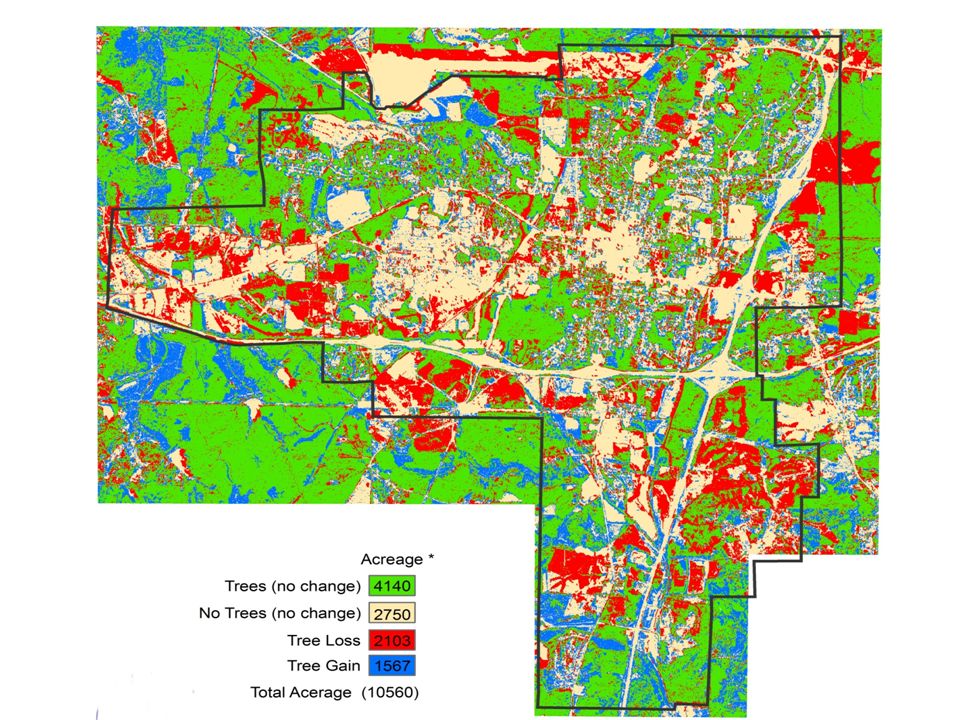
Analysis Techniques 1976 and 2006 aerial photos were analyzed to determine the change in Tree Canopy –Canopy Cover, No Change –No Canopy, No Change –Tree Loss Area –Tree Gain Area Resolution: 5 ft. X 5 ft. (vs. 100 ft. x 100 ft.) Study Area: 10,500 acres (16.5 Sq. Miles) City Limits: 6,849 acres (10.7 Sq. Miles) [City Limits = 65% of total study area]
 Study Area: 10,500 acres (16.5 Sq. Miles) City Limits: 6,849 acres (10.7 Sq. Miles) [City Limits = 65% of total study area].")
4
Looks Like Good News Oxford’s Canopy 2006 = 44.6% – A 17.1% Loss from 1976 630 Acres (1 Sq Mi.) County’s Canopy 2006 = 71.5% –A 3.7% Gain from 1976 100 Acres (¼ Sq Mi.) Total Canopy 2006 = 54.0% –A 8.6% Loss 530 Acres (¾ + Sq Mi. )
.")
5
BUT …. This study was about the Past During the Study Period, Tree Gain off-set most of the Tree Loss; 2,103 acres lost vs. 1,567 gained. This will not hold true in the future ! Tree Gain Area: Only 1/4 of the historic Tree Gain area will be a factor in the future. (Small areas of trees in newer developments) 3/4’s was due to large areas of “converted” farms (These opportunities no longer exist.) Tree Loss Area: Most (90%) occurred during the last decade.
 3/4’s was due to large areas of converted farms (These opportunities no longer exist.) Tree Loss Area: Most (90%) occurred during the last decade..")
6
The Future of Oxford’s Canopy Over the last 10 years, the average actual canopy loss has been: 117 Acres per Year (1 Sq Mile every 5 years) But - historical averages aren’t appropriate given our unprecedented growth.
 But - historical averages aren’t appropriate given our unprecedented growth.")
7
Future Rate of Change Building Permit Fees are a more reliable predictor for future canopy loss From 1997 to 2005, each $1,000 in fees equates to over ¾ of an acre lost. 0.78 acres / $1,000

8
Canopy Lost / Fee $ (1997 thru 2005 Trend: + 19 acres/yr) Acres Lost
 Acres Lost")
9
Canopy Lost / Fee $ (1997 thru 2006 Trend: + 30 acres/yr) Acres Lost
 Acres Lost")
10
Oxford’s Canopy Future If the current rate of loss is NOT reduced, in 2007 We fall below a 40% Canopy Cover (The Minimum “Healthy” Canopy) 2009 We fall below a 30% Canopy Cover (The “Crisis” Canopy Level) (For areas east of the MS River, American Forest)
 2009 We fall below a 30% Canopy Cover (The Crisis Canopy Level) (For areas east of the MS River, American Forest)")
11
The Impact of 2006 ! (Acres LOST since the study was done) S/E Corner of S.Lamar @ Veterans Dr. 1976 Feb 2006

12
Windsor Falls – 105 Acres

13
Grove Hill; 40+ Acres

14
West Jackson; 12 Acres

15
The Future of Oxford’s Canopy These three 2006 developments account for 135% of the average annual canopy loss acres. All were in compliance with our codes. Total canopy loss for 2006 is projected to be more than twice the average loss over the last 9 years (234+ acres). This Trend is Disturbing and at worst Alarming. –Building Permit Fees (where are they going?) –Impact of known Future Development Plans
. This Trend is Disturbing and at worst Alarming. –Building Permit Fees (where are they going ) –Impact of known Future Development Plans.")
17
Proposed Site of Ole Miss’ Business Park (What will this look like in 2007/8 ?) 1976 2006
")
18
Canopy Value / Benefits Improve Air Quality, Reduce air pollution, Mitigate heat island effect, Shade buildings and reduce energy usage, Increase property values, Absorb Carbon Dioxide & store Carbon. Enhance streetscapes and “Sense of Place” Watershed Benefits

19
Watershed Benefits Provided by the Tree Canopy Leaves, branches and stems of trees intercept rainfall. This reduces the total volume of runoff and delays the onset of peak flows. Rainfall collected either evaporates or drips down to the ground and is absorbed (a mature tree can store 50 to 100 gallons of water). Trees also increase the capacity of the soil to absorb and store rainfall by transpiring water through their leaves, reducing soil moisture.
. Trees also increase the capacity of the soil to absorb and store rainfall by transpiring water through their leaves, reducing soil moisture..")
20
Watershed Issues As our Canopy declines, handling storm- water run-off is becoming a much more important concern of Oxford & its citizens. Without tougher canopy controls, this concern will only grow – especially in Hilly terrain. The cost of in-action is huge!

21
Canopy’s Watershed $ Value American Forests’ specific analysis of Oxford’s canopy showed: $108,500 is needed to provide an equal amount of storm-water handling infrastructure that each acre of canopy currently provides. The capital expense needed to replace Oxford’s canopy is $118.6 Million; with an annual value of $10.3 Million / year (20 year bonds @ 6%). (Lower than a more detailed study would produce.) AF 01: 17.3% Canopy (54%) & 1,093 Acres (5,700) $ Indexed up @ 5%/yr (USDA: NRCS TR-55 Model with 2 yr, 24 hr rainfall of 4.25 inches)
. (Lower than a more detailed study would produce.) AF 01: 17.3% Canopy (54%) & 1,093 Acres (5,700) $ Indexed 5%/yr (USDA: NRCS TR-55 Model with 2 yr, 24 hr rainfall of 4.25 inches).")
22
To Maintain a Healthy Canopy Level, we need to start thinking Differently: Our Canopy is made-up of ALL the trees in Oxford, not just those on City Property (10%) Each Tree should be considered important To paraphrase Senator Everett Dirksen: “A tree here and a few trees there, and pretty soon you’re talking about a real forest.” Understand our tree canopy is a valuable asset, similar to other community infrastructures (roads, sewer system, electric power grid and storm- water facilities).
 Each Tree should be considered important To paraphrase Senator Everett Dirksen: A tree here and a few trees there, and pretty soon you’re talking about a real forest. Understand our tree canopy is a valuable asset, similar to other community infrastructures (roads, sewer system, electric power grid and storm- water facilities).")
23
Recommended Actions Increase community awareness of the importance of the area’s Tree Canopy Encourage All Developers to respect the existing terrain and tree cover Establish stronger protection for our declining Tree Canopy, including the modification of City Ordinances. Strongly enforce protection of trees ID to be retained (per approved site plan review) Promote more aggressive tree planting
 Promote more aggressive tree planting.")
24
Possible Ordinance Changes Make the Preservation of the Area’s canopy an explicit priority concern for development Only allow trees to be removed when in the foot- print of the development’s impervious surfaces Require a permit to remove any mature canopy tree (Hilly terrain more restrictive) Reduce the number of parking spaces required in large lots (e.g. Wal-Mart) Promote pervious surfaces in developments Research other communities efforts to improve their control over this valuable asset
 Promote pervious surfaces in developments Research other communities efforts to improve their control over this valuable asset.")
25
Summary The last decade shows a dramatic decline in the area’s tree canopy The rate of loss is growing dramatically The economic value of this critical community asset is huge ($10.3 M / Yr) Per request of the Board of Aldermen, the Tree Board is working with the Planning Dept to develop recommended changes to the City’s Land Development Code to better manage and protect our Canopy.
 Per request of the Board of Aldermen, the Tree Board is working with the Planning Dept to develop recommended changes to the City’s Land Development Code to better manage and protect our Canopy.")
Similar presentations


 918.392.5621 (F) WWW.MESHEKENGR.COM CITY OF TULSA Fee-in-Lieu of Detention,>")


