Download presentation
Presentation is loading. Please wait.

1
Valerie Henry, NBCT, Ed.D. UC Irvine -vhenry@uci.edu November 14, 2008

2
Goals Evidence from our candidates’ Teaching Events Modifying instruction Ongoing teaching-assessment-revision Applying what we’re learning to our Embedded Assessments

3
Two years into the Teaching Event Realized that students were struggling in the Assessment and Reflection categories We tweaked the daily reflection prompts on the daily lesson planner to help students with the Reflection commentary Started thinking about how to scaffold an experience with whole-class assessment to organize and analyze data

4
First Intervention Identified fractions and decimals as a key topic We developed a sample fraction/decimal assessment – 4 th grade Created a set of mock student assessments, with a range of performance levels Created a spreadsheet/graphic organizer to organize and display assessment data Used TE commentary prompts

6
Next Steps Evidence from students’ “practice” commentaries Weak analysis; students weren’t able to create language to identify groups of students, and support with evidence Added sentence starters as samples of the kind of language students need We now provide responses for questions 1, 2, and 3

7
Next Steps (cont.) #4 and 7 We reworded the prompts to help students organize their responses We also give original prompts Deleted question 5 because they have no student context, and we are conscious of workload
 #4 and 7 We reworded the prompts to help students organize their responses We also give original prompts Deleted question 5 because they have no student context, and we are conscious of workload")
8
Results Success rate on assessment task has improved Students are also talking about how they can see using this process in their classrooms!

9
This Fall (4 years in) We provide standards, then match problems to standards, and create categories for chart Record one student’s work as a class Then have students practice with one or two more students Then we provide the completed chart online Introduce the assessment chart grid Whole class/subgroup/individuals Understandings/misunderstandings What questions do you see that everyone understands What misunderstandings do you see? What’s the problem/concept? What’s the error? What’s the misunderstanding? Using one of the 6 categories, look at the prompts Emphasize need to support with student evidence Expectation – write about two different math issues per cell – probably six different paragraphs

11
Question 7 – Next Steps If they use analysis chart, they can go back to the 6 cells and then provides a focus area for considering next steps Reminder to consider next steps for students who have mastered content, as well as students who need extra support

12
Feedback Students will give written feedback for the three students they will return with write-up We’ll take a look at this after TEs completed in the spring.

13
Multiple subject math – practice for TE Secondary math – practice for TE Multiple subject literacy – embedded assessment

14
Literacy Embedded Signature Assessment First year (2007-2008) students brought in class sets of student work ESA prompts come directly from the assessment commentary prompts for the Elementary Literacy Teaching Event. Used same graphic organizer strategy Specific criteria for evaluating writing Content Main idea Using descriptive detail Supporting evidence from the story/essay Grammar/mechanics Sentence structure Spelling, punctuation, capitalization

15
Literacy Embedded Signature Assessment Problematic because: No common ground for discussion and building understanding of the process This year, requested and received class sets of writing from master teachers May use two sets of writings this year: One for in-class practice One for independent, individual Embedded Signature Assessment (ESA) This year, may provide student context; students will have to do #1-4, 6, 7 on their own Still thinking about question 5 – whether to include or not #6 is a new prompt this year – will have students attempt without specific scaffolding and will adjust next year as needed
 This year, may provide student context; students will have to do #1-4, 6, 7 on their own Still thinking about question 5 – whether to include or not #6 is a new prompt this year – will have students attempt without specific scaffolding and will adjust next year as needed")
16
Literacy Embedded Signature Assessment First year (2007-2008) Went from whole-class graphic summary straight to commentary writing Difficult to transition graphic summary into text in organized, comprehensive manner This year, planning to add the analysis chart
 Went from whole-class graphic summary straight to commentary writing Difficult to transition graphic summary into text in organized, comprehensive manner This year, planning to add the analysis chart")
17
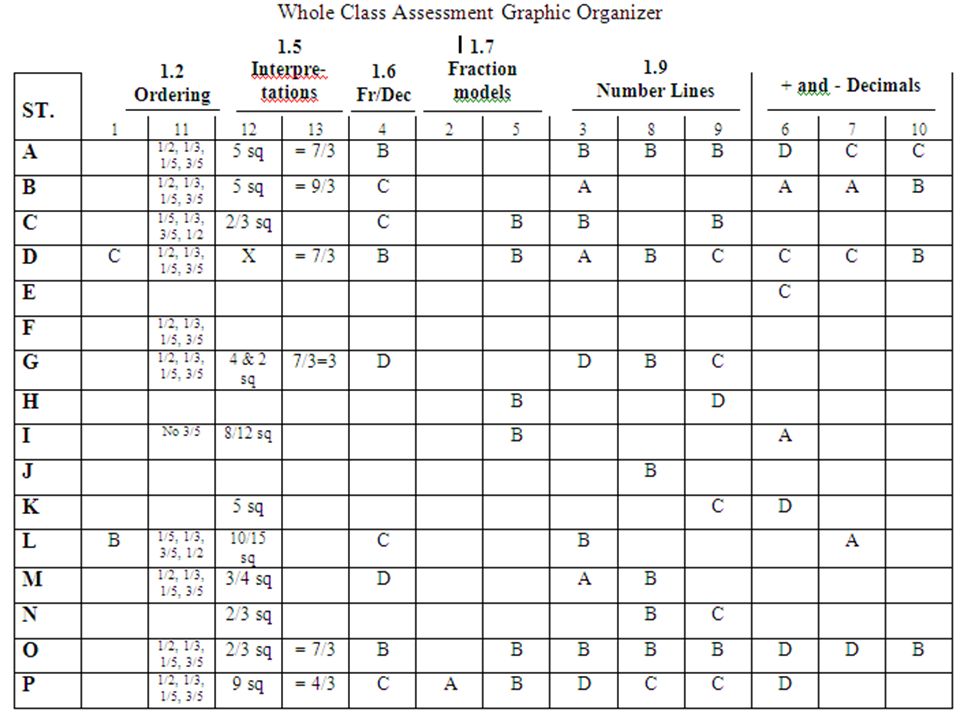
Insert completed graphic organizer

18
What instructional materials are effective in supporting candidates to learn how to assess student learning? 1. I thought that I had another presenter lined up, but he is unable to come after all, so you’ll be the sole presenter. So I’d appreciate it if you can share the entire story about how the UCI instructors/supervisors identified assessment as an area for program improvement, got together, and planned the changes in instruction in the math methods course. And then describe the materials and how they are designed to support candidate learning about assessing students. And since you’ve had 1-2 years of subsequent candidate performance, did you make additional changes in the course after you saw the candidate work? (I’m trying to drive home that the Teaching Event can be useful for program improvement.) If you finish early, that’s okay. Often, though, there are people in the audience with their own pedagogical strategies. 2. The purpose is to make us all smarter about the issue on which you are presenting, so it should be practitioner-oriented and not like a research conference presentation. You can’t go wrong by asking yourself what you know now that would have been useful to know when you began implementing PACT. 3. I’m asking you to prepare a handout with key points from your presentation (see #2) and/or useful documents that programs can use as a model. (Examples might be a syllabus for the math methods course.) Bring 40 copies and if they run out, refer people to the website (www.pacttpa.org). Don’t share anything that you wouldn’t want to see widely circulated. I’m also asking you to send me a copy of what you share; this can be after the conference if you run short of time, but I promise to keep asking until I get it. I will add the institution, and the date as a footer to all documents you give me before we upload them. Jeanne already gave me a copy of the spreadsheet to share on our website (see attached document), and it is up there as an example.www.pacttpa.org
 If you finish early, that’s okay. Often, though, there are people in the audience with their own pedagogical strategies. 2. The purpose is to make us all smarter about the issue on which you are presenting, so it should be practitioner-oriented and not like a research conference presentation. You can’t go wrong by asking yourself what you know now that would have been useful to know when you began implementing PACT. 3. I’m asking you to prepare a handout with key points from your presentation (see #2) and/or useful documents that programs can use as a model. (Examples might be a syllabus for the math methods course.) Bring 40 copies and if they run out, refer people to the website ( Don’t share anything that you wouldn’t want to see widely circulated. I’m also asking you to send me a copy of what you share; this can be after the conference if you run short of time, but I promise to keep asking until I get it. I will add the institution, and the date as a footer to all documents you give me before we upload them. Jeanne already gave me a copy of the spreadsheet to share on our website (see attached document), and it is up there as an example.")
19
Four Years In We provide standards, then match problems to standards, and create categories for chart Record one student’s work as a class Then have students practice with one or two more students Then we provide the completed chart online Introduce the assessment chart grid Whole class/subgroup/individuals Understandings/misunderstandings What questions do you see that everyone understands What misunderstandings do you see? What’s the problem/concept? What’s the error? What’s the misunderstanding? Using one of the 6 categories, look at the prompts Emphasize need to support with student evidence Expectation – write about two different math issues per cell – probably six different paragraphs

Similar presentations