Download presentation
Presentation is loading. Please wait.

1
Foundations of a Science of Visualization
Ware, Chapter 1 University of Texas – Pan American CSCI 6361, Spring 2014

2
Where are we now? Have seen a range of visualization systems
Indeed, have done a ~1/4 semester “catalog”! 1D to nD, graphs, networks, text Have seen a widely accepted model of the visualization process Now, will look at what we can learn about a “science of visualization” in order to design and evaluation visualization systems Recall, visualization, and a visualization system, is about “insight” It is humans (“users”) who have insight We are designing systems, then, for humans!
 who have insight. We are designing systems, then, for humans!")
3
Where are we now? Have seen a range of visualization systems
Indeed, have done a ~1/4 semester “catalog”! 1D to nD, graphs, networks, text Have seen a widely accepted model of the visualization process Now, will look at what we can learn about a “science of visualization” in order to design and evaluation visualization systems Recall, visualization, and a visualization system, is about “insight” It is humans (“users”) who have insight We are designing systems, then, for humans! So, we’ll look at how humans work And, in particular, about elements of humans important for designing visualizations
 who have insight. We are designing systems, then, for humans! So, we’ll look at how humans work. And, in particular, about elements of humans important for designing visualizations.")
4
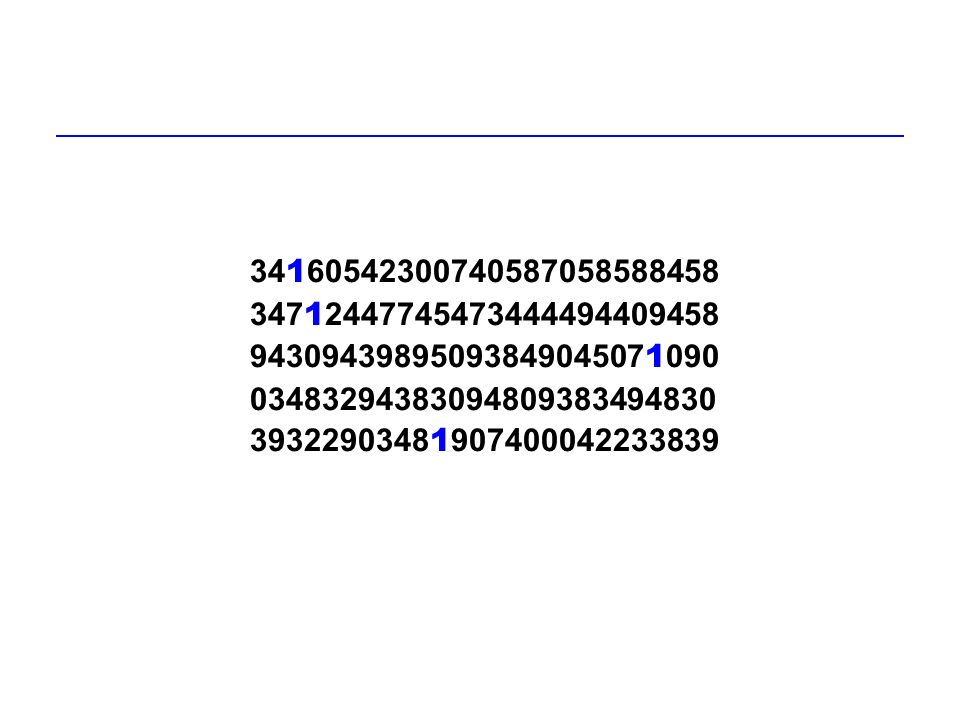
An Illustration Count the number of 1’s in the tables that follow

6
Test How many 1’s did you find? Another time:

8
Test How many 1’s did you find? Another time:

10
Test How many 1’s did you find? OK … Another time, how many 2’s?

12
Test How many 2’s did you find?

13
An Illustration of Pre-attentive Processing
Can do certain things to visual elements to increase likelihood of identification after even brief exposure Certain simple shapes or colors “pop out” from surroundings Due to “pre-attentive” processing i.e., occurs before mechanisms of conscious processing occur Pre-attentive processing determines what objects are made available for attention (allocation of processing resources) Understanding of what processed pre-attentively direct and important contribution of vision science to data visualization See Healy at
 Understanding of what processed pre-attentively direct and important contribution of vision science to data visualization. See Healy at")
14
An Illustration of Pre-attentive Processing
Can do certain things to visual elements to increase likelihood of identification after even brief exposure Certain simple shapes or colors “pop out” from surroundings Due to “pre-attentive” processing i.e., occurs before mechanisms of conscious processing occur Pre-attentive processing determines what objects are made available for attention (allocation of processing resources) Understanding of what processed pre-attentively direct and important contribution of vision science to data visualization See Healy at Will work through many elements of human sensation and perception that by understanding provide the tools for effective visualization design
 Understanding of what processed pre-attentively direct and important contribution of vision science to data visualization. See Healy at Will work through many elements of human sensation and perception that by understanding provide the tools for effective visualization design.")
16
Overview Introductory points
Ware’s orientation Advantages of visualization … recall, the forest Amplifying cognition … and external aids … the forest for cognitive systems Visualization stages Interaction, data gathering, … Semiotics of graphics Sensory vs. arbitrary languages Testing claims about sensory languages JJ Gibson’s affordance theory A model of perceptual processing

17
Introductory Points: “Visualization” - the Word … worth mentioning again
A language point (Ware notes): Dictionary: “Visualization” - internally: Constructing a visual image in the mind As in, “My visualization of the Taj Mahal …” “Visualization” – externally: Graphical representation of data or concepts As in, “The visualizations of atomic paths show …” Both An internal construct of the mind And an external artifact Which is what the course is principally about And especially about computer visualizations Primarily in Exploring and interpreting data Supporting decision making “useful” in context of some task vs. aesthetically pleasing alone
: Dictionary: Visualization - internally: Constructing a visual image in the mind. As in, My visualization of the Taj Mahal … Visualization – externally: Graphical representation of data or concepts. As in, The visualizations of atomic paths show … Both. An internal construct of the mind. And an external artifact. Which is what the course is principally about. And especially about computer visualizations. Primarily in. Exploring and interpreting data. Supporting decision making. useful in context of some task vs. aesthetically pleasing alone.")
18
Ware: The Context for Visualization and Ware’s Orientation
Ware starts book with point “providing context for” study of visualization as a science Just as physics, chemistry, biology, etc. are sciences Not sure where in the curricula of higher education you might have encountered such ideas ... E.g., some other science course, philosophy, philosophy of science, ..., or maybe nowhere “A brief treatise on naïve reductionism” … and values Such misunderstandings … and differences occur

19
Ware: The Context for Visualization, 1
Reductionism, emergence, and largest unsolved problems Ware cites Horgan’s (1997) argument that much of science is finished to challenge, but there are many others High energy physics, biology and dna … Ware describes the “physics-centric” view Physics as “queen” of science, then biology, chemistry, … Sciences of information, the mind, humans, organizations, etc. not viewed as on a par with above + “Just get the bottom level right, and it all falls out …” But, problems of next level are “emergent” I.e., only appear at “higher level”, and then can’t be predicted E.g., social organizations, …, ants, antelopes, …
 argument that much of science is finished to challenge, but there are many others. High energy physics, biology and dna … Ware describes the physics-centric view. Physics as queen of science, then biology, chemistry, … Sciences of information, the mind, humans, organizations, etc. not viewed as on a par with above. + Just get the bottom level right, and it all falls out … But, problems of next level are emergent I.e., only appear at higher level , and then can’t be predicted. E.g., social organizations, …, ants, antelopes, …")
20
Ware: The Context for Visualization, 2
In fact each level builds on the previous, with disciplines dealing with ever more complex, difficult (and important?) subject matter Somewhat the other way around … Plus value scale - Ware: “It is difficult to conceive of a value scale for which the mechanisms of thought are not of fundamentally greater interest and importance than the interaction of subatomic particles.” E.g., it is cognitive and social mechanisms that have allowed science as an epistemology to become preeminent, and understanding those processes is important E.g., Science itself built using socially constructed symbol systems, and the peer review system is inherently social
 subject matter. Somewhat the other way around … Plus value scale - Ware: It is difficult to conceive of a value scale for which the mechanisms of thought are not of fundamentally greater interest and importance than the interaction of subatomic particles. E.g., it is cognitive and social mechanisms that have allowed science as an epistemology to become preeminent, and understanding those processes is important. E.g., Science itself built using socially constructed symbol systems, and the peer review system is inherently social.")
21
Ware: The Context for Visualization, 3
Ware notes that in recent decades significant advances in understanding cognition and neuroscience have been made Allowing more effective systems Role of artifacts as cognitive tools explicitly recognized Books, measurement instruments, analysis instruments, and for us computer is a heck of an artifact, … more later Distributed cognitive systems Individuals and cognitive tools in organizations Thinking through interactions Cognitive systems theory

22
Ware: The Context for Visualization, 4
Distributed cognitive systems … Thinking through interactions, cognitive systems theory Ware: “Visualizations have a small but crucial and expanding role in cognitive systems.” Visual system and display highest bandwidth channel between human and computer Also, role in developing systems that better utilize visualizations (and all) through tighter and better loop among person, computer-based tool, and other individuals Consider human, computational power of computer, information resources of www, connectivity among potentially all individuals, … more later
 through tighter and better loop among person, computer-based tool, and other individuals. Consider human, computational power of computer, information resources of www, connectivity among potentially all individuals, … more later.")
23
Introductory Points: Ware’s Orientation, 1
Visualization Applies vision research to practical problems of data analysis As engineering physics applies physics to practical problems As engineer has influenced physicists to become more concerned with areas such as semiconductor technology, Might be that development of applied science of data visualization can encourage vision researchers to intensify efforts in addressing such problems as 3D space and task-oriented perception As importance of visualization grows, so do benefits of scientific approach to visualization model A, model T, … ad hoc New symbols systems are being developed constantly to meet needs of a society increasingly dependent on data once developed, may stay for a very long time, so should try to get right … arbitrary vs. sensory systems (much more later)
")
24
Introductory Points: Ware’s Orientation, 2
Key distinction - sensory and arbitrary conventional symbols (Ch. 1) sensory symbols are “natural” – easily learned, … Make use of / are in concert with perceptual processes arbitrary symbols are, well, arbitrary And, why study visualization as a science at all? With no basic model of visual processing on which can support ideas of a good data representation, ultimately the problem of visualization comes down to establishing a consistent notation If the best representation is simply the one we know best because it is embedded in our culture, then standardization is everything There is no good representation, only widely shared convention In opposition to the view that everything is arbitrary …
 sensory symbols are natural – easily learned, … Make use of / are in concert with perceptual processes. arbitrary symbols are, well, arbitrary. And, why study visualization as a science at all With no basic model of visual processing on which can support ideas of a good data representation, ultimately the problem of visualization comes down to establishing a consistent notation. If the best representation is simply the one we know best because it is embedded in our culture, then standardization is everything. There is no good representation, only widely shared convention. In opposition to the view that everything is arbitrary …")
25
Introductory Points: Ware’s Orientation, 3
In opposition to the view that everything is arbitrary: Book takes view that all humans do have more or less the same visual system And … 1. Visual system has evolved over 10s of millions of years to enable creatures to perceive and act within the natural environment 2. Although very flexible, the visual system is tuned to receiving data presented in certain ways, but not in others 3. If we can understand how the mechanism works, we can produce better displays and better thinking tools And this is why should study visualization as a science And if we can understand (here, learn) how works, can also work toward this
 how works, can also work toward this.")
26
Advantages of Visualization

27
Advantages of Visualization The forest – not new to you, Ware’s orientation
Can comprehend huge amounts of data … a million here Allows perception of emergent properties E.g., pockmarks not anticipated, but are immediately evident – lined up – and suggest further attention (gas escape) Often shows problems with data itself E.g., linear ripples Facilitates understanding of both large and small scale features of data Facilitates hypothesis formation – inductively – as noted E.g., what is significance of pockmarks? Recall, visualization, and lots of things, amplify human cognition
 Often shows problems with data itself. E.g., linear ripples. Facilitates understanding of both large and small scale features of data. Facilitates hypothesis formation – inductively – as noted. E.g., what is significance of pockmarks Recall, visualization, and lots of things, amplify human cognition.")
28
Amplifying Cognition Recall from Card et al. paper
Humans think by interleaving internal mental action with perceptual interaction with the world External aids: Slide rule, books, … and artifacts generally This interleaving is how human intelligence is expanded Within a task (by external aids) Across generations (by passing on techniques) External graphic (visual) representations are an important class of external aids Don Norman is an influential cognitive scientist The power of the unaided mind is highly overrated. Without external aids, memory, thought, and reasoning are all constrained. .. It is things that make us smart. (Norman, 1993, p. 43) External Cognition
 Across generations (by passing on techniques) External graphic (visual) representations are an important class of external aids. Don Norman is an influential cognitive scientist. The power of the unaided mind is highly overrated. Without external aids, memory, thought, and reasoning are all constrained. .. It is things that make us smart. (Norman, 1993, p. 43) External Cognition.")
29
How Visualization Amplifies Cognition, 1/6 (opt.)
Increased Resources Reduced Search Enhanced Recognition of Patterns Perceptual Inference Perceptual Monitoring Manipulable Medium

30
How Visualization Amplifies Cognition, 2/6 (opt.)
Increased Resources High-bandwidth hierarchical interaction Visual system partitions “automatically” Parallel perceptual processing E.g., some attributes parallel vs. serial, e.g., text Offload work from cognitive to perceptual system E.g., “recoding” of problems to exploit perception Expanded working memory Just storing things staticly vs. (short term) memory Expanded storage of information And store large as well, e.g., maps
 memory. Expanded storage of information. And store large as well, e.g., maps.")
31
How Visualization Amplifies Cognition, 3/6 (opt.)
Reduced Search Locality of processing Can group things together (collecting information) High data density Small space for large info. (scattergrams, etc.) Spatially indexed addressing Group spatially, vs. tables
 High data density. Small space for large info. (scattergrams, etc.) Spatially indexed addressing. Group spatially, vs. tables.")
32
How Visualization Amplifies Cognition, 4/6 (opt.)
Enhanced recognition of patterns Recognition instead of recall Just visualization and its inherent ability to provide organization of large n elts., vs. bringing up from memory Abstraction and aggregation Again, organization inherent in mapping abstract or numerical data to spatial Visual schemata for organization Organization by some attribute, e.g., time, enhances pattern detection Value, relationship, trend … and reveal these, as well

33
How Visualization Amplifies Cognition, 5/6 (opt.)
Perceptual inference Visual representations make some problems obvious Graphical computations Some computations can use graphical aids in a straightforward fashion, e.g., slide rule

34
How Visualization Amplifies Cognition, 6/6 (opt.)
Perceptual monitoring Allow for monitoring of large number of events in parallel Can exploit perceptual/automatic change in focus of attention through motion or change in color, etc. Manipulable medium Visualizations (interactive) support rapid implicit and explicit user “hypothesis testing” with low cognitive load
 support rapid implicit and explicit user hypothesis testing with low cognitive load.")
35
Visualization Stages – Ware
Various, relatively similar “models of the use of visualization …” exist Here’s Ware’s take for the book … and there are differences

36
Visualization Stages – Ware, 1
Collection, storage of data Preprocessing to transform data into something we understand Display hardware and graphics algorithm that produce image on screen + visual mappings Human perceptual and cognitive system … and feedback loops … and environments Provides theoretical framework for further analysis about efficacy of visualization

37
Visualization Stages – Ware, 2
An iterative process Longest feedback loop is collecting data! Even collecting more data can be result Preprocessing may change as a result of seeing how comes out Visualization use itself is highly interactive Change views, parameter range, etc.

38
Visualization Stages – Ware, 3
“Environments” Clearly, physical environment influences i.e., is source of data (in sci. vis.) “Social environment” How data is collected and interpreted From what is collected to how it is interpreted Driven by current science and scientists’ world view E.g., Copernicus and Ptolemy
 Social environment How data is collected and interpreted. From what is collected to how it is interpreted. Driven by current science and scientists’ world view. E.g., Copernicus and Ptolemy.")
39
Visualization Stages – Card et al. (again)
“Working model” for the class to date Note differences

40
Visualization Pipeline: Mapping Data to Visual Form, 1/3
Raw Information Visual Form Dataset Views User - Task Data Transformations Mappings View F F -1 Interaction Perception Chris North (online) on Card, Mackinlay, and Shneiderman Visualizations: “adjustable mappings from data to visual form to human perceiver” Series of data transformations Multiple chained transformations Human adjust the transformation Entire pipeline comprises an information visualization
 on Card, Mackinlay, and Shneiderman. Visualizations: adjustable mappings from data to visual form to human perceiver Series of data transformations. Multiple chained transformations. Human adjust the transformation. Entire pipeline comprises an information visualization.")
41
Visualization Stages, 2/3
Raw Information Visual Form Dataset Views User - Task Data Transformations Mappings View F F -1 Interaction Perception Data transformations: Map raw data (idiosynchratic form) into data tables (relational descriptions including metatags) Visual Mappings: Transform data tables into visual structures that combine spatial substrates, marks, and graphical properties View Transformations: Create views of the Visual Structures by specifying graphical parameters such as position, scaling, and clipping
 into data tables (relational descriptions including metatags) Visual Mappings: Transform data tables into visual structures that combine spatial substrates, marks, and graphical properties. View Transformations: Create views of the Visual Structures by specifying graphical parameters such as position, scaling, and clipping.")
42
Information Structure, 3/3
Raw Information Visual Form Dataset Views User - Task Data Transformations Mappings View F F -1 Interaction Perception Visual mapping is starting point for visualization design Includes identifying underlying structure in data, and for display Tabular structure Spatial and temporal structure Trees, networks, and graphs Text and document collection structure Combining multiple strategies Impacts how user thinks about problem - Mental model

43
“Compare and Contrast”
Raw Information Visual Form Dataset Views User - Task Data Transformations Mappings View F F -1 Interaction Perception .

44
Visualization, a “Language”?

45
Visualization, a “Language”?
Ware argues for a “science”, vs. “craft or art” of visualization Some argue visualization – visual representations in general - “learned language”, hence not a science Because can’t find representations better than others This is in part about sensory vs. arbitrary symbols (more later) Sensory - “innate”, unlearned E.g., parallel lines Arbitrary - learned E.g., words, natural language First, the arguments against a science of visualization…
 Sensory - innate , unlearned. E.g., parallel lines. Arbitrary - learned. E.g., words, natural language. First, the arguments against a science of visualization…")
46
Arguments against Science of Visualization
1. Visualization about diagrams and how they convey meaning a. Diagrams are generally held to be made up of symbols b. Symbol: mapping of sign to meaning (semantics), e.g., characters of word to its meaning, the string “dog” -> 2. Symbols are based on social interaction (learned) a. Meaning of a symbol created by convention b. Established in course of person-to-person communication 3. Diagrams are arbitrary and are effective in much same way as written or spoken words a. Must learn conventions of the language, better learned, clearer is language b. Thus, one diagram may be as good as another – just a matter of learning the code (mapping conventions) 4. So, given learned nature of diagrams Laws of perception largely irrelevant And there is no usefulness in approaching visualization as a science i.e., as a non-arbitrary mapping of pictures to meaning influenced by the laws of perception
, e.g., characters of word to its meaning, the string dog -> 2. Symbols are based on social interaction (learned) a. Meaning of a symbol created by convention. b. Established in course of person-to-person communication. 3. Diagrams are arbitrary and are effective in much same way as. written or spoken words. a. Must learn conventions of the language, better learned, clearer is language. b. Thus, one diagram may be as good as another – just a matter of learning the code. (mapping conventions) 4. So, given learned nature of diagrams. Laws of perception largely irrelevant. And there is no usefulness in approaching visualization as a science. i.e., as a non-arbitrary mapping of pictures to meaning influenced by the laws of perception.")
47
And Ware wouldn’t have written the book, and class would be over, but …
So, will have a look at the fundamental elements of graphics, language, etc.

48
Semiotics of Graphics Semiotics
Study of symbols and how they convey meaning Surely not a new endeavor The Semiology of Graphics, Bertin, 1983 Attempt to classify all graphics marks as to how they could express data Not experimental

49
Semiotics of Graphics “Visual languages are easy to learn and use”?
Some are, some aren’t Is it familiarity? Arbitrariness? Examples vary by degree of “arbitrariness” From pictorial to purely symbolic Diagrams made up of symbols Graphic (visual) representations on right illustrate range Record of a hunt
 representations on right illustrate range. Record of a hunt.")
50
Truth, Social Context, and Scientific Visualization
Pictures as sensory language (which requires no “learning”) Might argue (in the extreme) that even pictures and diagrams are as arbitrary as characters Vs. symbols with special properties E.g., primitive cultures - … not make leap from paper representations to that which represented … shadings of gray In contrast to Ware (and others’) orientation that there can be a science of visualization, … Which addresses the “Arbitrariness” of visual representations Relationship between symbol and thing it signifies Structuralist philosophers and anthropologists Saussure, Levi-Strauss Truth is relative to its social context
 Might argue (in the extreme) that even pictures and diagrams are as arbitrary as characters. Vs. symbols with special properties. E.g., primitive cultures - … not make leap from paper representations to that which represented … shadings of gray. In contrast to Ware (and others’) orientation that there can be a science of visualization, … Which addresses the Arbitrariness of visual representations. Relationship between symbol and thing it signifies. Structuralist philosophers and anthropologists. Saussure, Levi-Strauss. Truth is relative to its social context.")
51
Truth, Social Context, and Scientific Visualization
Truth is relative to its social context Meaning in one culture may be nonsense in another E.g., trashcan for deletion meaningful to those knowing how trash cans used All meaning is relative to the culture Can interpret another culture only in the context of our own culture Using tools of our own language (a form of communication) The meaning of which is itself established through custom No one meaning is “better” than another “cultural imperialism” Since visualizations are communications, then the argument for “better” visualizations (and for a science of visualization) is called into question whew
 The meaning of which is itself established through custom. No one meaning is better than another. cultural imperialism Since visualizations are communications, then the argument for better visualizations (and for a science of visualization) is called into question. whew.")
52
Sensory vs. Arbitrary Symbols

53
Sensory vs. Arbitrary Symbols
Again, at the core of the issue of the efficacy of visualization in understanding is: How “natural” vs. “learned” are elements of visual representations Sensory symbols: “Symbols and aspects of visualization that derive their expressive power from their ability to use the perceptual processing power of the brain without learning” Arbitrary symbols: “Aspects of representation that must be learned, because the representation have no perceptual basis”

54
Sensory Symbols Sensory symbols:
“Symbols and aspects of visualization that derive their expressive power from their ability to use the perceptual processing power of the brain without learning” Effective because well matched to the early stages of perceptual processing Human visual system has evolved to detect forms and relationships in world Human visual system not a fully general purpose system Not tabla rasa Tend to be stable across individuals, cultures, and time E.g., cave drawing still conveys meaning across millenia

55
Arbitrary Symbols Arbitrary symbols:
“Aspects of representation that must be learned, because the representation have no perceptual basis” Derive power/utility from (learned) culture, so dependent on cultural milieu E.g., the ink of the characters “dog” on paper Which obviously has no chance to be perceptual, i.e., is completely a code vs. a picture of a dog Which most likely has some unlearned correspondence with the real animal And, as noted, there are those that argue that all pictorial representations arbitrary
 culture, so dependent on cultural milieu. E.g., the ink of the characters dog on paper. Which obviously has no chance to be perceptual, i.e., is completely a code. vs. a picture of a dog. Which most likely has some unlearned correspondence with the real animal. And, as noted, there are those that argue that all pictorial representations arbitrary.")
56
Sensory vs. Arbitrary Symbols
Curves, etc. of cave drawing likely are relatively sensory Effective (or not) to extent match brain’s processing Two different arbitrary graphical methods for showing relationships among entities Both are arbitrary, or learned And there are differences But, … which one is more “sensory”, and which one would you consider better for conveying information?
 to extent match brain’s processing. Two different arbitrary graphical methods for showing relationships among entities. Both are arbitrary, or learned. And there are differences. But, … which one is more sensory , and which one would you consider better for conveying information")
57
Theory of Sensory Languages
Based on idea that human visual system evolved as an instrument to perceive physical world In contrast to view that visual system is “universal machine”, “undifferentiated neural net” that can configure for any world Brain tissue appears to be undifferentiated, but in fact morphology has specific neural pathways Anatomically same pathways among primates And through experimentation some functions of some areas are know, next slide “collection of highly specialized parallel processing machines with high bandwidth interconnections” Next slides provide detail System is designed (better, evolved) to extract information from the (particular) world we live in
 to extract information from the (particular) world we live in.")
58
Visual Pathways of Humans
Humans studied “less invasively” than other species

59
Visual Pathways of Macaque Monkey
V1-4, visual areas PO, parieto-occipital area MT, middle temporal DP, dorsal prestiate area PP, posterial parietal complex STA, superiotemporal sulcus complex IT, inferotemporal cortex

60
Properties of Sensory and Arbitrary Representation
Understanding without training Resistance to instructional bias Sensory immediacy Cross-cultural validity

61
Sensory Representations: Understanding Without Training
“Sensory code” is one that is perceived without additional training Visual system evolved to perceive 3D shapes Just need to know some information is to be conveyed Top (though cluttered), 3D shape of cylinder obvious Bottom wind flow pattern spiral is obvious
, 3D shape of cylinder obvious. Bottom. wind flow pattern spiral is obvious.")
62
Sensory Representations: Resistance to Instructional Bias
Illusions provide well known example “Top figures at right have equal length lines” “Bottom figure at right have straight lines” Still looks like the lines are of unequal length, curved, and the dots move, even though told not! And there are explanations for why this way, That we’ll see later

63
Sensory Representations: Resistance to Instructional Bias
And there are not blinking or moving dots! And there are explanations for why this way That we’ll see later

64
Sensory Representations: Sensory Immediacy, Cross-Cultural Validity
Some feature processing innate, parallel and fast Of 5 regions below, distinguishing between some is easier than between others E.g., r1 vs. 2 hard Low level, “hardwired” image segmentation facilities in eye & brain Should be same across cultures, as not learned

65
Arbitrary Conventional Representations
Hard to learn E.g, thousands of hours to read and write Easy to forget Just a code, i.e., an arbitrary mapping Embedded in culture and application Red for good luck vs. danger Yet, universality of ocean charts, Arabic numbers Circle representation easier to learn, but not as extensible Formally powerful E.g., mathematics Capable of rapid change Arbitrary mappings easily changed Systems evolved over millions of years, impossible

66
(opt.) Testing Claims about Sensory Representations
(Appendix C) Different methodologies for studying arbitrary and sensory representations Sensory: vision researchers and biologists Arbitrary: social sciences, e.g., sociology, anthropology, and philosophy, e.g., semantics Research methodologies for sensory representation based on controlled experimentation Psychophysics Cognitive Psychology Structural Analysis Cross-cultural Studies Child Studies
 Different methodologies for studying arbitrary and sensory representations. Sensory: vision researchers and biologists. Arbitrary: social sciences, e.g., sociology, anthropology, and philosophy, e.g., semantics. Research methodologies for sensory representation. based on controlled experimentation. Psychophysics. Cognitive Psychology. Structural Analysis. Cross-cultural Studies. Child Studies.")
67
(opt.) Testing Claims: Psychophysics and Cognitive Psychology
Set of techniques that are based on applying the methods of physics to measurements of human sensations Successful in defining basic limits of human visual system E.g., how rapidly must a light flicker to be perceived as steady? what’s a jnd? sensory dimensions of color Usually concerned with “early” sensory processes Note, if results altered by instructions, then question whether low-level sensory mechanism Cognitive Psychology Brain is treated as “a set of interlinked processing modules” An information processing approach E.g., short term (working, buffer, +-7) and long term memory Involve measuring reaction time and error when performing some task Then, infer a set of modules and connections of differing characteristics Recently, MRI study allows determining what structure goes with function
 and long term memory. Involve measuring reaction time and error when performing some task. Then, infer a set of modules and connections of differing characteristics. Recently, MRI study allows determining what structure goes with function.")
68
(opt.) Testing Claims: Structural Analysis and Cross-cultural, Child Studies
Conduct studies more like interviews than experiments E.g., carry out task and report on what doing Piaget More “hypothesis generation”, description, classification Cross-cultural, Child Studies Again, sensory representations should hold constant across cultures, and arbitrary not E.g., color naming, establishing universality of certain color terms Because of no or little experience with graphic conventions children provide opportunity to examine sensory

69
Sensation, then Perception
“Sensation” vs. “perception” Sensation: excitation of sensory receptors Low level E.g., rate of retinal cell firing Perception: process of creating “interpretation” of sensations Unconscious, automatic Higher level Perception is about “understanding”, “giving meaning to” patterns of sensation

70
Perception Bottom up and Top down
Perception – still an open question Two emphases in theories Bottom up Low level primitives of senses (vision) assembled into successively more complex to form object E.g., points to lines or arcs to …. Top down “Higher level” mechanisms guides extraction (and search for) primitives Or both … as will see in Ware Gibson’s ideas most influential in proposing an account that incorporates “higher level” considerations
 assembled into successively more complex to form object. E.g., points to lines or arcs to …. Top down. Higher level mechanisms guides extraction (and search for) primitives. Or both … as will see in Ware. Gibson’s ideas most influential in proposing an account that incorporates higher level considerations.")
71
Gibson’s Affordance Theory

72
Gibson’s Affordance Theory, 1
Perception theorist, J. J. Gibson Ecological optics, affordances, direct perception, … Orienting assumption: we perceive to operate on the environment Perception is “designed” (or evolved) for action, so we perceive Surfaces for walking, handles for pulling, space for navigating, tools for using, … Perceivable possibilities for action, he called affordances
 for action, so we perceive. Surfaces for walking, handles for pulling, space for navigating, tools for using, … Perceivable possibilities for action, he called affordances.")
73
Gibson’s Affordance Theory, 2
“Perceivable possibilities for action”, he called affordances Claimed affordances are perceived directly and immediately (vs. piecing together atomic elements) Useful notion for visualization, as goal often decision making (broadly construed) This “top down” view contrasts fundamentally with a “bottom up” account of perception E.g., perceive (directly) surfaces for walking vs. points of light which come together to form a line, which … Though certainly directed arcs can convey same meaning – it is the indication of “operability” that is important
 Useful notion for visualization, as goal often decision making (broadly construed) This top down view contrasts fundamentally with a bottom up account of perception. E.g., perceive (directly) surfaces for walking vs. points of light which come together to form a line, which … Though certainly directed arcs can convey same meaning – it is the indication of operability that is important.")
74
Gibson’s Affordance Theory, 3
Perceivable possibilities for action … affordances Perceived directly and immediately “Top down” view contrasts fundamentally with a “bottom up” account of perception For interfaces: To create a good interface, must create it with appropriate affordances to make user’s task easy E.g., when object selected, make handles (or whatever) appear that the object might be moved (or something) Below demonstrates, hands appear to indicate possible operations when object selected Though certainly directed arcs can convey same meaning – it is the indication of “operability” that is important
 appear that the object might be moved (or something) Below demonstrates, hands appear to indicate possible operations when object selected. Though certainly directed arcs can convey same meaning – it is the indication of operability that is important.")
75
Gibson’s Affordance Theory, But …
Alternatives to Gibsonian view perception as active (vs. direct) process E.g., perceptual hypotheses are confirmed or disconfirmed based on sensory evidence Certain things about environment are deduced based on sensory evidence Problem’s with Gibson’s account for developing theory of visualization…
 process. E.g., perceptual hypotheses are confirmed or disconfirmed based on sensory evidence. Certain things about environment are deduced based on sensory evidence. Problem’s with Gibson’s account for developing theory of visualization…")
76
Gibson’s Affordance Theory, But …
Though perception of (real) environment is direct, perception of computer presented environment not Many layers of processing between display image and perception, data may in fact be abstract, etc. There are no clear physical affordances in any graphical user interface A screen button just is fundamentally different than a sidewalk “the screen button affords pressing” is a stretch Heck, it’s just an interface object that has been mapped arbitrarily to selecting And we’ve clearly learned that mapping Ignoring visual mechanisms seems inappropriate E.g., much to be learned about color perception using knowledge of neurons, psychophysics, etc. Yet, the idea of affordances seems useful in suggesting, at least metaphorically, strategies for tasks and elements of understanding
 environment is direct, perception of computer presented environment not. Many layers of processing between display image and perception, data may in fact be abstract, etc. There are no clear physical affordances in any graphical user interface. A screen button just is fundamentally different than a sidewalk. the screen button affords pressing is a stretch. Heck, it’s just an interface object that has been mapped arbitrarily to selecting. And we’ve clearly learned that mapping. Ignoring visual mechanisms seems inappropriate. E.g., much to be learned about color perception using knowledge of neurons, psychophysics, etc. Yet, the idea of affordances seems useful in suggesting, at least metaphorically, strategies for tasks and elements of understanding.")
77
A Model of Perceptual Processing Quick Overview – Rest of book covers

78
A Model of Perceptual Processing Quick Overview – Rest of book covers
What we do is design information displays! An information processing (the dominant paradigm) model “Information” is transformed and processed Physical light does excite neurons, but at this “level of analysis” consider information Gives account to examine aspects important to visualization Here, clearly, many neural subsystems and mapping of neural to ip is pragmatic In spirit of visualization as evolving discipline, yet to develop its theories, laws, … Stage 1: Parallel processing to extract low-level properties of the visual science Stage 2: Pattern perception Stage 3: Sequential goal-directed processing
 model. Information is transformed and processed. Physical light does excite neurons, but at this level of analysis consider information. Gives account to examine aspects important to visualization. Here, clearly, many neural subsystems and mapping of neural to ip is pragmatic. In spirit of visualization as evolving discipline, yet to develop its theories, laws, … Stage 1: Parallel processing to extract low-level properties of the visual science. Stage 2: Pattern perception. Stage 3: Sequential goal-directed processing.")
79
A Model of Perceptual Processing Quick Overview – Rest of book covers
Stage 1: Parallel processing to extract low-level properties of the visual science Individual neurons selectively tuned to certain kinds of information Stage 2: Pattern perception Divide visual field into regions & simple patterns Stage 3: Sequential goal-directed processing Objects held in visual memory by demands of active attention

80
A Model of Perceptual Processing Quick Overview – Rest of book covers
“Sensation” Occurs when stimuli excite receptors E.g., light strikes cells of retina “One way” “Perception” Way sensations “interpreted”, or “made sense of” “Two way” Requires several stages

81
Stage 1: Parallel Processing to Extract Low-level Properties of Visual Scene
(Very first) neurons fire - visual information 1st processed by: large array of neurons in eye primary visual cortex at back of brain Individual neurons selectively tuned to certain kinds of information e.g., color, textures, orientations of edges, movement Evoked potential experiments In each subarea arrays of neurons work in parallel extracting particular features of environment (stimulus) At early stages, parallel processing proceeds involuntarily, largely independent of what choose to attend to (though not where look) Is rapid, if want people to understand information fast, should present in way so is easily detected by these large, fast computational systems in brain Stage 1 processing is: Rapid and parallel Entails extraction of features, orientation, color, texture, and movement patterns “transitory”, only briefly held in iconic store Bottom up, data-driven
 neurons fire - visual information 1st processed by: large array of neurons in eye. primary visual cortex at back of brain. Individual neurons selectively tuned to certain kinds of information. e.g., color, textures, orientations of edges, movement. Evoked potential experiments. In each subarea arrays of neurons work in parallel. extracting particular features of environment (stimulus) At early stages, parallel processing proceeds involuntarily, largely independent of what choose to attend to (though not where look) Is rapid, if want people to understand information fast, should present in way so is easily detected by these large, fast computational systems in brain. Stage 1 processing is: Rapid and parallel. Entails extraction of features, orientation, color, texture, and movement patterns. transitory , only briefly held in iconic store. Bottom up, data-driven.")
82
Stage 2: Pattern Perception
Rapid processes Divide visual field into regions & simple patterns, e.g., Continuous contours, regions of same color/texture “Active”, but not conscious processes Specialized for object recognition Visual attention and memory E.g., for recognition must match features with memory Task performing will influence what perceived Bottom up nature of Stage 1, influenced by top down nature of Stage 3 Specialized for interacting with environment E.g., tasks involving eye-hand coordination “Two-visual system hypothesis” Locomotion and eye-hand coordination, “action system” Symbolic object manipulation, “what system” Characteristics Slow serial processing Involvement of both working (vs. iconic) and long-term memory Both bottom up and top down More emphasis on arbitrary aspects of symbols than Stage 1 Top-down processing Different pathways for object recognition and visually guided motion
 and long-term memory. Both bottom up and top down. More emphasis on arbitrary aspects of symbols than Stage 1. Top-down processing. Different pathways for object recognition and visually guided motion.")
83
Stage 3: Sequential Goal-Directed Processing
At highest level of perception are the objects held in visual memory by demands of active attention To use an external visualization, we construct a sequence of visual queries that are answered through visual search strategies Only a few objects can be held at a time They are constructed from available patterns providing answers to the visual queries E.g., if use a road map to look for a route, the visual query will trigger a search for connected red contours (representing major highways) between two visual symbols (representing cities) Are other subsystems, as well Visual object identification process interfaces with the verbal linguistic subsystems of the brain so that words can be connected to images The perception-for-action subsystem interfaces with the motor systems that contril muscle movements 3 stage model of perception is basis for organization of book (next slide)
 between two visual symbols (representing cities) Are other subsystems, as well. Visual object identification process interfaces with the verbal linguistic subsystems of the brain so that words can be connected to images. The perception-for-action subsystem interfaces with the motor systems that contril muscle movements. 3 stage model of perception is basis for organization of book (next slide)")
84
Ware’s Book Organized by 3 Stages
3 stage model of perception is basis for organization of book: Stage1, Low level parallel processing: 2: The Environment, Optics, Resolution, and the Display 3: Lightness, Brightness, Contrast, and Constancy 4: Color 5: Visual Attention and Information that Pops Out Stage 2, Pattern perception 6: Static and Moving Patterns 7: Visual Objects and Data Objects 8: Space Perception and the Display of Data in Space Stage 3, Sequential goal directed processing 9: Images, Words, and Gestures 10: Interacting with Visualizations 11: Thinking with Visualizations

85
Types of Data Goal of visualization: Entities Relationships
“transform data into a perceptually efficient visual form” So, must consider nature of data Entities Relationships Attributes of entities or relationships Operations considered as data

86
End … .

Similar presentations