Download presentation
Presentation is loading. Please wait.

1
In vitro Total control of confounding variables –Vasomotion, temperature changes, autoregulation, mean BP Most accurate because vessel examined directly Best for detailed information about mechanical properties of vessel material In vivo (invasive) Realistic clinical information Limited by technical problems –Measurement errors, transitory changes in diam. BP etc In vivo (non-invasive) Further technical problems –Especially pressure
 Further technical problems –Especially pressure.")
2
Measurement of blood pressure Invasive –Pressure catheter and transducer Non invasive –Sphygmomanometry Auscultation (by ear or automatically by microphone) Oscillometry –Volume clamp –Tonometry
 Oscillometry –Volume clamp –Tonometry")
3
Invasive –Accurate reproduction of central pressure waveforms –Risk of thrombosis and arrhythmias Non-invasive –Quick, cheap, widely used –Lack of central pressure measurement –Requires skilled and experienced operators Advantages/ drawbacks

4
Sphygmomanometry www.fmshk.com.hk/sahk/lecture_noninvasive.pp Pulse detector (stethoscope or microphone) Manometer (mercury or capsule type) Manometer (mercury or capsule type)
 Manometer (mercury or capsule type) Manometer (mercury or capsule type)")
5
Sphygmomanometry 1896 Blood pressure cuff (Riva Rocci) 1905 First report of audible detection of heart sounds used with cuff (Korotkov) 1968 Microphone used for automatic pressure measurement (Stegall)
 1905 First report of audible detection of heart sounds used with cuff (Korotkov) 1968 Microphone used for automatic pressure measurement (Stegall)")
6
Sphygmomanometry Capsule manometer Replacing mercury spymomanometer Mercury sphygmomanometer

7
Korotkov Sounds caused by vibration collapse of the arterial wall?? www.fmshk.com.hk/sahk/lecture_noninvasive.pp Cuff pressure Systolic Diastolic –Korotkoff IV is a better indication of diastolic pressure according to theory –However Korotkoff V is the commonly recommended measuring point except in pregnant patients because It is associated with less inter- observer variations It is easier to detect by most observers

8
Errors Korotkoff sounds compared to invasive blood pressure measurement –Korotkoff IV is on average 8mm Hg above the invasively measured diastolic blood pressure –Korotkoff V is on average 2mm Hg above the invasively measured diastolic blood pressure

9
Oscillometry Cuff round the arm Pressurise cuff (> systolic) Allow pressure to drop slowly to zero Measure pressure in the cuff during deflation
 Allow pressure to drop slowly to zero Measure pressure in the cuff during deflation")
10
Oscillometry: set up Pressure transducer Air pump Bleed valve Micro- processor Micro- processor Display

11
Principle of oscillometry Variation of cuff pressure as cuff is deflated Filtered signal Of cuff pressure

12
Limitations Inaccurate / unreliable in shock patients Inaccurate / unreliable in patients with arrhythmias –The algorithm of measurement assumes a regular pulse, so the reading is unreliable in patients with irregular pulse Advantages No skill required No subjective errors

13
Volume clamp Air Infra red emitter Detector Artery Finger Pressure Detected signal Change cuff pressure Measure cuff pressure To pump Diameter

14
Applanation tonometry Detects pressure of arterial pulsations through the skin

15
Problem: AorticRadial Aortic and peripheral pressures are different. The heart doesn’t care what the pressure is in the radial artery. It only “sees” aortic pressure. Aortic pressure is difficult (impossible?) to measure non- invasively Can we reconstruct the aortic waveform from the radial? 80 100 120 Systolic Diastolic Mean
 to measure non- invasively Can we reconstruct the aortic waveform from the radial Systolic Diastolic Mean.")
16
Yes we can. At least in principle Record radial waveform with tonometry Apply inverse transfer function “Reconstruct” aortic waveform –What is an inverse transfer function? –How do we reconstruct the waveform?

17
Fourier analysis H1 + H2 H3 36027018090 -2 0 1 2 H1 + H2 + H3 H4 Mean H1 H2 Measured H1+H2+H3+H4

18
Pa(t) = pa 0 + pa 1 Cos( t - a 1 ) + pa 2 Cos( t - a 2 ) + pa 3 Cos( t - a 3 ) +... Pb(t) = pr 0 + pr 1 Cos( t - r 1 ) + pr 2 Cos( t - r 2 ) + pr 3 Cos( t - r 3 ) +... For each harmonic (n) Transfer function phase = a n - r n Transfer function amplitude = pa n / pr n aortic pressureradial artery pressure
 = pr 0 + pr 1 Cos( t - r 1 ) + pr 2 Cos( t - r 2 ) + pr 3 Cos( t - r 3 ) +... For each harmonic (n) Transfer function phase = a n - r n Transfer function amplitude = pa n / pr n aortic pressureradial artery pressure.")
19
Amplification of the pulse AA - CA CA - RA AA - RA

20
How to derive the central pressure from peripheral measurements Compare Fourier series of “typical” aortic pressure waves with Fourier series of the radial pressure computed from tonometric measurements. Calculate the amplitude ratio and phase difference for each harmonic Apply this ratio and phase difference to each harmonic of the measured radial wave and reconstruct aortic wave that would when transmitted down the arm, produce the measured radial wave

21
Question How well does the typical transfer function apply to people of different ages and disease states Answer Surprisingly well considering the changes that occur in the arterial system with age and vascular disease However, most believe that more work is needed to validate the method

22
Pressure transducers (for invasive measurement) Fluid filled chamber Stiff diaphragm Measure its movement electronically To pressure to be measured, (via an intra arterial cannula) Diaphragm manometer Advantages Cheap, disposable easy to use Accurate mean pressure Disadvantages Clotting in cannula, air bubbles Therefore errors in pulse pressure
 Fluid filled chamber Stiff diaphragm Measure its movement electronically To pressure to be measured, (via an intra arterial cannula) Diaphragm manometer Advantages Cheap, disposable easy to use Accurate mean pressure Disadvantages Clotting in cannula, air bubbles Therefore errors in pulse pressure")
23
Pressure transducers (for invasive measurement - 2) Cannula tip manometer Semi conducting strain gauge Diameter may be as small as 0.67 mm Advantages High accuracy Especially in very small vessels Disadvantages No calibration possible when in position Expensive Fragile
 Cannula tip manometer Semi conducting strain gauge Diameter may be as small as 0.67 mm Advantages High accuracy Especially in very small vessels Disadvantages No calibration possible when in position Expensive Fragile")
24
Pressure: comparison of methods

25
Flow Measurement Invasive –Electromagnetic flow velocimetry –Ultrasonic transit time Non invasive –Doppler ultrasound –Ultrasonic transit time –Optical (small superficial vessels only) –MRI
 –MRI")
26
Flow measurement 1870 Fick principle described Flow in a given period of time = Amount of substance injected in that time/concentration difference before and after point of entry 1886 Fick method first used by Grehart & Quinquardt Modern instruments –Optical –Electromagnetic 1936-1937 Kolin –Ultrasonic transit time 1959 –Ultrasonic Doppler 1961 –MRI1990’s (not commercial)
")
27
i.d. 0.5 - 26 mm E = H.d.V Induced voltage Magnetic field strength Vessel diameter Mean blood velocity Electrode

28
Principle of Doppler flow velocimetry v c c f c v f ' cf ' (c v)f ' vf f ' f f v c f c c f '
f vf f f f v c f c c f")
29
Flow: comparison of methods

30
Diameter Measurement Mechanical Optical Ultrasonic –Implanted crystals –Pulse echo Cine-angiography MRI

31
Invasive Diameter Measurement Ultrasound (external transducers) IVAS TV Mechanical Cine angiography
 IVAS TV Mechanical Cine angiography")
32
Non-invasive diameter measurement Pulse echo ultrasound (direct) PWV (indirect) –Diameter wave –Flow wave –Pressure wave
 PWV (indirect) –Diameter wave –Flow wave –Pressure wave")
33
Artery Differential transformer Springy stainless steel Ultrasonic crystals (glued or sutured) Measure time delay TV camera Other diameter methods Transmitter Receiver
 Measure time delay TV camera Other diameter methods Transmitter Receiver")
34
Measure time delay between transmitted and received pulse Principle of pulse echo ultrasound

35
Diameter: comparison of methods

36
Elasticity measurement Direct –Stress pressure, tension, area, wall thickness –Strain length, diameter Indirect –Pulse wave velocity detect pressure, diameter or flow pulse

37
PWV Methods Pressure pulse –Tonometry Flow pulse –Doppler Diameter Pulse –PPG

38
Nature of the PPG Signal Commonly regarded as a measure of changes in tissue volume due to arteriolar and capillary blood flow time varying absorption of light or i.r. When detected in the vicinity of a large superficial artery, the signal is dominated by changes in the diameter (volume) of the artery.
 of the artery..")
39
SKIN ARTERY FLOW Downstream probe MUSCLE/BONE Upstream probe Infra red emitterDetector Loukogeorgakis, et al. (2002). Physiological Measurement 23: 581-96. Optical detection of the diameter wave
. Physiological Measurement 23: Optical detection of the diameter wave.")
40
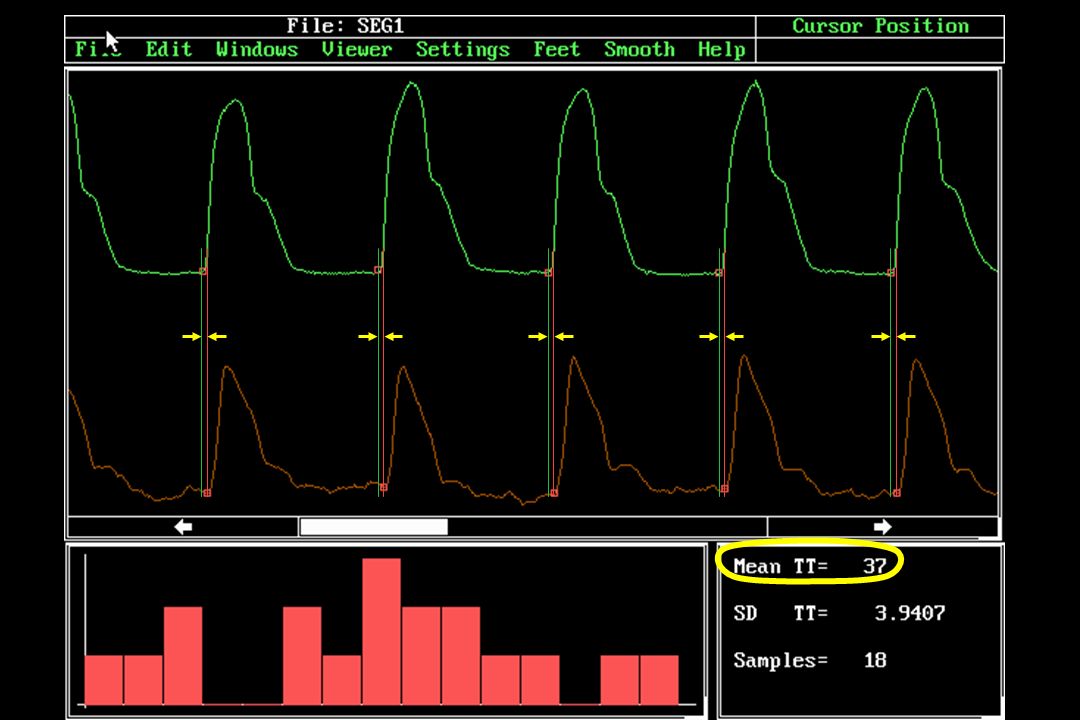
PhotoPlethysmoGraphy (PPG) for pulse wave velocity measurement. How does it work? Infra red probes detect transitory change in conduit artery volume due to the passage of the pulse wave Measure time delay and distance between the probes Pulse wave velocity = d/t Pulse wave velocity (compliance) -1/2 t d
 -1/2 t d.")
41
LED (emitter) Photo-transistor (detector) 20 mm
 Photo-transistor (detector) 20 mm")
43
Validation experiments. Comparison of PPG with Echo Tracking. –Does PPG method really measure large artery diameter? Doppler. –How well do PPG derived pulse wave transit times compare to measurements using an established method? Intra-arterial pressure wave. –Do transcutaneous transit time measurements compare with intra-arterial ones?

44
PPG/Echo tracking methods PPG Probes on the posterior tibial artery Probes on the radial artery PPG NIUS ultrasound probe NIUS ultrasound probe

45
PPG Ultrasound 0246810 Frequency (Hz) Phase 0 100 200 300 400 Ultrasound Relative amplitude 0.01 0.1 1 PPG
 Phase Ultrasound Relative amplitude PPG")
46
PPG/Echo Tracking - Conclusions. PPG reproduces the diameter wave with reasonable fidelity, when compared to high precision echo tracking system. Timing of the foot is close

47
Validation experiments. Comparison of PPG with Echo Tracking. –Does PPG method really measure diameter? Doppler. –How well do PPG derived pulse wave transit times compare to measurements using an established method?

48
PPG/Doppler methods PPG Doppler Probes on the posterior tibial artery Probes on the radial artery PPG Doppler ECG PPG ECG used as time reference Doppler

49
100 150 200 250 300 350 TT PPG [ms] 100150200250300350 TT Doppler [ms] y = 0.90x + 12.8 r = 0.95 Comparison of PPG and Doppler transit times Leg Arm
![TT PPG [ms] TT Doppler [ms] y = 0.90x r = 0.95 Comparison of PPG and Doppler transit times Leg Arm](http://images.slideplayer.com/22/6373319/slides/slide_49.jpg "TT PPG [ms] TT Doppler [ms] y = 0.90x r = 0.95 Comparison of PPG and Doppler transit times Leg Arm")
50
Comparison of PPG and Doppler. Difference v mean -50 -25 0.0 25 50 Doppler - PPG [ms] 0100200300400 Average [ms] + 2SD - 2SD Leg Arm Mean difference = 8.6 ms

51
PPG/Doppler - Conclusions. PPG transit times agree satisfactorily with Doppler values recorded at the ‘same’ site. The difference plot shows –the transit time estimated by the Doppler instrument is consistently greater than that derived from the PPG signals (mean difference 8.6 ms) The discrepancy is due to the Doppler signal processing
 The discrepancy is due to the Doppler signal processing.")
52
Validation experiments. Comparison of PPG with Echo Tracking. –Does PPG method really measure diameter? Doppler. –How well do PPG derived pulse wave transit times compare to measurements using an established method? Intra-arterial pressure wave. –How well do transcutaneous transit time measurements compare with intra-arterial ones?

53
Subjects Measurements on 21 volunteers (8 female, age range 33 to 78 years, mean 57) after elective coronary angiography, under the approval of the regional research ethics committee.
 after elective coronary angiography, under the approval of the regional research ethics committee.")
54
Inguinal ligament ECG T P1 Pressure measurement pos. 1 Femoral arteriotomy

55
Inguinal ligament Pressure measurement pos. 1 ECG T P1 Pressure measurement pos. 2 T P2 PPG measurement pos. T PPG T P = T P2 -T P1 T PPG = T PPG -T P1 TCTC +T C Femoral arteriotomy

56
40 50 60 70 80 90 100 110 PPG transit time [ms] 405060708090100110 Intra arterial transit time [ms] y = 0.68x + 22, r = 0.66, P < 0.005 Comparison of PPG and intra-arterial transit times
![PPG transit time [ms] Intra arterial transit time [ms] y = 0.68x + 22, r = 0.66, P < Comparison of PPG and intra-arterial transit times](http://images.slideplayer.com/22/6373319/slides/slide_56.jpg "PPG transit time [ms] Intra arterial transit time [ms] y = 0.68x + 22, r = 0.66, P < Comparison of PPG and intra-arterial transit times")
57
-30 -20 -10 0.0 10 20 30 I.A. - PPG [ms] 405060708090100110 Mean transit time [ms] + 2SD - 2SD Comparison of PPG and intra-arterial transit times. Difference v mean Mean difference = 0.0 ms

58
Some limitations. Non simultaneous measurement of proximal and distal signals –Ethical constraint of one catheter Proximal signal not transcutaneous –‘Hybrid’ measurements will avoid this. i.e. aortic signal from Doppler, distal signal from PPG. –Current hardware and software will allow this. Effect of errors in distance between measurement sites not investigated –Careful comparison between I.A. and external distance measurements required.

59
PPG/Intra-arterial - Conclusions. Reasonable correlation between intra-arterial and PPG transit times and pulse wave velocities. Mean difference between the two methods close to zero Transcutaneous estimation of pulse wave transit time provides an acceptable estimate of its intra-arterial value. –Errors in distance measurement must be carefully considered

60
Summary of validation results. Comparison of PPG with Echo Tracking. –Does PPG faithfully measure large artery diameter changes and pulse wave timing? Yes! Intra-arterial pressure wave. –Do transcutaneous transit time measurements compare with intra-arterial ones? Reasonably Doppler. –How well do PPG derived pulse wave transit times compare to measurements using an established method? Reasonably

61
Examples of current usage Paediatric PWV studies –Kawasaki disease –Twin to twin transfusion syndrome –Children of diabetic mothers –Zambian schoolchildren of known birthweight and nutritional status

62
Conclusions PPG measurements of PWV in superficial arteries compare well with other methods Although we don’t yet know quite what we’re measuring –Capillary and/or large artery volume changes? –More work needed

63
Assessment of endothelial function Endothelial function –The ability of the vascular endothelium to release vasodilators in response to reduced mean shear stress Nitric oxide PGI 2 EDHF Endothelial function is a reliable indicator of vascular “health” –Continuous production of nitric oxide maintains a low basal level of vascular tone and peripheral resistance –If NO production is impaired: Coronary arteries angina Peripheral arteries mean BP increases Peripheral endo function closely mirrors that in coronary artery

64
Assessment of endothelial function Impaired endothelial function has prognostic and diagnostic value a strong predictor of cardiovascular morbidity and mortality associated with a wide range of CV pathology –Angina –Type II diabetes –Smoking –Essential hypertension

65
How to assess endothelial function Direct –Measure diameter of muscular artery in response to change in shear stress (flow) Normally induced by reactive hypersaemia after a period of downstream occlusion B mode or echo tracking ultrasound (+ doppler) –Expensive –Highly skilled operators needed –Not in routine clinical use Indirect –Venous occlusion plethysmography –Peripheral artery tonometry –Distal temperature changes –Change in arterial compliance
 Normally induced by reactive hypersaemia after a period of downstream occlusion B mode or echo tracking ultrasound (+ doppler) –Expensive –Highly skilled operators needed –Not in routine clinical use Indirect –Venous occlusion plethysmography –Peripheral artery tonometry –Distal temperature changes –Change in arterial compliance")
66
Principle Relaxation of vascular smooth muscle reduction in arterial stiffness Reduced stiffness reduced pulsewave velocity

67
Protocol Experiment A Effect of exercise on brachio-radial PWV Base line PWV measurement 5 minutes biceps curl PWV measurements at 1, 2, 5 and 10 minutes 47 healthy volunteers Experiment B Effect of ischaemia on brachio-radial PWV Base line PWV measurement 3 minutes forearm artery occlusion (BP cuff) PWV measurements at 0.5, 1, 2 and 5 minutes 36 healthy volunteers
 PWV measurements at 0.5, 1, 2 and 5 minutes 36 healthy volunteers")
68
Results Exercise test -0.3 -0.2 -0.1 0 0.1 0.2 0.3 01234567891011 Time after exercise [minutes] Mean pulse wave velocity change relative to baseline
![Results Exercise test Time after exercise [minutes] Mean pulse wave velocity change relative to baseline](http://images.slideplayer.com/22/6373319/slides/slide_68.jpg "Results Exercise test Time after exercise [minutes] Mean pulse wave velocity change relative to baseline")
69
Results Forearm ischaemia -0.4 -0.3 -0.2 -0.1 0 0.1 0.2 0.3 0.4 123456 Time after cuff deflation [minutes] Mean pulse wave velocity change relative to baseline
![Results Forearm ischaemia Time after cuff deflation [minutes] Mean pulse wave velocity change relative to baseline](http://images.slideplayer.com/22/6373319/slides/slide_69.jpg "Results Forearm ischaemia Time after cuff deflation [minutes] Mean pulse wave velocity change relative to baseline")
70
Conclusions PPG is a reliable, repeatable low cost and robust alternative to the range of methods available for measuring PWV It is ideal for paediatric studies Changes in PWV may be a simple, low cost method for assesing endothelial function. –Very preliminary study

71
Flow-mediated changes in pulse wave velocity: a new clinical measure of endothelial function. Naka KK. Tweddel AC. Doshi SN. Goodfellow J. Henderson AH. European Heart Journal. 27:302-9, 2006 Feb.

72
Arm Leg Hyperaemia increased brachial artery diameter by 8% at this time. GTN had similar effect Hyperaemia had negligible effect on brachial artery diameter. GTN reduced diameter by similar amount to controls

Similar presentations


>")


