Download presentation
Presentation is loading. Please wait.

1
Movements of radioactive materials that was released by the Fukushima Nuclear Accident M. Yamauchi Total release: 10 17 Bq for 131 I & 10 16 Bq for 137 Cs ~ 15% of Chernobyl Accident (Estimate by Nuclear and Industrial Safety Agency, Japan)
.")
2
Three types of fallouts

3
Motivation “Spread” and “dynamics” of the nuclear product is geophysics problem. We are experts of estimating particle motion from multipoint measurements. This is a new research field (first time dense-network observation). Urgently needed because of internal dose problem. Strong demand from general public “Why do scientists not help?”
. Urgently needed because of internal dose problem. Strong demand from general public Why do scientists not help .")
4
Takeda, Yamauchi, Makino, and Owada (2011): Initial effect of the Fukushima accident on atmospheric electricity, Geophys. Res. Lett., 38, L15811, doi:10.1029/2011GL048511. Yamauchi, M., Takeda, M., Makino, M., Owada, T., and Miyagi, I. (2012): Settlement process of radioactive dust to the ground inferred from the atmospheric electric field measurement, Ann. Geophys., 30, 49-56, doi:10.5194/angeo-30-49-2012. Yamauchi, M. (2012): Secondary wind transport of radioactive materials after the Fukushima accident, Earth Planets Space, 64(1), e1-e4, doi:10.5047/eps.2012.01.002.
: Settlement process of radioactive dust to the ground inferred from the atmospheric electric field measurement, Ann. Geophys., 30, 49-56, doi: /angeo Yamauchi, M. (2012): Secondary wind transport of radioactive materials after the Fukushima accident, Earth Planets Space, 64(1), e1-e4, doi: /eps")
5
Measurement methods

6
q: production (by cosmic ray, radon, and -ray) α : neutralization β : attaching to aerosol (density N) Ion density n: dn/dt = q - αn 2 - βnN aerosol + positive ion + + + + + + + + negative ion molecule
 α : neutralization β : attaching to aerosol (density N) Ion density n: dn/dt = q - αn 2 - βnN aerosol + positive ion negative ion molecule")
7
aerosol With atmospheric electric (E) field + + + + + + + + + negative ion positive ion E
 field negative ion positive ion E")
8
Vertical Electric field ( = potential gradient: PG ) = about 100 V/m under clear sky Rain cloud: Ordinary cloud = dipole electric field (local generator) Thunderstorm = strong dipole electric field (global generator) Clear sky: Dry air = electrostatic problems Global current: 1kA Ionospheric potential:200kV
 = about 100 V/m under clear sky Rain cloud: Ordinary cloud = dipole electric field (local generator) Thunderstorm = strong dipole electric field (global generator) Clear sky: Dry air = electrostatic problems Global current: 1kA Ionospheric potential:200kV")
9
Atmospheric electric field near ground Conductivity near the ground is very very low (~ 10 -14 /Ωm)
")
10
Effect of the propagation

11
cf. After Nuclear Test PG (=vertical E-field) conductivity (by + ions) Shower conductivity (by - ions) Harris, 1955 (JGR) 12 16 20 24 4 8
 conductivity (by + ions) Shower conductivity (by - ions) Harris, 1955 (JGR)")
12
cf. Conductivity after Chernobyl Tuomi, 1988 (Geophysica)
")
13
Nuclear Tests = Wet (hard) Chernobyl = Wet (hard)/long distance + Dry/short distance Fukushima = Wet (soft) + Dry / both > 100 km
 Chernobyl = Wet (hard)/long distance + Dry/short distance Fukushima = Wet (soft) + Dry / both > 100 km")
14
Ionosphere Earth EE E’ radioactive dust cloud N ion ViVi σ=2eN ion μ ion Ionosphere Earth EE E’ N ion ViVi σ=2eN ion μ ion radioactive contamination

15
effect of global fallout of radioactive dust (nuclear test) Pierce, 1972 (JGR)
 Pierce, 1972 (JGR)")
16
extra dry contamination downstream of Windscale = downstream Pierce, 1959 (Pure and Applied Geophysics)Pierce, 1972 (JGR)
Pierce, 1972 (JGR)")
17
different contaminations dry (by wind) contamination wet (by rain) contamination subsurface migration transportsurface windhigh-altitude falloutsoft touch on the ground/leaf hard press to the ground/leaf chemical bind to soil resuspen sion easy to float and blown off difficult to floatno float
 contamination wet (by rain) contamination subsurface migration transportsurface windhigh-altitude falloutsoft touch on the ground/leaf hard press to the ground/leaf chemical bind to soil resuspen sion easy to float and blown off difficult to floatno float")
18
2011-03-11 (~06 UT): Earthquake 2011-03-12 (~01 UT): Venting (reactor #1) 2011-03-12 (~07 UT): Explosion (reactor #1) 2011-03-13 (~00 UT): Venting (reactor #3) 2011-03-13 (~02 UT): Venting (reactor #2) 2011-03-13 (~20 UT): Venting (reactor #3) 2011-03-14 (~02 UT): Explosion (reactor #3) 2011-03-14 (~15 UT): Venting (reactor #2) 2011-03-14 (~21 UT): Explosion (reactor #2) Time line (1): Nuclear Plant Vent reactor cooler high-P building The explosions are by H 2 which is leaked from vent line
: Earthquake (~01 UT): Venting (reactor #1) (~07 UT): Explosion (reactor #1) (~00 UT): Venting (reactor #3) (~02 UT): Venting (reactor #2) (~20 UT): Venting (reactor #3) (~02 UT): Explosion (reactor #3) (~15 UT): Venting (reactor #2) (~21 UT): Explosion (reactor #2) Time line (1): Nuclear Plant Vent reactor cooler high-P building The explosions are by H 2 which is leaked from vent line")
19
Time line (2): Release of Radionuclide Massive release even after large evens at the nuclear site until 21 March when first heavy rain fall at the nuclear site.
: Release of Radionuclide Massive release even after large evens at the nuclear site until 21 March when first heavy rain fall at the nuclear site.")
20
Time line (3): Vertical E-field (PG) Six periods of different contamination conditions 1. dry contamination, 2. blow away 3. floating, 4. wet contamination 5. minor re-suspension6. recovery

21
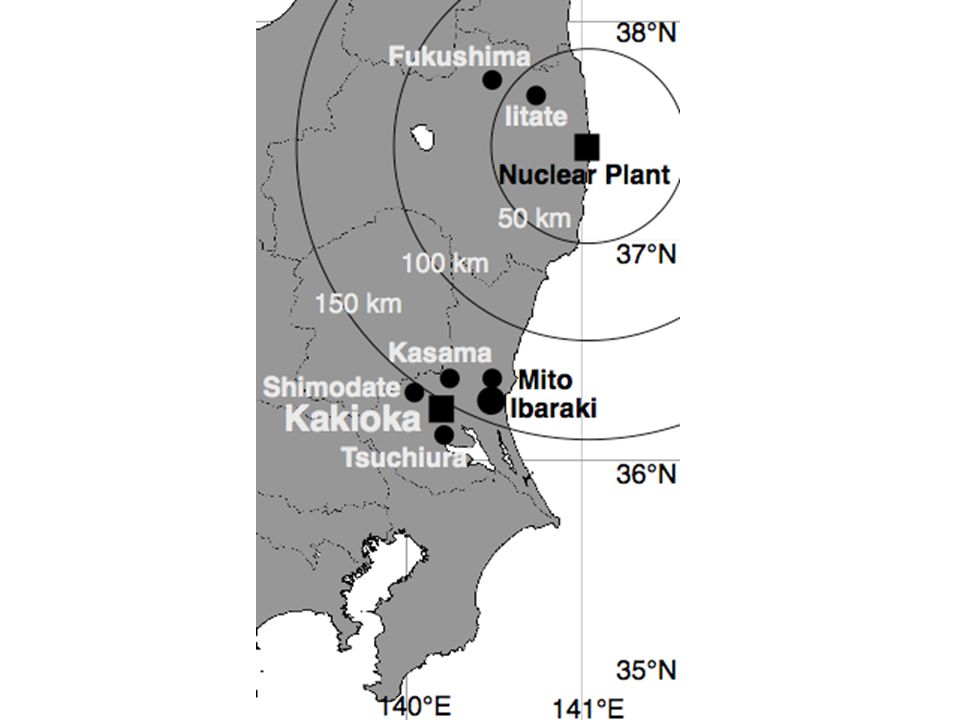
MainSub ElectrometerElectrostatic sensor type Field mill type Collector TypeWater-dropperMechanical Height2.55 m1.00m Separation from the wall 1.17 m Sampling1 sec LatitudeLongitude 36 13'56"N140 11'11"E PG measurement at Kakioka

22
Map

23
2011-3-13 (00 UT)2011-3-14 (00 UT) 2011-3-15 (00 UT)2011-3-16 (00 UT)
 (00 UT) (00 UT) (00 UT)")
24
Behavior: 3 days

25
dry contaminations dry contamination by wind wet contamination by rain subsurface migration falloutsoft touch on the ground/leaf hard press to the ground/leaf chemical bind to soil re- suspension easy to float and blown off difficult to floatno float

27
dry contamination phase

28
2011-3-17 (00 UT)2011-3-18 (00 UT)2011-3-19 (00 UT) 2011-3-20 (00 UT)2011-3-21 (00 UT)2011-3-22 (00 UT)
 (00 UT) (00 UT) (00 UT) (00 UT) (00 UT)")
29
wet contamination phase

30
wet contaminations dry contamination by wind wet contamination by rain subsurface migration falloutsoft touch on the ground/leaf hard press to the ground/leaf chemical bind to soil re- suspension easy to float and blown off difficult to floatno float

31
Israël, 1973 daily variation (LT=UT-9h) cf. 2000-2009 statistics (quiet days)
 cf statistics (quiet days)")
32
sub-surface migration dry contamination by wind wet contamination by rain subsurface migration falloutsoft touch on the ground/leaf hard press to the ground/leaf chemical bind to soil re- suspension easy to float and blown off difficult to floatno float

33
recovery phase The night-time background is returning, but this recovery resets around 8 April, 18 April, 10 May. => Rain-forced fallout from trees?

34
due to new fallout from trees?

35
Is it really no re-suspension? Alternating wind direction Similar to diffusion process Secondary transport from high-dose sites to low-dose sites ratio approaches unity

36
systematic check

38
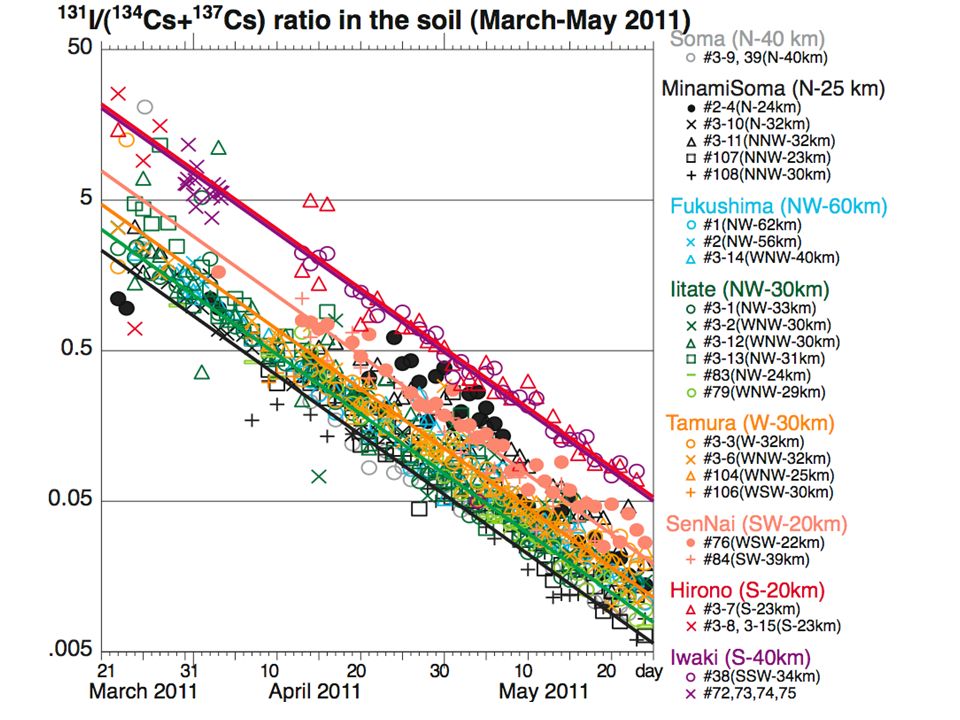
Obvious candidate for different decay Different I/Cs ratios (different physical decay) in different regions. because half-life is 8 days for I & 2~30 years for Cs

40
C1=60 & C2=20 20 & 8 8 & 3 8 & 2 3 & 2 days ratio of dose dose rate C*exp(-t/T I ) + (-t/T Cs ): T I =8 days, T Cs >2 years, C=I/Cs ratio at t=0 ratio of dose [C 1 + exp(+t/T)]/[C 2 + exp(+t/T)] : T≈8 days
![C1=60 & C2=20 20 & 8 8 & 3 8 & 2 3 & 2 days ratio of dose dose rate C*exp(-t/T I ) + (-t/T Cs ): T I =8 days, T Cs >2 years, C=I/Cs ratio at t=0 ratio of dose [C 1 + exp(+t/T)]/[C 2 + exp(+t/T)] : T≈8 days](http://images.slideplayer.com/22/6372089/slides/slide_40.jpg "C1=60 & C2=20 20 & 8 8 & 3 8 & 2 3 & 2 days ratio of dose dose rate C*exp(-t/T I ) + (-t/T Cs ): T I =8 days, T Cs >2 years, C=I/Cs ratio at t=0 ratio of dose [C 1 + exp(+t/T)]/[C 2 + exp(+t/T)] : T≈8 days")
41
approach unity, but with exceptions (1)Takahagi = I/Cs ratio (2) Iitate = slow decay
Takahagi = I/Cs ratio (2) Iitate = slow decay")
42
Interpretation for Takahagi

43
Why is Iitate special? Wind transport (extra inflow)? If so, what is the transport distance? Extra weathering loss afterward?

44
Can wind cause daily variation?

45
Summary Networks of Radiation dose measurement & Atmospheric electric field (PG) measurement help understanding the motion of the radioactive dust. First time to detect the moment of dry contamination (this is impossible without PG measurement). Re-suspension and secondary transport are significant until end of April, i.e., 50 days after the accident. This give duration of risk for the internal dose through breathing. It is not too late to put portable electric field instrument (e.g., field mill) after any nuclear accident because it is useful for more than one month.
. Re-suspension and secondary transport are significant until end of April, i.e., 50 days after the accident. This give duration of risk for the internal dose through breathing. It is not too late to put portable electric field instrument (e.g., field mill) after any nuclear accident because it is useful for more than one month..")
Similar presentations