Download presentation
Presentation is loading. Please wait.

1
Improving Medical Management of Diabetes
Jay Shubrook DO FACOFP, FAAFP Associate Professor of Family Medicine Director, Diabetes Fellowship Ohio University College of Osteopathic Medicine

2
Diabetes in the US 24 million American with diabetes
90%-95% have type 2 >1 million more per year 57 million Americans have pre-DM $170 billion dollars Estimated 25% of adults > 60 y/o have DM 1 in 5 Medicare dollars CDC Fact Sheet

3
Diabetes in the US Children can have type 2
SEARCH trial 20% of children with DM have type 2 DM Some have estimated 7% of children and adolescents have pre-DM CDC predicts people born in 2000 1 in 3 will develop DM 40% risk in at risk populations 50% or 1 in 2 in Hispanic population

4
Natural History of DM-2 Post Meal Glucose Fasting Glucose
350 250 Fasting Glucose Glucose 150 50 Insulin Resistance 300 Relative Function 200 The relationship of increased postprandial and fasting glucose levels, insulin resistance, and insulin levels in subjects with type 2 diabetes are illustrated in this figure. Bergenstal RM, Kendall DM, Franz MJ, Rubenstein AH. Management of type 2 diabetes: a systematic approach to meeting standards of care. II: Oral agents, insulin and management of complications. In Endocrinology, 4th ed, De Groo LJ and Jameson JL, editors. WB Saunders Co, Phila. (Originally published in Type 2 Diabetes BASICS, ©200 International Diabetes Center, Minneapolis). Used with permission. 100 At risk for Diabetes Insulin Level Beta Cell Failure -10 -5 5 10 15 20 25 30 Years of Diabetes Bergenstal, ©2000 International Diabetes Center Used with permission.
. Used with permission At risk for. Diabetes. Insulin Level. Beta Cell Failure Years of Diabetes. Bergenstal, ©2000 International Diabetes Center Used with permission.")
5
Diabetes is progressive
At diagnosis 50% of functional beta cells lost UKPDS results No slowing of progression Lifestyle or metformin Typically we start low and go slow Like the old rheumatoid arthritis treatment algorithms

7
Random PG > 200 + symptoms
2010 Diagnosis of Diabetes and Categories of Increased Risk for Diabetes NORMAL IFG or IGT DIABETES FPG < 100 mg/dl IFG FPG > mg/dl FPG > 126 mg/dl 2-h PG < 140 mg/dl IGT 2-h PG > 140 - 199 mg/dl 2-h PG > 200 mg Random PG > symptoms A1C 5.7% to 6.4% ≥ 6.5% ADA, Diabetes Care 33: Suppl. 1, S11-S61, 2010

8
THE INTERNATIONAL EXPERT COMMITTEE. Diabetes Care 2009;32:1327
International Expert Committee Report on A1C in the Diagnosis of Diabetes 6.5% THE INTERNATIONAL EXPERT COMMITTEE. Diabetes Care 2009;32:1327

9
Conventional treatment
DCCT: Absolute Risk of Sustained Retinopathy Progression by HbA1c and Years of Follow-up 24 Mean HbA1c = 11% 10% 9% 20 Conventional treatment 16 Rate/100 Person-Years 12 8 8% 4 7% 9 8 7 6 5 4 3 2 1 Time During Study (y) DCCT Research Group. Diabetes 1995;44:
 DCCT Research Group. Diabetes 1995;44:")
10
Clinical Efficacy of Oral Hypoglycemic Agents
Clinical Efficacy of Oral Hypoglycemic Agents Class of hypoglycemic agents Reduction in HbA1c (%) Reduction in FPG (mg per dl) Sulfonylureas Meglitinides Biguanides Thiazolidinediones Alpha-glucosidase inhibitors DPP-4 inhibitor 0.8 to 2.0 0.5 to 2.0 1.5 to 2.0 0.5 to 1.5 0.7 to 1.0 0.5 to 0.9 60 to 70 65 to 75 50 to 70 25 to 50 35 to 40 20 to 30 Adapted from University Educators MD-PhD
 Reduction in FPG (mg per dl) Sulfonylureas. Meglitinides. Biguanides. Thiazolidinediones. Alpha-glucosidase inhibitors. DPP-4 inhibitor. 0.8 to to to to to to to to to to to to 30. Adapted from University Educators MD-PhD.")
11
Probability of events of non-fatal myocardial infarction with intensive glucose-lowering vs. standard treatment Ray et al, Lancet 2009; 373: 1765–72

13
UKPDS: 10 yr Follow up HbA1c difference disappeared
Outcome reduction with intensive control Any DM end point % p= 0.04 Myocardial infarction 15% p=0.01 Death overall 13% p=0.005 If on metformin MI % p=0.005 Death 27% p=0.002

14
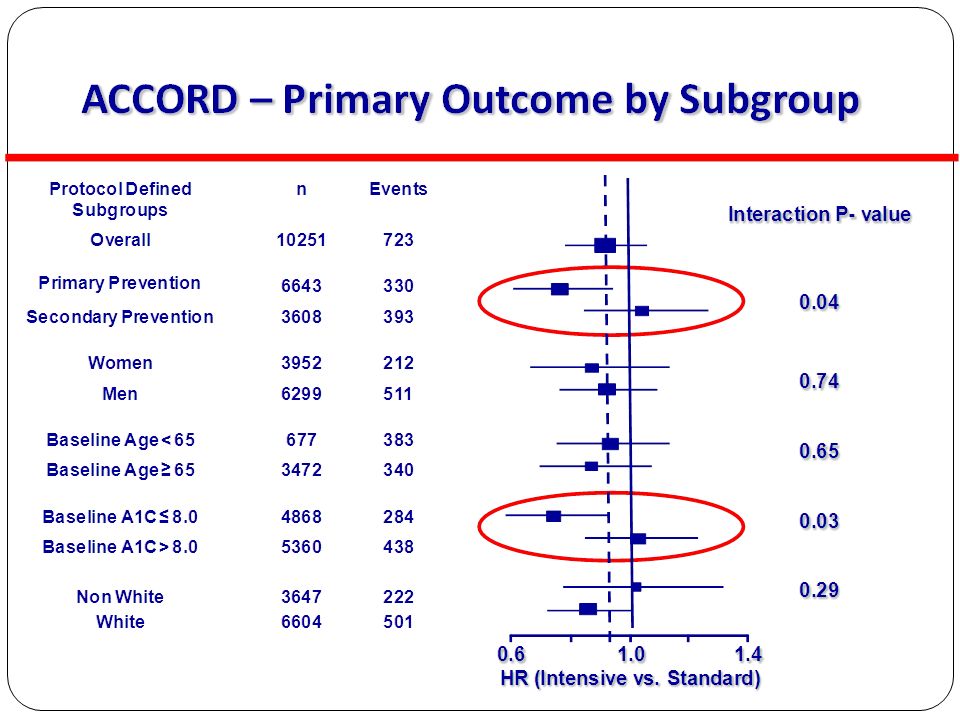
Intensive Glycemic Control in Diabetes: Implications of ACCORD, ADVANCE and VADT
A1C targets for diabetes Lowering A1C to < 7% has been shown to significantly reduce the risk of microvascular complications in both type 1 and type 2 diabetes Controlled trials of more intensive glycemic control have not shown a decrease in CVD mortality Long-term follow-up suggests that A1C < 7% in the years following diagnosis is associated with a reduction in CVD risk Until more evidence becomes available, the general A1C target of < 7% appears reasonable A position statement of the ADA and a scientific statement of the ACC and the AHA. Diabetes Care 32; 2009;

15
Early treatment=greater success
March 2010 Diabetes Care If metformin started with in 3 months of diagnosis Worked for twice as long 12% vs 21% failure rate per year Brown JB . Secondary Failure of Metformin Monotherapy in Clinical Practice. Diabetes Care March 2010

16
Tips to get control Lifestyle should be used in all patients but only as part of the treatment Start aggressively and back off Assume each medication will improve HgA1c 1% Never substitute meds Always add new agent first Titrate to get control Then stop first agent Ask the patient what they want Shots may be better than more pills Develop a plan that prevents hypoglycemia

17
ADA Consensus Statement for the Management of Type 2 Diabetes
STEP 1 At diagnosis: Lifestyle + MET If A1C ≥7% STEP 2 Tier 1: Well-validated core therapies* OR Tier 2: Less-well-validated therapies* Lifestyle + MET + SFU Lifestyle + MET + Basal Insulin Lifestyle + MET + GLP-1 Agonist Lifestyle + MET + PIO Lifestyle + MET + PIO + SFU Lifestyle + MET + Basal Insulin CHF, chronic heart failure MET, metformin PIO, pioglitazone SFU, sulfonylurea STEP 3 Lifestyle + MET + Intensive Insulin *Validation based on clinical trials and clinical judgment. Adapted from Nathan DM, et al. Diabetes Care. 2008;31(1):
:")
18
AACE Guidelines

19
What about special populations?

20
Glucose control for special populations
Children with type 1 A1c <8% and limit hypoglycemia Glucose variability may be important Children with type 2 No guidelines Same goals as adults Older adults Based upon life expectancy Time to benefit for glucose vs. BP and lipids

21
ADA – Summary of Recommendations for Adults with Diabetes
Goals Glycemic control: A1C* < 7% Preprandial BG 90 – 130 mg/dl Peak postprandial BG <180 mg/dl Blood Pressure: < 130/80 mm Hg Lipids: LDL < 100 mg/dl Triglycerides <150 mg/dl HDL > 40 mg/dl ADA. Diabetes Care, 2010.

22
Risk Reduction of Diabetes-Related End Points with Tight BP Control
Diabetes-related Mortality* Microvascular End Points‡ Myocardial Infarction Stroke† 10 20 30 40 50 21 Risk Reduction (%) 32 37 44 * Death due to MI, sudden death, stroke, peripheral vascular disease, renal disease, hyperglycemia, or hypoglycemia. † Fatal or nonfatal. ‡ Retinopathy requiring photocoagulation, vitreous hemorrhage and fatal or nonfatal renal failure. Mean BP : 144/82 mm Hg (tight BP control) vs /87 mm Hg (less tight BP control). UK Prospective Diabetes Study Group. BMJ. 1998;317:
 * Death due to MI, sudden death, stroke, peripheral vascular disease, renal disease, hyperglycemia, or hypoglycemia. † Fatal or nonfatal. ‡ Retinopathy requiring photocoagulation, vitreous hemorrhage and fatal or nonfatal renal failure. Mean BP : 144/82 mm Hg (tight BP control) vs 154/87 mm Hg (less tight BP control). UK Prospective Diabetes Study Group. BMJ. 1998;317:")
23
Lipid lowering: Heart Protection Study
LDL lowering resulted in 22% reduction in CVD events across all categories of LDL

24
Antiplatelet Agents in Diabetes, 2010
Primary Prevention (75–162 mg/day): Type 1 or type 2 diabetes at increased CV risk (10 yr risk > 10%), men > 50 yr or women >60 yr who have at least one additional major risk factor (family history of CVD, hypertension, smoking, dyslipidemia, or albuminuria) There is not sufficient evidence to recommend aspirin for primary prevention in lower risk individuals Secondary prevention (75–162 mg/day): Use aspirin therapy as a secondary prevention strategy in those with diabetes with a history of CVD ADA Clinical Practice Recommendations, Diabetes Care, January 2010
: Type 1 or type 2 diabetes at increased CV risk (10 yr risk > 10%), men > 50 yr or women >60 yr who have at least one additional major risk factor (family history of CVD, hypertension, smoking, dyslipidemia, or albuminuria) There is not sufficient evidence to recommend aspirin for primary prevention in lower risk individuals. Secondary prevention (75–162 mg/day): Use aspirin therapy as a secondary prevention strategy in those with diabetes with a history of CVD. ADA Clinical Practice Recommendations, Diabetes Care, January")
25
Multifactorial intervention and CVD in type 2 diabetes: STENO 2
11 10 Conventional therapy 9 8 7 Glycated hemoglobin (%) Intensive therapy 6 5 4 1 2 3 4 5 6 8 7 9 10 11 12 13 Follow-up time (years) Gaede P, et al. N Engl J Med 2008;358:580–91.
 Intensive therapy Follow-up time (years) Gaede P, et al. N Engl J Med 2008;358:580–91.")
26
STENO 2 - Risk of Death from Any Cause
80 70 60 50 Conventional therapy 40 Cumulative Incidence of death (%) p = 0.02 30 20 Intensive therapy Figure 3. Kaplan-Meier Estimates of the Risk of Death from Any Cause and from Cardiovascular Causes and the Number of Cardiovascular Events, According to Treatment Group. Panel A shows the cumulative incidence of the risk of death from any cause (the study's primary end point) during the 13.3-year study period. Panel B shows the cumulative incidence of a secondary composite end point of cardiovascular events, including death from cardiovascular causes, nonfatal stroke, nonfatal myocardial infarction, coronary-artery bypass grafting (CABG), percutaneous coronary intervention (PCI), revascularization for peripheral atherosclerotic artery disease, and amputation; Panel C shows the number of events for each component of the composite end point. In Panels A and B, the I bars represent standard errors. 10 Follow-up time (years) 1 2 3 4 5 6 8 7 9 10 11 12 13 No. at risk Intensive Conventional Gaede P, et al. N Engl J Med 2008;358:580–91.
 p = Intensive therapy. Figure 3. Kaplan-Meier Estimates of the Risk of Death from Any Cause and from Cardiovascular Causes and the Number of Cardiovascular Events, According to Treatment Group. Panel A shows the cumulative incidence of the risk of death from any cause (the study s primary end point) during the 13.3-year study period. Panel B shows the cumulative incidence of a secondary composite end point of cardiovascular events, including death from cardiovascular causes, nonfatal stroke, nonfatal myocardial infarction, coronary-artery bypass grafting (CABG), percutaneous coronary intervention (PCI), revascularization for peripheral atherosclerotic artery disease, and amputation; Panel C shows the number of events for each component of the composite end point. In Panels A and B, the I bars represent standard errors. 10. Follow-up time (years) No. at risk. Intensive Conventional Gaede P, et al. N Engl J Med 2008;358:580–91.")
27
ADA – Summary of Recommendations for Adults with Diabetes
Goals Glycemic control: A1C* < 7% Preprandial BG 90 – 130 mg/dl Peak postprandial BG <180 mg/dl Blood Pressure: < 130/80 mm Hg Lipids: LDL < 100 mg/dl Triglycerides <150 mg/dl HDL > 40 mg/dl ADA. Diabetes Care, 2010.

28
Managing Diabetes Most psychologically and behavior mod. challenging disease to manage 95% of care is self-care Office visits have 3 agendas: Patient Physician Insurer Cultural and social influences are strong

29
Results: T2DM Survey Adults
HGM 11 Records 9 Oral meds 8 Foot care 6 Oral care 8 Problem sol 13 Ob. supplies 11 Support groups 13 Sch. Med appts 9 88 minutes Common needs Meal planning 21 Shopping 23 Exercise 32 Preparing meals 54 Stress manage 16 146 minutes Total minutes 3 hours and 54 minutes!! Shubrook et al. In press

30
Keys to Managing Diabetes
Address the 3 agendas Build efficiencies into your care Measure your care (others already are) Celebrate small successes Focus on the positive Dispel myths- be an accurate source Work as a team and re-enforce messages
 Celebrate small successes. Focus on the positive. Dispel myths- be an accurate source. Work as a team and re-enforce messages.")
31
Glucose monitoring Glucose measurement should match the intensity of treatment Rare checks if no meds 3-7 checks per week on insulin sensitizers only If on insulin: FSG for each time injecting insulin AVOID sliding scale insulin lonea AVOID insulin that have variable absorption

32
Summary Diabetes is common and will get more common
Early aggressive treatment may be our best bet at preventing burden of disease Start low and go slow does not work Assume 1% reduction in A1c for each medication Guidelines exist to help direct treatment Remember the 3 agendas This is the patient’s disease process not yours It will be a lifetime so pace yourself as well

Similar presentations

>")


