Download presentation
Presentation is loading. Please wait.

2
Selecting Candidates for Fracture Prevention Based on Risk Prediction Lubna Pal, MBBS, MRCOG, MS Assistant Professor Department of Obstetrics, Gynecology and Reproductive Sciences Yale University School of Medicine New Haven, Connecticut

3
“A systemic skeletal disease characterized by low bone mass and microarchitectural deterioration of bone tissue, with a consequent increase in bone fragility and susceptibility to fracture.” Consensus Development Conference on Osteoporosis, 1993 Osteoporosis Normal Bone Osteoporosis Peck WA, et al. Am J Med. 1993;94:646. Graphics courtesy of the International Osteoporosis Foundation.

4
Demographics of Osteoporosis Worldwide 1 1 in 3 women and 1 in 5 men >50 years of age will develop osteoporosis- related fracture 1 in 3 women and 1 in 5 men >50 years of age will develop osteoporosis- related fracture 30%–50% of women and 15%–30% of men will experience an osteoporosis- related fracture in their lifetime 30%–50% of women and 15%–30% of men will experience an osteoporosis- related fracture in their lifetime 75 million people in the US, Europe, and Japan are affected by osteoporosis 75 million people in the US, Europe, and Japan are affected by osteoporosis 1. International Osteoporosis Foundation. Facts and statistics about osteoporosis and its impact. Available at: http://www.iofbonehealth.org/facts-and-statistics.html. 2. National Osteoporosis Foundation. Available at: http://www.iofbonehealth.org/facts-and-statistics.html#factsheet-category-23. United States 2 By 2010: 12 million >50 years of age will have osteoporosis 40 million will have low bone mass By 2020: 14 million >50 years of age will have osteoporosis 47 million will have low bone mass By 2040: Hip fractures will increase 2-3 fold

5
Implications of Osteoporosis Mortality Mortality Morbidity Morbidity –Quality of life –Dependence –Pain –Health issues (pulmonary, gastrointestinal) Healthcare burden Healthcare burden –>1.5 million Americans experience osteoporosis- related fractures/year –Annual cost of $14 Billion International Osteoporosis Foundation. Facts and statistics about osteoporosis and its impact. Available at: http://www.iofbonehealth.org/facts-and-statistics.html.

6
Burden of Diseases Estimated as Disability-Adjusted Life Years (DALYs) in 2002 in the Americas and Europe Combined DALYs = disability-adjusted life years. WHO. WHO Scientific Group on the Assessment of Osteoporosis at Primary Health Care Level: Summary Meeting Report. Brussels, Belgium, 2004. Available at: http://www.nof.org/professionals/WHO_Osteoporosis_Summary.pdf Parkinsonism Ovarian cancer Prostate cancer Hip fracture Stomach cancer Rheumatoid arthritis Breast cancer Hypertension Osteoporotic fracture Colon and rectal cancer Cirrhosis of liver Lung cancer Diabetes mellitus Chronic obstructive pulmonary disease 0 1000 2000 3000 4000 5000 6000 DALYs (thousand)
.")
7
60 70 80 90 100 304050607080 90 Age (years) Relative BMD (%) Forearm Hip and Heel Spine Colles' Vertebrae Hip Age (years) Annual Fracture Incidence 1. Reprinted from Faulkner KG. J Clin Densitom. 1998;1:279, with permission from the Copyright Clearance Center. 2. Reprinted from Cooper C, et al. Trends Endocrinol Metab. 1992;3:224, with permission from Cell Press. Bone Mineral Density (BMD) and Fracture Risk Changes in BMD for Women Experiencing Menopause at age 50 1 Age-specific Incidence Rates for Fractures in Women 2
 and Fracture Risk Changes in BMD for Women Experiencing Menopause at age 50 1 Age-specific Incidence Rates for Fractures in Women 2.")
8
Reprinted from Hui SL, et al. J Clin Invest. 1988;81:1804, with permission from The Copyright Clearance Center. Qualitative Skeletal Deterioration with Aging Fracture Risk per 1000 Person-Years Bone Mass (g/cm) Age (years) 80+ 75–79 70–74 65–69 60–64 55–59 50–54 45–49 <45
 Age (years) –79 70–74 65–69 60–64 55–59 50–54 45–49 <45.")
9
Addressing Osteoporosis in At-Risk Populations Identify Identify –Bone mineral density –Risk factors Intervene Intervene –Reduction in incident fractures

10
BMD Screening Strategy Limitations Limitations –Expense –Expertise –Logistic constraints for patients –Preferential skeletal site? BMD is 1 measure of skeletal structure and strength 1 BMD is 1 measure of skeletal structure and strength 1 –Fracture burden is highest in patients with BMD T-score of -2.5 a or less –Clinical history can identify fracture risk to degree comparable to BMD 1. Kanis JA, et al. Osteoporos Int. 2005;16:581. a Standard deviation below young average value. BMD = bone mineral density.

11
Evolving Concerns How good are we at identifying patients at risk for fracture? How good are we at identifying patients at risk for fracture? Low bone mineral density may not always translate into enhanced fracture risk Low bone mineral density may not always translate into enhanced fracture risk Emerging concerns regarding unanticipated adverse effects of therapies Emerging concerns regarding unanticipated adverse effects of therapies –Bisphosphonate use associated with osteonecrosis of jaw –Menopausal hormone therapy and risks for breast cancer and cardiovascular disease –Long-term implications of available therapies Osteosarcoma and parathyroid hormone Osteosarcoma and parathyroid hormone

12
a Characteristics capture aspects of fracture risk over and above that provided by bone mineral density. Risks for Fractures Age a Age a Female gender Female gender Premature menopause Premature menopause Amenorrhea a Amenorrhea a Hypogonadism in men Hypogonadism in men Caucasian or Asian race Caucasian or Asian race Previous fracture a Previous fracture a Low bone mineral density Low bone mineral density Glucocorticoid therapy a Glucocorticoid therapy a High bone turnover a High bone turnover a Family history of hip fracture a Family history of hip fracture a Poor visual acuity a Low body weight a Neuromuscular disorders a Cigarette smoking a Excessive alcohol consumption a Prolonged immobilization Low dietary calcium Vitamin D deficiency Kanis JA, et al. Osteoporos Int. 2005;16:581.

13
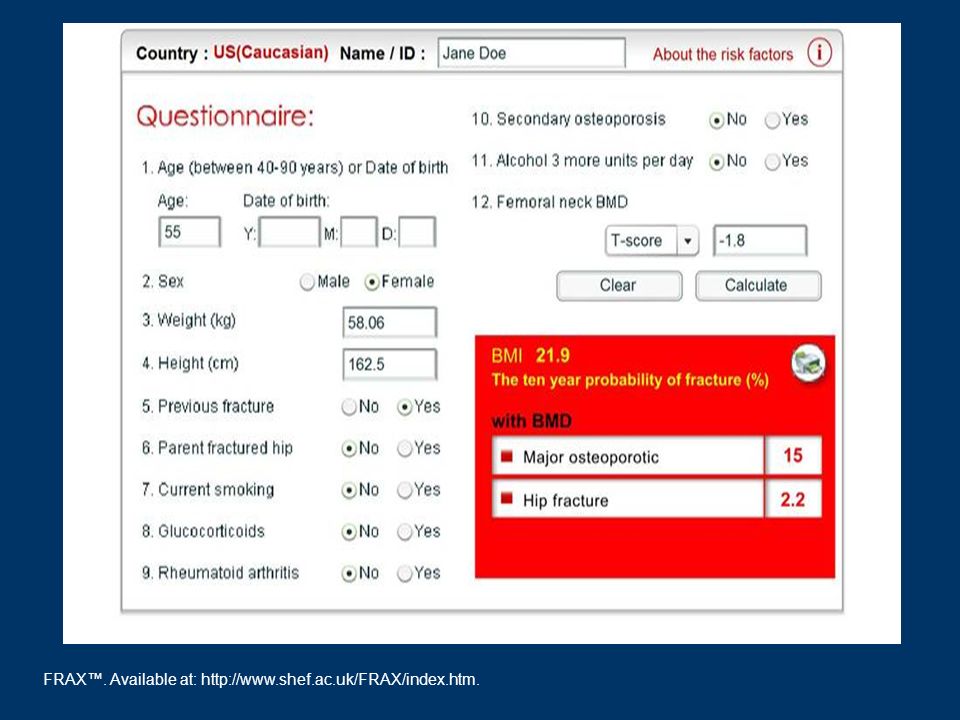
Fracture Risk Assessment FRAX™ Fracture Risk Assessment FRAX™ Developed by World Health Organization to evaluate fracture risk of patients Developed by World Health Organization to evaluate fracture risk of patients Enhances ability to predict fracture risk for an individual given the bone mineral density of femoral neck (if available) plus clinical risk factors Enhances ability to predict fracture risk for an individual given the bone mineral density of femoral neck (if available) plus clinical risk factors Provides individualized ABSOLUTE RISK over a 10-year period (similar to Gail model for risk of breast cancer or Framingham model for risk of cardiovascular disease) Provides individualized ABSOLUTE RISK over a 10-year period (similar to Gail model for risk of breast cancer or Framingham model for risk of cardiovascular disease) –Hip fracture –Major osteoporotic fracture Guidelines regarding WHEN to intervene are emerging Guidelines regarding WHEN to intervene are emerging FRAX™. Available at: http://www.shef.ac.uk/FRAX/index.htm.

14
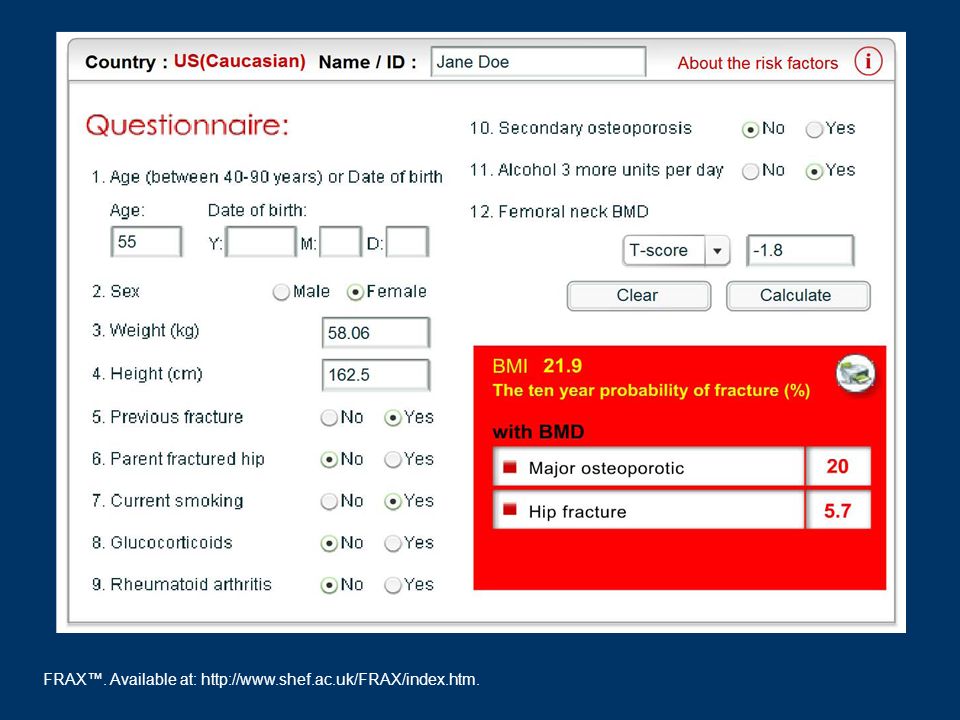
Age Sex Bone mineral density Prior history of fracture Parental history of fracture Current smoking Current alcohol >3 units/day Rheumatoid arthritis Glucocorticoid use Secondary osteoporosis — Hypogonadism — Premature menopause (<45 y) — Chronic malnutrition or malabsorption — Osteogenesis imperfecta — Chronic liver disease — Type I diabetes — Long-term hyperthyroidism Clinical Risk Factors in the FRAX™ Model Each CRF independently contributes to fracture probability Presence of ≥1 CRF increases probability of fracture incrementally CRF = clinical risk factors. FRAX™. Available at: http://www.shef.ac.uk/FRAX/index.htm.

15
FRAX™. Available at: http://www.shef.ac.uk/FRAX/index.htm.

18
Fracture Risk Reduction Optimize an appreciation of risk factors other than low bone mineral density Minimize over- zealous treatment of those at indeterminate risk

19
Conclusions Bone mineral density alone is inadequate for identifying individuals at risk for fracture Bone mineral density alone is inadequate for identifying individuals at risk for fracture Low BMD may not always translate into enhanced fracture risk Low BMD may not always translate into enhanced fracture risk Fracture risk may be predicted by a patient’s clinical history almost as reliably as by BMD assessment alone Fracture risk may be predicted by a patient’s clinical history almost as reliably as by BMD assessment alone Fracture risk assessment approach comprehensively addresses the morbidity of fracture rather than skeletal density Fracture risk assessment approach comprehensively addresses the morbidity of fracture rather than skeletal density –Guidelines regarding WHEN to intervene are emerging

20
Brief Q & A

Similar presentations


![2010 Guidelines Papaioannou A, et al. CMAJ 2010 Oct 12. [Epub ahead of print]. 2010 Clinical Practice Guidelines for the Diagnosis and Management of Osteoporosis.](/12/3477401/big_thumb.jpg "2010 Guidelines Papaioannou A, et al. CMAJ 2010 Oct 12. [Epub ahead of print]. 2010 Clinical Practice Guidelines for the Diagnosis and Management of Osteoporosis.>")


>")


>")


