Download presentation
Presentation is loading. Please wait.

1
The Student Research and Scholarship Center Grove School of Engineering, And Pathways Bioinformatics Center, CCNY Present Winter Bioinformatics Workshop 10am-6pm, January 20 – 21, 2009 Location: Marshak, Room MR-044 Contact info: gsoejsr@gmail.com, 212-650-8870gsoejsr@gmail.com Invited Speaker Cristina C. Clement, Ph.D. Albert Einstein College of Medicine, Pathology Department Topic: Bioinformatics tools for proteins identification from primary sequence databases using mass spectrometry data January 21, Marshak Building, Room MR-044 1:00pm-2:00pm: Presentation 2:30pm-4:00pm: Online practice

5
Accuracy & Resolution in Mass Spectroscopy When low molecular weight samples are being analysed using relatively low resolution mass spectrometers, it is common to work with "nominal" mass values, calculated from integer atomic weights. That is, H=1, C=12, N=14, O=16, etc. Nominal mass is rarely used in peptide and protein work because the cumulative error of approximating atomic weights with integers becomes unacceptable. The presence of isotopes at their natural abundances makes it essential to define whether an experimental mass value is an "average" value, equivalent to taking the centroid of the complete isotopic envelope, or a "monoisotopic" value, the mass of the first peak of the isotope distribution. For peptides and proteins, the difference between an average and a monoisotopic weight is approximately 0.06%. This is a significant difference when even the most modest instruments are capable of measuring the mass of a small peptide with an accuracy of a fraction of a Dalton. For example, peptide HLKTEAEMK has an average molecular weight of 1086.28 and a monoisotopic weight of 1085.55. At a mass resolution of 5000, the isotopic envelope has this appearance: m/z

6
Mass resolution is the dimensionless ratio of the mass of the peak divided by its width. Usually, the peak width is taken as the full width at half maximum intensity, (fwhm). However, this definition of peak width is only a convention, and you may also encounter data acquired on magnetic sector instruments where the resolution has been calculated using the peak width at 5% maximum intensity. To measure a monoisotopic molecular weight requires (i) sufficient mass resolution to resolve the the isotopic distribution (ii) sufficient signal to noise to be able to identify the first peak of the envelope with confidence. For a small peptide, the first peak (often referred to as the 12 C peak) is also the most intense peak. This is not the case for larger molecules. The following two examples show the isotopic envelopes for a small protein (insulin) and a larger protein (BSA): It would be extremely difficult to measure a monoisotopic mass for BSA, and it is far from routine to measure a monoisotopic mass for insulin. In practice, most instruments report monoisotopic molecular weights up to a certain cut-off point. Above this cut- off, isotopic envelopes are centroided as a whole to provide average mass values. Accuracy & Resolution in Mass Spectroscopy m/z
. However, this definition of peak width is only a convention, and you may also encounter data acquired on magnetic sector instruments where the resolution has been calculated using the peak width at 5% maximum intensity. To measure a monoisotopic molecular weight requires (i) sufficient mass resolution to resolve the the isotopic distribution (ii) sufficient signal to noise to be able to identify the first peak of the envelope with confidence. For a small peptide, the first peak (often referred to as the 12 C peak) is also the most intense peak. This is not the case for larger molecules. The following two examples show the isotopic envelopes for a small protein (insulin) and a larger protein (BSA): It would be extremely difficult to measure a monoisotopic mass for BSA, and it is far from routine to measure a monoisotopic mass for insulin. In practice, most instruments report monoisotopic molecular weights up to a certain cut-off point. Above this cut- off, isotopic envelopes are centroided as a whole to provide average mass values. Accuracy & Resolution in Mass Spectroscopy m/z.")
7
Accuracy & Resolution in Mass Spectroscopy The factor which complicates any general discussion of resolution optimisation is that some types of mass analyser have a trade-off between resolution and sensitivity, while others do not. Where a monoisotopic peak for a single molecular species can be resolved, mass accuracy tends to follow resolution. This is because the narrower the peak, the less the significance of errors due to variations in the peak shape. So, if unit mass resolution is possible, then the more resolution the better... unless there is a sensitivity trade-off. If unit mass resolution is not possible, then there is little benefit to exceeding the instrument resolution at which the isotopic envelope can be defined without significant broadening. For example, the following figure shows the molecular ion of glucagon at resolutions of 1000 (blue), 3000 (red), 10,000 (green) and 30,000 (black). For an average mass measurement, and where there is no trade-off between sensitivity and resolution, the accuracy at 3000 resolution (red) will be just as good as at higher resolution. On an instrument where a trade-off exists, using a resolution greater than 3000 is very likely to degrade mass accuracy. m/z
, 3000 (red), 10,000 (green) and 30,000 (black). For an average mass measurement, and where there is no trade-off between sensitivity and resolution, the accuracy at 3000 resolution (red) will be just as good as at higher resolution. On an instrument where a trade-off exists, using a resolution greater than 3000 is very likely to degrade mass accuracy. m/z.")
8
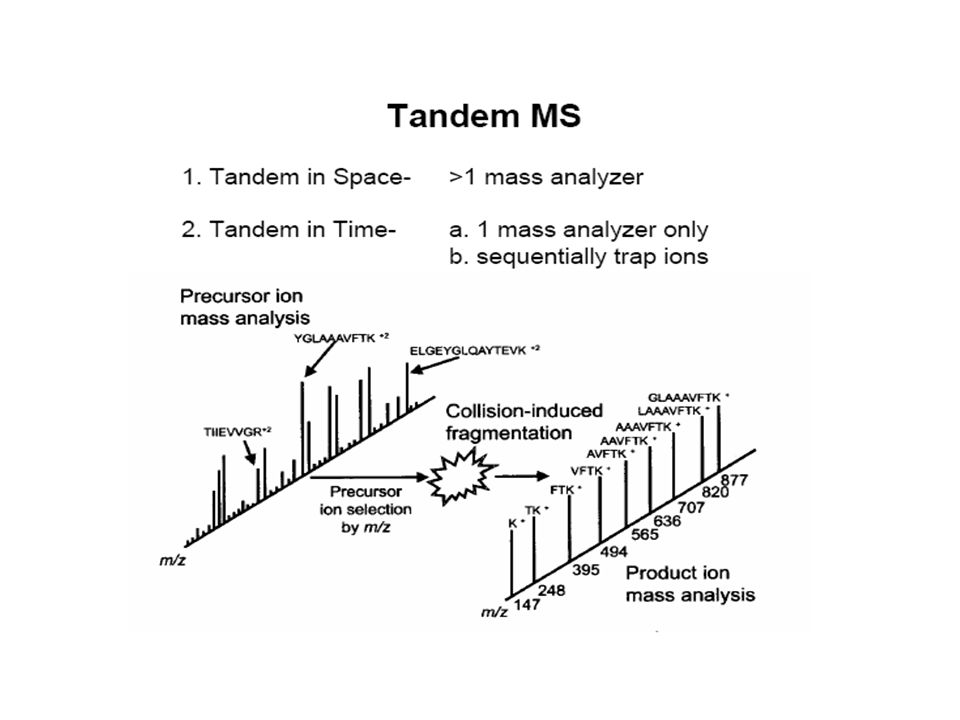
In this MS-MS approach (depicted above) a first mass spectrometer (MS-1) that employs a quadrupole mass filter is tuned to allow only the analyte ion of interest (e.g. red above) through. This is then taken into a collision cell where Argon is used to fragment the analyte, and the so-called daughter ions are then swept into a second time-of-flight MS (MS-2) where they are separated and detected.
 through. This is then taken into a collision cell where Argon is used to fragment the analyte, and the so-called daughter ions are then swept into a second time-of-flight MS (MS-2) where they are separated and detected..")
17
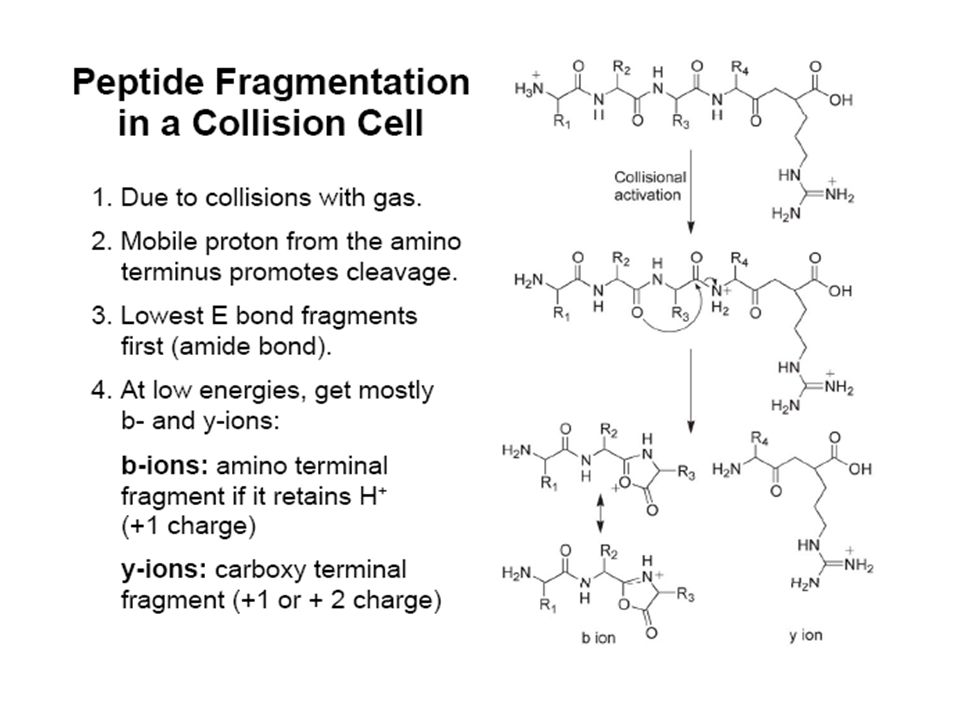
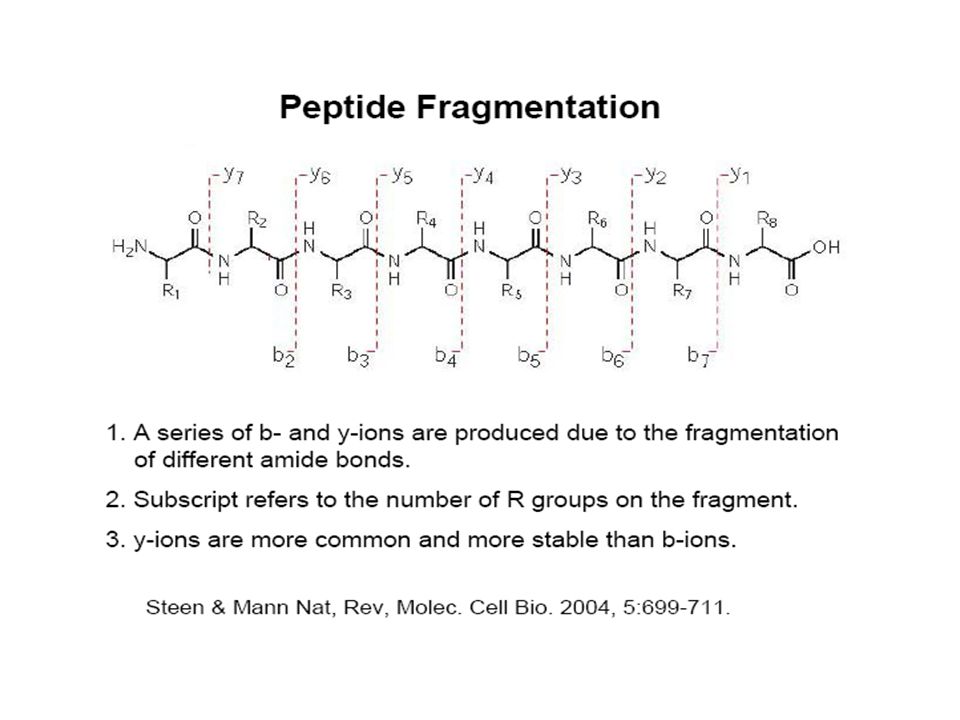
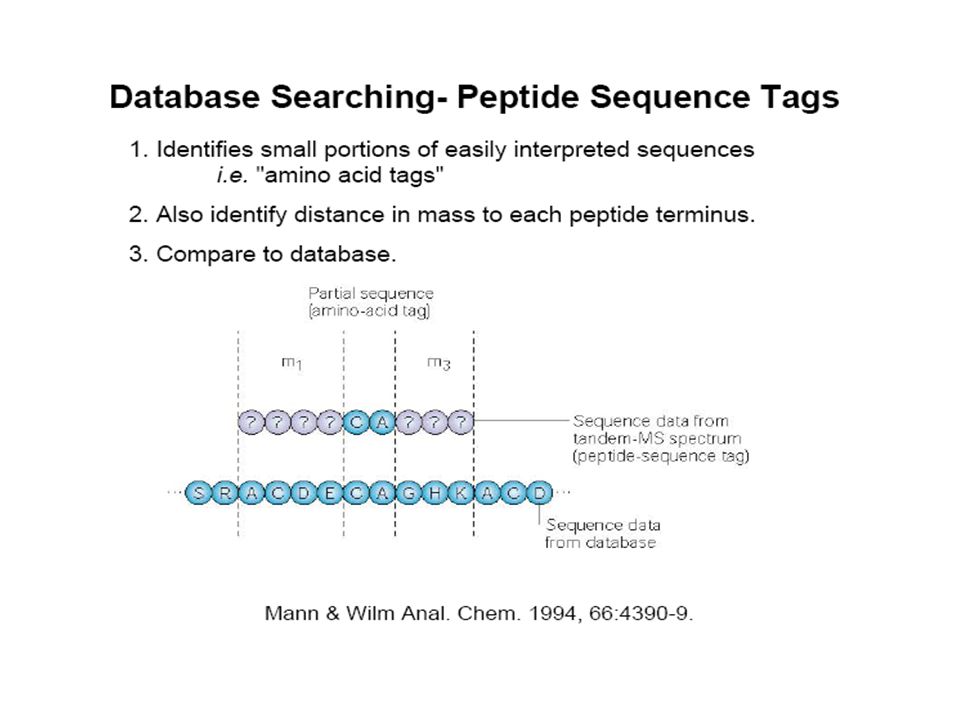
The most common peptide fragments observed in low energy collisions are a, b and y ions, as described in the figure above. The b ions appear to extend from the amino terminus, sometimes called the N-terminus, and y ions appear to extend from the carboxyl terminus, or C-terminus. While readily observed and diagnostic for b ions, a ions occur at a lower frequency and abundance in relation to b ions. The a ions are often used as a diagnostic for b ions, such that a-b pairs are often observed in fragment spectra. The a-b pairs are separated by 28u, the mass for the carbonyl, C=O. The fragment types listed above are the most common fragments observed with ion trap, triple quadrupole, and q-TOF mass spectrometers.

19
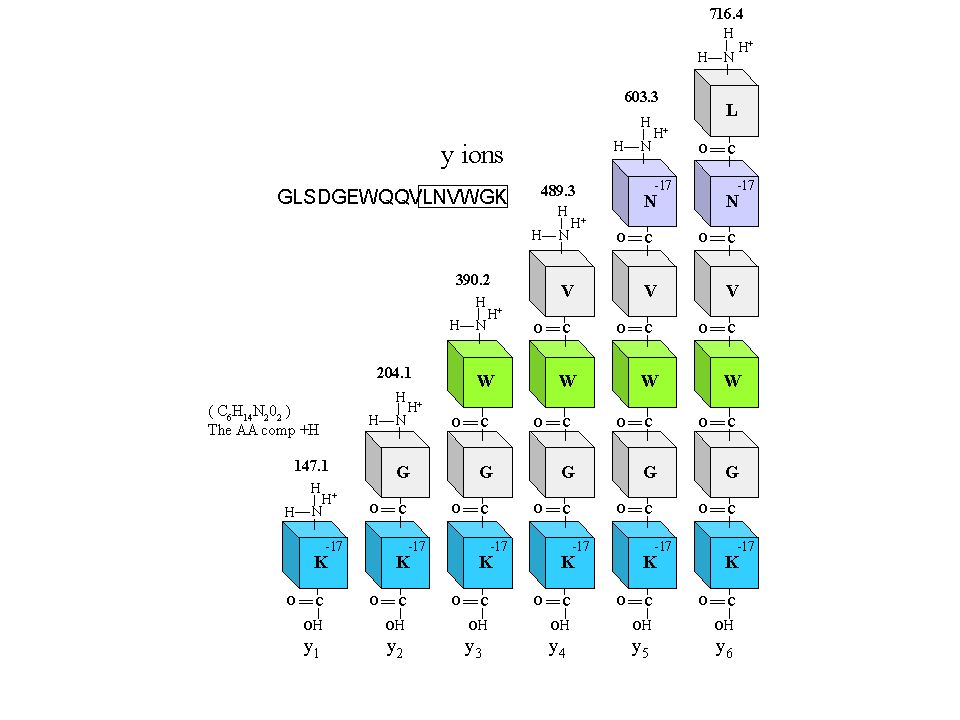
De novo sequencing of peptides This is an MS/MS spectrum of the tryptic peptide GLSDGEWQQVLNVWGK. This data was collected on an ion trap mass spectrometer. This spectrum will be the subject of our first unblinded de novo sequencing example. The sequence of the peptide is determined by the mass difference between these peaks.

20
The b fragment peaks are labeled from the amino to the carboxyl terminus. The fragment containing only the amino terminal amino acid is termed b1. The fragment containing the first two amino terminal amino acids is termed the b2 ion, and so forth. The nomenclature is very simple to follow. You can calculate the mass of any b ion, basically it is the mass of the shortened peptide (M)-17 (OH) = b ion m/z or more simply M-17 = b ion m/z.
-17 (OH) = b ion m/z or more simply M-17 = b ion m/z..")
21
Shows the first six b ions in a little bit more detail. The b ion m/z value is basically the mass of the peptide minus OH, or -17u.

24
Loss of Ammonia and Water y and b ion fragments containing the amino acid residues R, K, Q, and N may appear to lose ammonia, -17. - y and b ion fragments containing the amino acid residues S, T, and E may appear to lose water, -18. In the case of glutamic acid, E must be at the N-terminus of the fragment for this observation to be made. Spectral Intensity Rules b ion intensity will drop when the next residue is P, G or also H, K, and R. - Internal cleavages can occur at P and H residues. An internal cleavage fragment is a fragment that appears to be a shortened peptide with P and or H at its amino terminus, for example the peptide EFGLPGLQNK may display the b ions PGLQNK, PGLQN, PGLQ, etc. These are the result of a double cleavage event. The y ion intensity will often be the most prominent peak in the spectrum. - It is common for b and y ions or y and b ions to swap intensity when a P is encountered in a sequence. This can also be true when the basic residues H, K, or R are encountered in the sequence. - When a cleavage appears before or after R, the -17 (loss of ammonia) peak can be more prominent than the corresponding y or b ion. - When encountering aspartic acid in a sequence, the ion series can die out. Amino Acid Composition It is possible to observe immonium ions at the low end of the spectrum that can give a clue to the amino acid composition of a peptide. One caveat is that if you do not see an immonium ion for a particular amino acid, this does not mean that that amino acid is absent from the sequence. immonium ions
 peak can be more prominent than the corresponding y or b ion. - When encountering aspartic acid in a sequence, the ion series can die out. Amino Acid Composition It is possible to observe immonium ions at the low end of the spectrum that can give a clue to the amino acid composition of a peptide. One caveat is that if you do not see an immonium ion for a particular amino acid, this does not mean that that amino acid is absent from the sequence. immonium ions.")
25
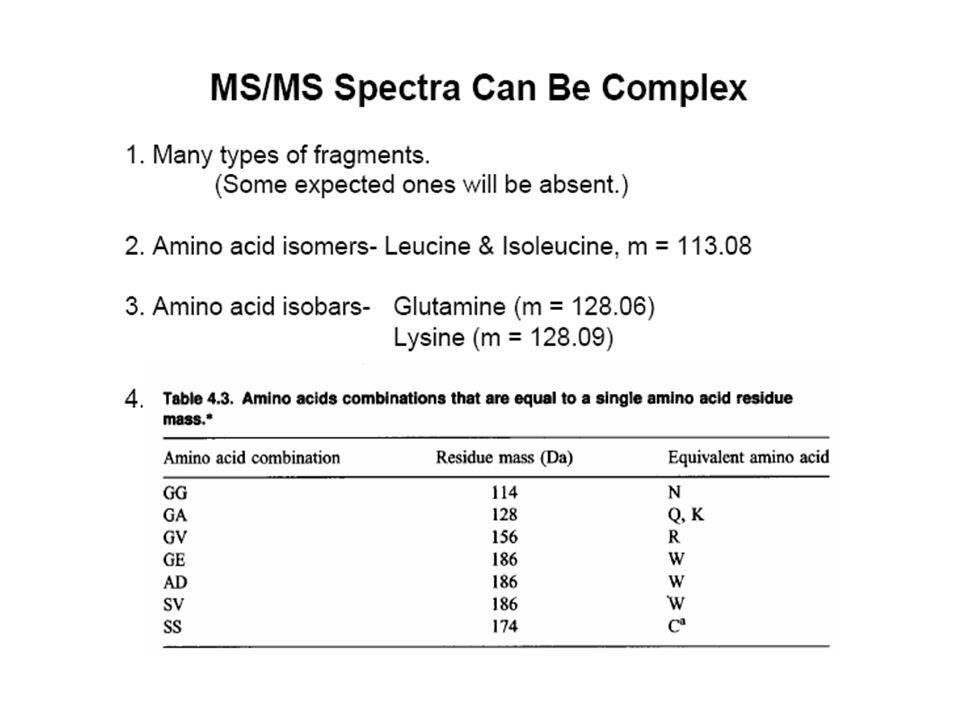
Isobaric Mass Leucine and Isolucine have isobaric masses and cannot be differentiated in a low energy collision. When we see this mass difference in a spectrum we will label it X or Lxx, adopting the Hunt nomenclature. - Lysine and Glutamine have near isobaric masses, 128.09496 and 128.05858 respectively. The delta mass is 0.03638 this difference can be used to differentiate K from Q on a mass spectroneter capable of higher mass accuracy and resolution, such as a q-TOF mass spectrometer. Usually triple quadrupole or ion trap mass spectrometers are incapable of this feat. On a lower mass accuracy mass spectrometers an acetylation can be performed to shift the mass of lysine by 42u. If you like to live dangerously, and we do not, one can assume that a 128 mass shift internally on a tryptic peptide is a glutamine unless followed by a proline or sometimes aspartic acid. Other instances of internal lysines left standing after a tryptic digest (this is our personal observation) is when double lysines occur in a sequence, so be careful. -acetylation There are instances where two residues will nearly equal the mass of a single residue, or a modified residue will nearly equal the mass of another amino acid.
 is when double lysines occur in a sequence, so be careful. -acetylation There are instances where two residues will nearly equal the mass of a single residue, or a modified residue will nearly equal the mass of another amino acid..")
26
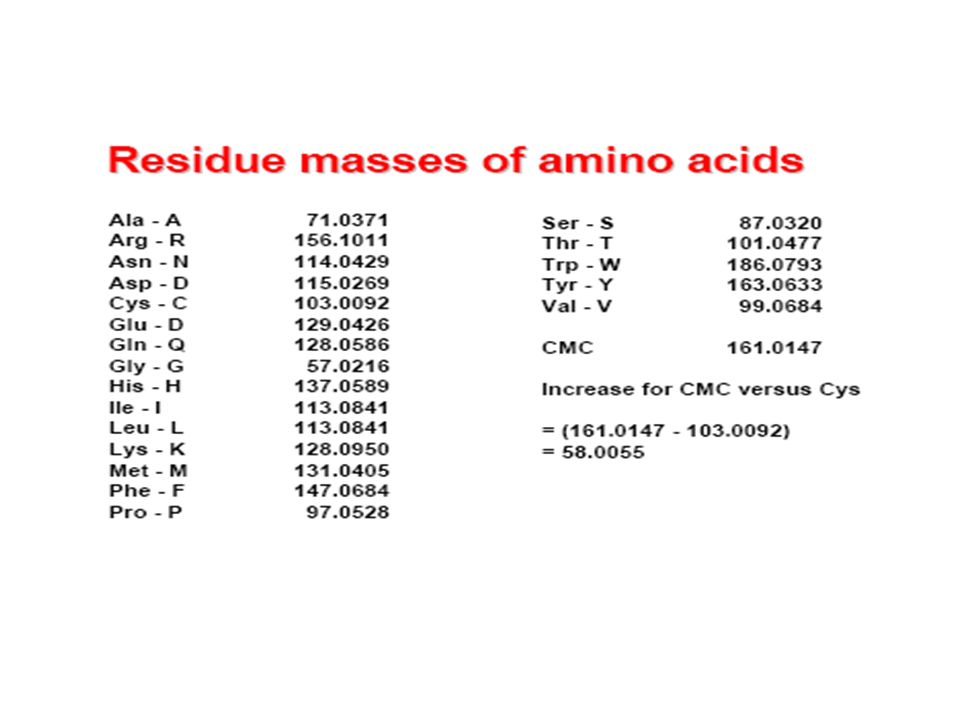
More Rules When starting a de novo sequencing project, start at the high mass end of the spectrum; the lower number of peaks at this end often makes it easier to start sequencing. - The region 60 u below the parent mass can be confounded by multiple water and ammonia losses, be careful. Realize that glycine may be your first amino acid and may fall in this region. - Do you want to know if your tryptic peptide ends in a K or an R? Look for the diagnostic y1 ions at the low end of the spectrum, you may observe 147 for K or 175 for R. - The b1 fragment is seldom observed making it difficult to determine the order of the first two N- terminal amino acids in a peptide sequence. Solutions for this problem can include a one step Edman degradation or an acetylation. -acetylation Once you know the mass of a b or y ion the corresponding y or b ion can be calculated using the following formulas. - y = (M+H)1+ - b +1 - b = (M+H)1+ - y +1
1+ - b +1 - b = (M+H)1+ - y +1.")
29
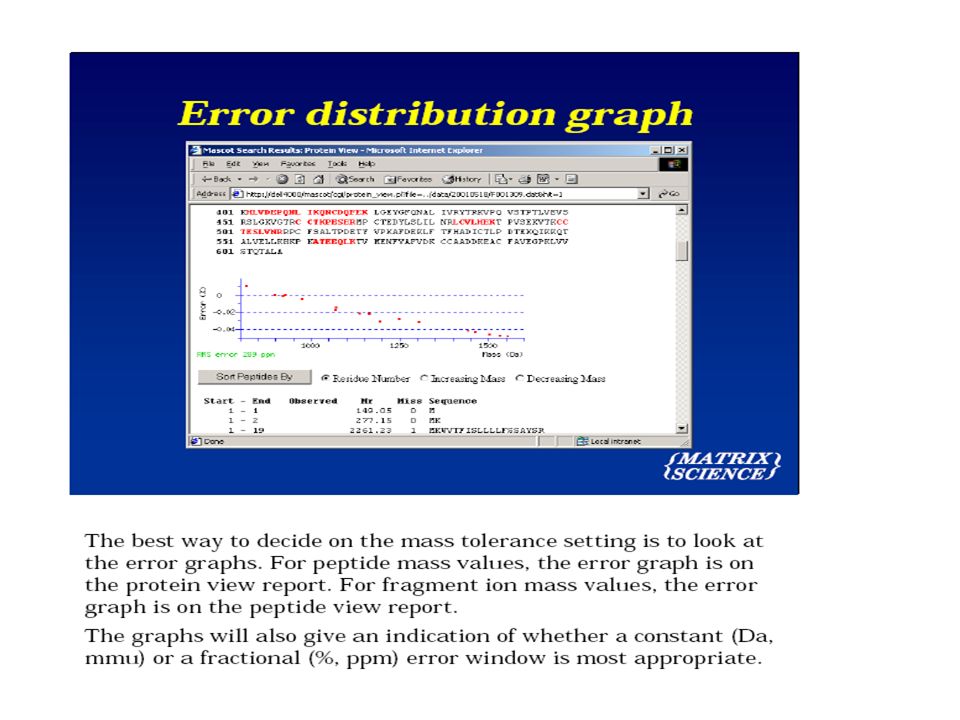
http://www.matrixscience.com/
30
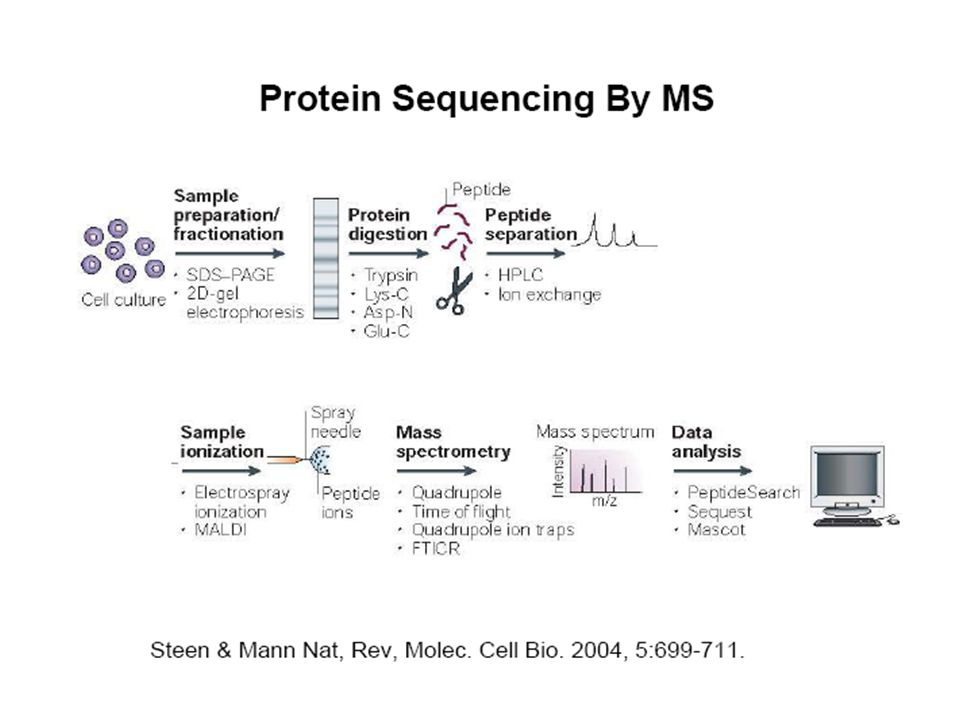
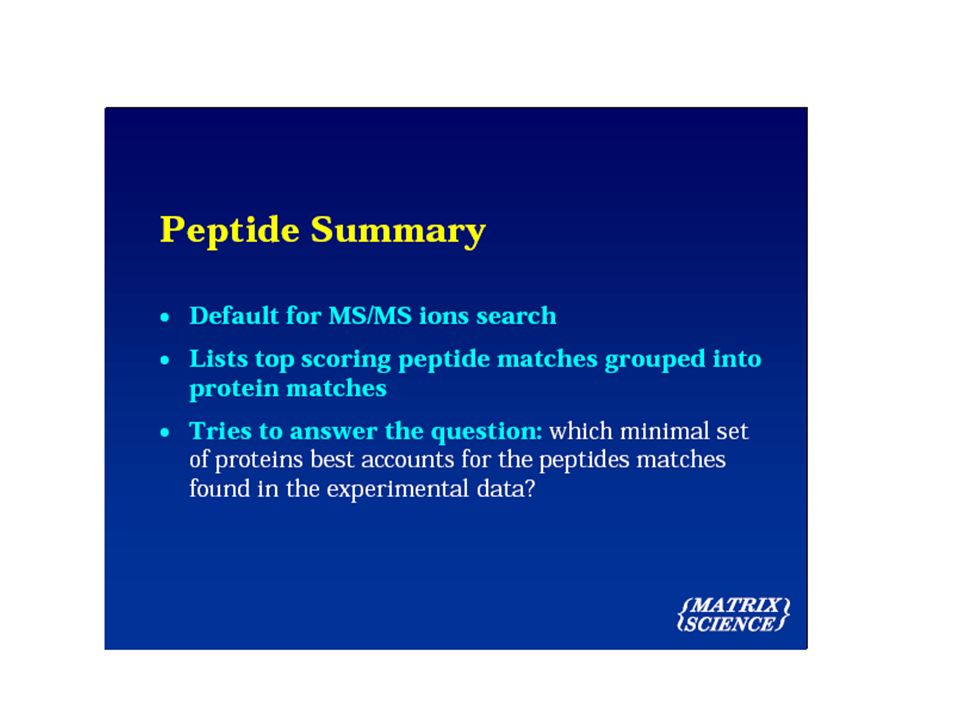
Mascot Search Overview Mascot is a powerful search engine which uses mass spectrometry data to identify proteins from primary sequence databases. While a number of similar programs available, Mascot is unique in that it integrates all of the proven methods of searching. These different search methods can be categorised as follows: Peptide Mass Fingerprint in which the only experimental data are peptide mass values. Sequence Query in which peptide mass data are combined with amino acid sequence and composition information. A super-set of a sequence tag query. MS/MS Ion Search using uninterpreted MS/MS data from one or more peptides. The general approach for all types of search is to take a small sample of the protein of interest and digest it with a proteolytic enzyme, such as trypsin. The resulting digest mixture is analysed by mass spectrometry. Different types of mass spectrometer have different capabilities. A simple instrument will measure a set of molecular weights for the intact mixture of peptides. An instrument with MS/MS capability can additionally provide structural information by recording the fragment ion spectrum of a peptide. Usually, the digest mixture will be separated by chromatography prior to MS/MS analysis, so that MS/MS spectra from individual peptides can be measured. The experimental mass values are then compared with calculated peptide mass or fragment ion mass values, obtained by applying cleavage rules to the entries in a comprehensive primary sequence database. By using an appropriate scoring algorithm, the closest match or matches can be identified. If the "unknown" protein is present in the sequence database, then the aim is to pull out that precise entry. If the sequence database does not contain the unknown protein, then the aim is to pull out those entries which exhibit the closest homology, often equivalent proteins from related species. The sequence databases that can be searched on this server are: MSDBMSDB is a comprehensive, non-identical protein sequence database maintained by the Proteomics Department at the Hammersmith Campus of Imperial College London. MSDB is designed specifically for mass spectrometry applications. NCBInrNCBInr is a comprehensive, non-identical protein database maintained by NCBI for use with their search tools BLAST and Entrez. The entries have been compiled from GenBank CDS translations, PIR, SWISS-PROT, PRF, and PDB. SwissProtSwissProt is a high quality, curated protein database. Sequences are non-redundant, rather than non-identical, so you may get fewer matches for an MS/MS search than you would from a comprehensive database, such as MSDB or NCBInr. SwissProt is ideal for peptide mass fingerprint searches. dbESTdbEST is the division of GenBank that contains "single-pass" cDNA sequences, or Expressed Sequence Tags, from a number of organisms. During a Mascot search, the nucleic acid sequences are translated in all six reading frames. dbEST is a very large database, and is divided into three sections: EST_human, EST_mouse, and EST_others. Even so, searches of these databases take far longer than a search of one of the non-redundant protein databases. You should only search an EST database if a search of a protein database has failed to find a match. http://www.matrixscience.com/

50
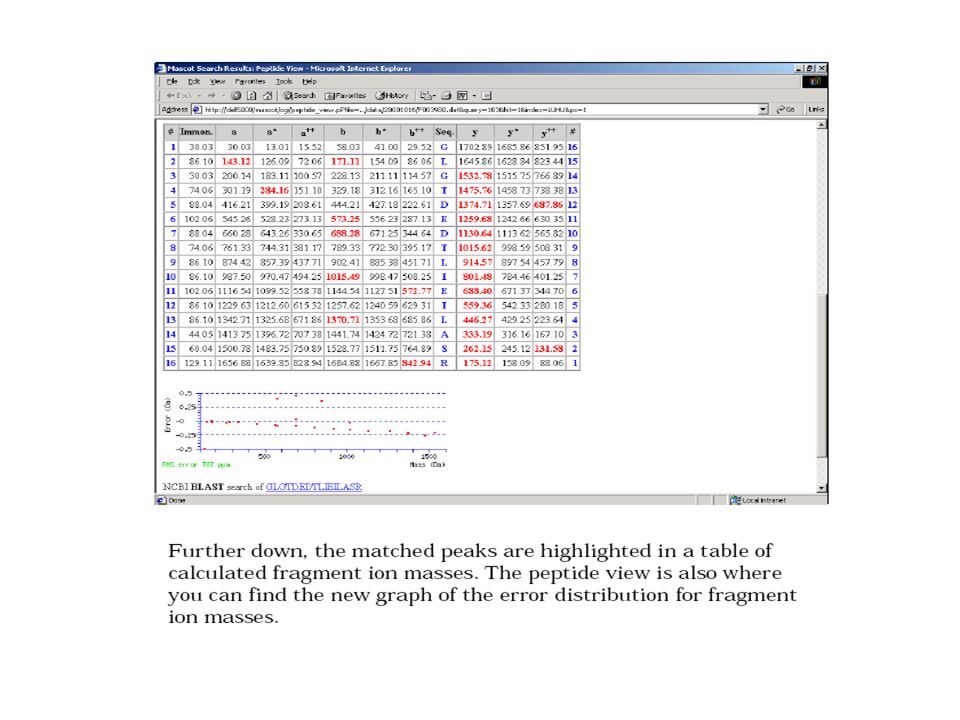
All matches to this query Score Mr(calc):DeltaSequence 46.11604.85350.0046THRIHWESASLLR 31.01605.7594-0.9012SSNSSPSRXSLGQLSE 30.21604.81330.0448PRFCASLAGGAWLSGL 28.81605.7006-0.8424ETKEGTEGEGLQEEA 28.81605.7006-0.8424ETKEGTEGEGLQEEX 28.81604.77220.0859GGSLYEAPVSYTFSK 28.51605.8627-1.0045APVIPAPWEAKAGGSR 27.61604.77150.0866EEGTAASLADIMEIR 27.01603.83181.0264HVLAHSESINVIAQS 26.91604.74640.1118SSSILAMRDEQSNPA Protein View Match to: gi|226159 Score: 46: complement C3f Nominal mass (Mr): 2020; NCBI BLAST search of gi|226159 against nrUnformatted sequence string forgi|226159sequence string pasting into other applicationsTaxonomy: Homo sapiens No enzyme cleavage specificity Sequence Coverage: 76% Matched peptides shown in Bold Red 1 SSKITHRIHW ESASLLR Peptide View MS/MS Fragmentation of THRIHWESASLLR Found in gi|226159, complement C3f Match to Query 1: 1604.858172 from(535.960000,3+) Mascot search of MS/MS databases Cristina C. Clement, unpublished results

51
Monoisotopic mass of neutral peptide Mr(calc): 1604.8535Ions Score: 46 Expect: 5.4 Matches (Bold Red): 43/134 fragment ions using 51 most intense peaks #bb ++ b*b* ++ b0b0 b 0++ Seq. yy ++ y*y* ++ y0y0 y 0++ # 1102.055051.5311 84.044442.5258T 13 2239.1139120.0606 221.1033111.0553H1504.8132752.91021487.7866744.39691486.8026743.904912 3395.2150198.1111 378.18 84 189.5979377.2044189.1058R1367.7542684.38081350.7277675.86751349.7437675.375511 4508.2990254.6532 491.27 25 246.1399490.2885245.6479I1211.6531606.33021194.6266597.81691193.6426597.324910 5645.3580323.1826 628.33 14 314.6693627.3474314.1773H1098.5691549.78821081.5425541.27491080.5585540.78299 6831.4373416.2223 814.41 07 407.7090813.4267407.2170W961.5102481.2587944.4836472.7454943.4996472.25348 7960.4799480.7436 943.45 33 472.2303942.4693471.7383E775.4308388.2191758.4043379.7058757.4203379.21387 81047.5119524.2596 1030.4 853 515.74631029.5013515.2543S646.3882323.6978629.3617315.1845628.3777314.69256 91118.5490559.7781 1101.5 225 551.26491100.5384550.7729A559.3562280.1817542.3297271.6685541.3457271.17655 1010 1205.5810603.2942 1188.5 545 594.78091187.5705594.2889S488.3191244.6632471.2926236.1499470.3085235.65794 1 1318.6651659.8362 1301.6 385 651.32291300.6545650.8309L401.2871201.1472384.2605192.6339 3 1212 1431.7492716.3782 1414.7 226 707.86491413.7386707.3729L288.2030144.6051271.1765136.0919 2 1313 R175.119088.0631158.092479.5498 1 Cristina C. Clement, unpublished results

52
550.52-LTQ (2+) Cristina C. Clement, unpublished results
 Cristina C. Clement, unpublished results")
53
All matches to this query Score Mr(calc):DeltaSequence 45.21097.56180.0237HWESASLLR 30.01097.56510.0203HGKEMDLLR 29.21098.4441-0.8586GFTFSASDMH 27.61097.5869-0.0015AFSFSSALIR 26.91098.4652-0.8797HSTYSSLMSS 26.71097.49890.0865HGEEASSAIPT 24.61097.6094-0.0240HQGKLVFNR 24.11098.4764-0.8910HGEEGMGQGVV 24.01097.53530.0502HGEKEEELK 24.01099.4274-1.8420QSQKSSMDSC Protein View Match to: gi|226159 Score: 42: complement C3f Nominal mass (Mr): 2020; NCBI BLAST search of gi|226159 against nrUnformatted sequence string for pasting into other applicationsTaxonomy: Homo sapiensgi|226159sequence stringHomo sapiens No enzyme cleavage specificity Sequence Coverage: 52% Matched peptides shown in Bold Red 1 SSKITHRIHW ESASLLR Peptide View MS/MS Fragmentation of HWESASLLR Found in gi|226159, complement C3f Match to Query 1: 1097.585448 from(549.800000,2+) Cristina C. Clement, unpublished results

54
Monoisotopic mass of neutral peptide Mr(calc): 1097.5618Ions Score: 45 Expect: 6.5 Matches (Bold Red): 26/70 fragment ions using 37 most intense peaks #bb ++ b0b0 b 0++ Seq.yy ++ y*y* ++ y0y0 y 0++ # 1138.066269.5367 H 9 2324.1455162.5764 W961.5102481.2587944.4836472.7454943.4996472.25348 3453.1881227.0977435.1775218.0924E775.4308388.2191758.4043379.7058757.4203379.21387 4540.2201270.6137522.2096261.6084S646.3882323.6978629.3617315.1845628.3777314.69256 5611.2572306.1323593.2467297.1270A559.3562280.1817542.3297271.6685541.3457271.17655 6698.2893349.6483680.2787340.6430S488.3191244.6632471.2926236.1499470.3085235.65794 7811.3733406.1903793.3628397.1850L401.2871201.1472384.2605192.6339 3 8924.4574462.7323906.4468453.7271L288.2030144.6051271.1765136.0919 2 9 R175.119088.0631158.092479.5498 1 1 SSKITHRIHW ESASLLR - 1 st hit for complement c3f 1 SSKITHRIHW ESASLLR - 2 nd hit for complement c3f Cristina C. Clement, unpublished results

55
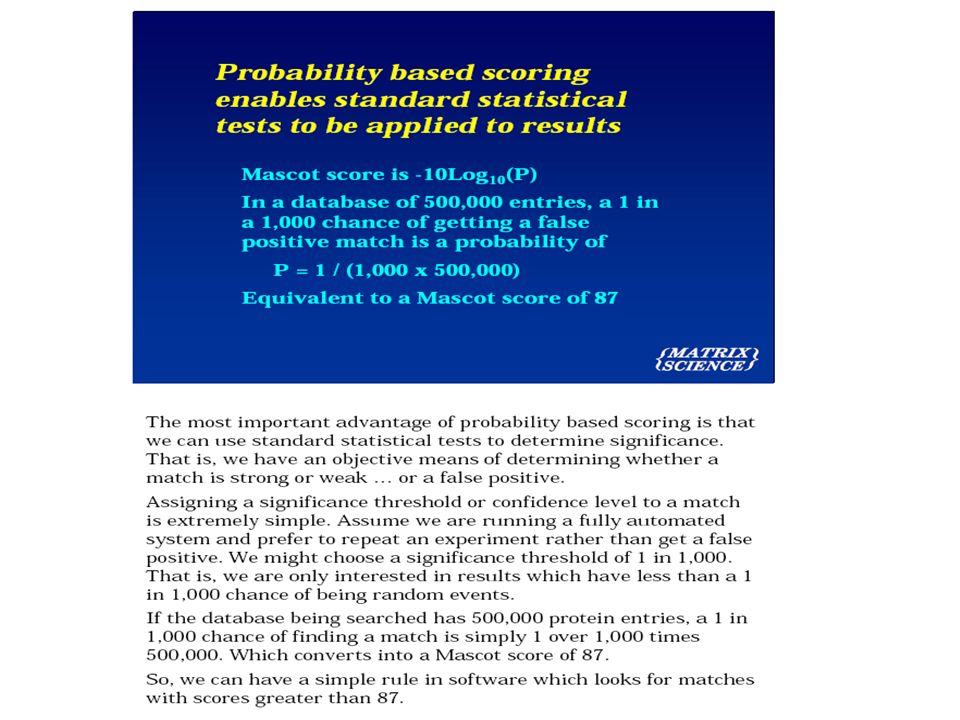
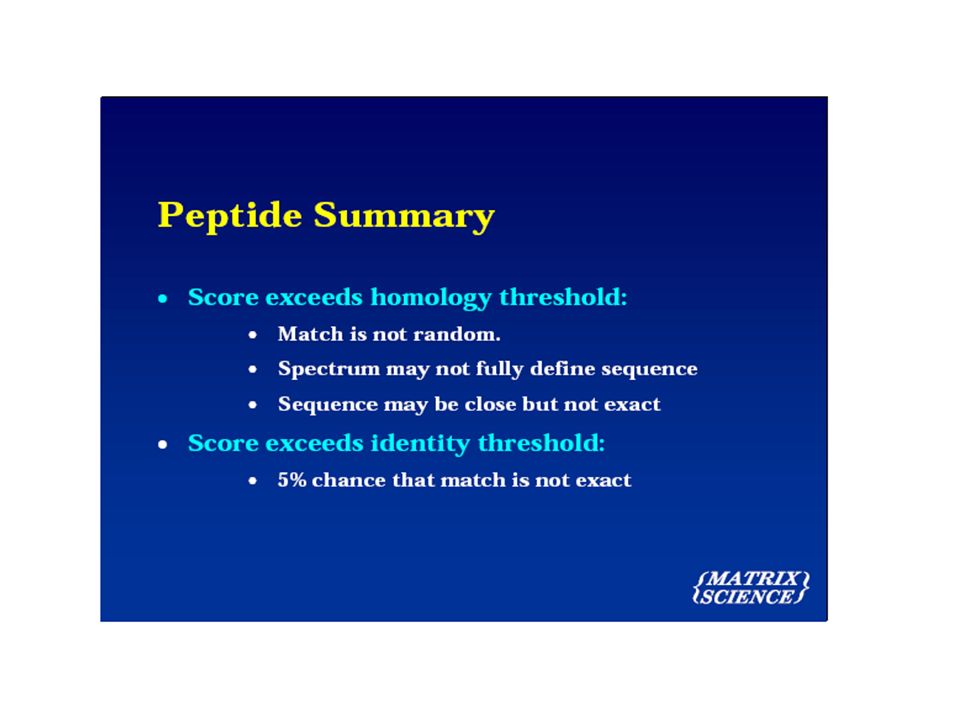
Monoisotopic:733.32, Charge= +2 Cristina C. Clement, unpublished results Probability Based Mowse Score Ions score is -10*Log(P), where P is the probability that the observed match is a random event. Individual ions scores > 56 indicate peptides with significant homology. Individual ions scores > 73 indicate identity or extensive homology (p<0.05). Protein scores are derived from ions scores as a non- probabilistic basis for ranking protein hits.
, where P is the probability that the observed match is a random event. Individual ions scores > 56 indicate peptides with significant homology. Individual ions scores > 73 indicate identity or extensive homology (p<0.05). Protein scores are derived from ions scores as a non- probabilistic basis for ranking protein hits..")
56
Peptide View MS/MS Fragmentation of DSGEGDFLAEGGGVR Found in gi|229185, fibrinopeptide A Match to Query 1: 1464.625448 from(733.320000,2+) Data file C:\Documents and Settings\Laura Santambrogio\Desktop\rksah062708\LTQ\LTQ- ccc\LII_3RAW071608\12446Raw_2+.txt #bb ++ b0b0 b 0++ Seq.yy ++ y*y* ++ y0y0 y 0++ # 1116.034258.520798.023749.5155D 15 2203.0662102.0368185.055793.0315S1350.6284675.81791333.6019667.30461332.6179666.812614 3260.0877130.5475242.0771121.5422G1263.5964632.30181246.5699623.78861245.5858623.296613 4389.1303195.0688371.1197186.0635E1206.5749603.79111189.5484595.27781188.5644594.785812 5446.1518223.5795428.1412214.5742G1077.5323539.26981060.5058530.75651059.5218530.264511 6561.1787281.0930543.1681272.0877D1020.5109510.75911003.4843502.24581002.5003501.753810 7708.2471354.6272690.2366345.6219F905.4839453.2456888.4574444.7323887.4734444.24039 8821.3312411.1692803.3206402.1639L758.4155379.7114741.3890371.1981740.4050370.70618 9892.3683446.6878874.3577437.6825A645.3315323.1694628.3049314.6561627.3209314.16417 101021.4109511.20911003.4003502.2038E574.2944287.6508557.2678279.1375556.2838278.64556 111078.4324539.71981060.4218530.7145G445.2518223.1295428.2252214.6162 5 121135.4538568.23051117.4433559.2253G388.2303194.6188371.2037186.1055 4 131192.4753596.74131174.4647587.7360G331.2088166.1081314.1823157.5948 3 141291.5437646.27551273.5331637.2702V274.1874137.5973257.1608129.0840 2 15 R175.119088.0631158.092479.5498 1 Monoisotopic mass of neutral peptide Mr(calc): 1464.6481Ions Score: 123 Expect: 5.3e-07 Matches (Bold Red): 38/130 fragment ions using 34 most intense peaks Cristina C. Clement, unpublished results

57
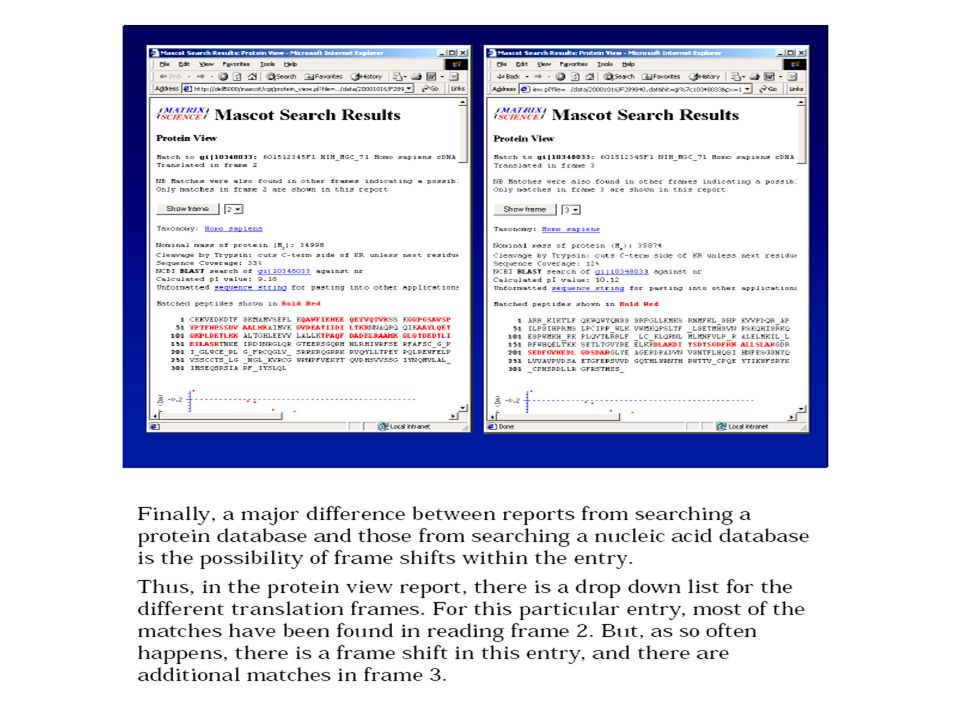
ScoreMr(calc):DeltaSequence 123.51464.6481-0.0227DSGEGDFLAEGGGVR 79.81463.66410.9614DSGEGDFLAEGGGVR 37.21464.60790.0176LDLCQDSFPGNPTG 36.61467.6776-3.0521EMYRNLAQGRNV 36.61467.6776-3.0521EMYRNLAQGRNV 35.61464.6721-0.0466CARGWAFDIWGQG 33.71464.7606-0.1352SSVGTEMIITKAGR 33.51465.6645-1.0390RSSGGETETTGQSAV 33.51466.6485-2.0231RSSGGETETTGQSAV 32.81464.6568-0.0314CARDQAFDIWGQG 1 MFSMRIVCLV LSVVGTAWTA DSGEGDFLAE GGGVRGPRVV ERHQSACKDS 51 DWPFCSDEDW NYKCPSGCRM KGLIDEVNQD FTNRINKLKN SLFEYQKNNK 101 DSHSLTTNIM EILRGDFSSA NNRDNTYNRV SEDLRSRIEV LKRKVIEKVQ 151 HIQLLQKNVR AQLVDMKRLE VDIDIKIRSC RGSCSRALAR EVDLKDYEDQ 201 QKQLEQVIAK DLLPSRDRQH LPLHSSLGDR ARLHLKTNKT AKKKKKKKKK Cristina C. Clement, unpublished results

58
Bioinformatics Workshop project Leading project supervisor: Cristina C. Clement, Ph.D. Set up the MS/MS Ion search parameters using Mascot algorithm http://www.matrixscience.com/ Import txt. files of ms/ms data at the Mascot server ON LINE (3 independent txt files are provided/student) 01/21/2009 Analyze Mascot results -Analyze Peptide View, understand the scoring functions -Analyze the Protein View, understand the sequence coverage Re-analyze the txt MS/MS files using independent searching algorithms at PROSPECT and PROFOUND webservers
 01/21/2009 Analyze Mascot results -Analyze Peptide View, understand the scoring functions -Analyze the Protein View, understand the sequence coverage Re-analyze the txt MS/MS files using independent searching algorithms at PROSPECT and PROFOUND webservers.")
Similar presentations


 on the Q-ToF2>")

>")

 is injected into the mass spectrometer and vaporized at elevated temperature and reduced.>")


>")


 Course Director David Fenyö Contact information>")
 + Fractionation.>")
