Download presentation
Presentation is loading. Please wait.

1
Eda Selected Slides Tide Gauge

2
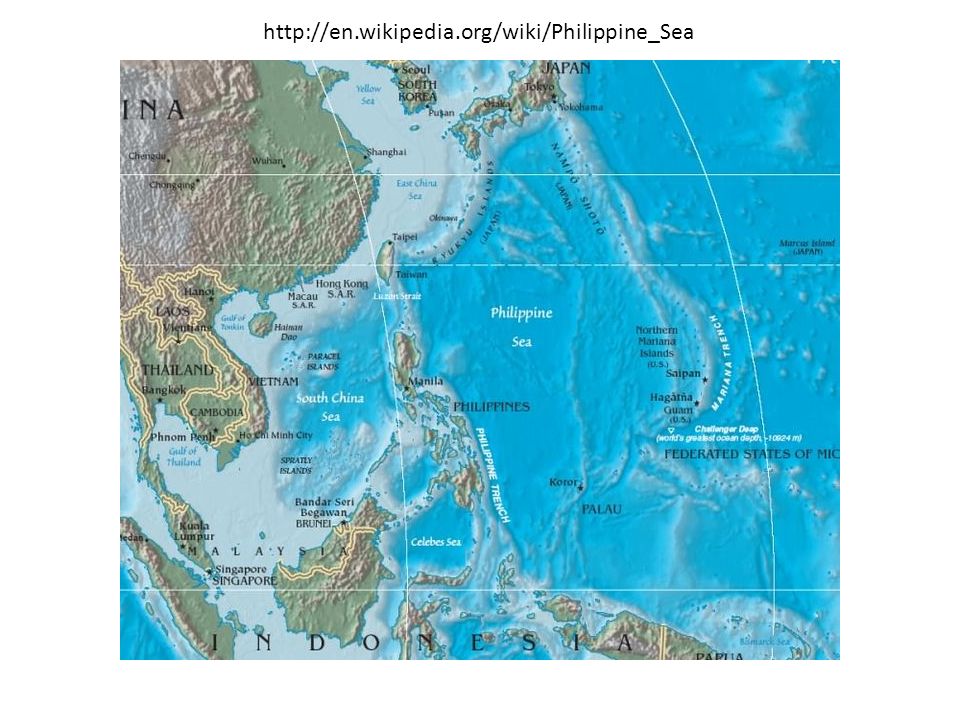
http://en.wikipedia.org/wiki/Philippine_Sea
3
Keelung Ganfeng Suao Ishigaki Keelung: 1980-2009 Ishigaki: 1969-2008 Gangfeng: 1997-2007 Suao: 1999-2005

4
Time period of data Keelung: 1980-2009 Ishigaki: 1969-2008 Gangfeng: 1997-2007 Suao: 1999-2005 Lanyu:1992-2009 Dawu:2004-2009 Mean SSH from Rio et al.2009 Black dots are the locations of the tide gauge stations. Blue contours are the isobaths.

5
Original data after 40 hrs low pass. There are some missing data

6
The linear regression is done in order to fill in the gap. Method1: 1.Ishigaki and Keelung. Fill in the gap with each other. Method2: 1.Ganfeng and Keelung (same side) Fill in the gap of Keelung. 2.Keelung and Ishigaki Fill in the gap of Ishigaki Ganfeng & Keelung Keelung & Ishigaki
 Fill in the gap of Keelung. 2.Keelung and Ishigaki Fill in the gap of Ishigaki Ganfeng & Keelung Keelung & Ishigaki.")
7
Compare two methods SSH at Keelung method 1: black Method2: red

8
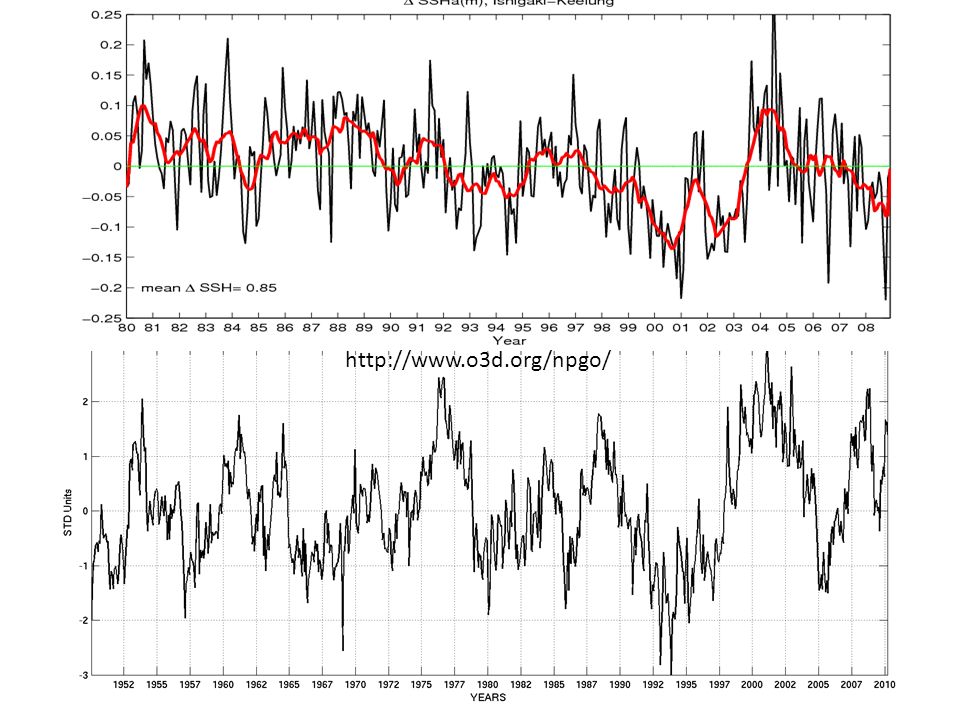
Anomaly of Ishigaki-Keelung Black: monthly mean Red: 360days running mean Method 1 Method 2

9
Mean SSH from Rio et al.(2009) cover Pacific Ocean in 1/5 degree. Unit in meters
 cover Pacific Ocean in 1/5 degree. Unit in meters")
10
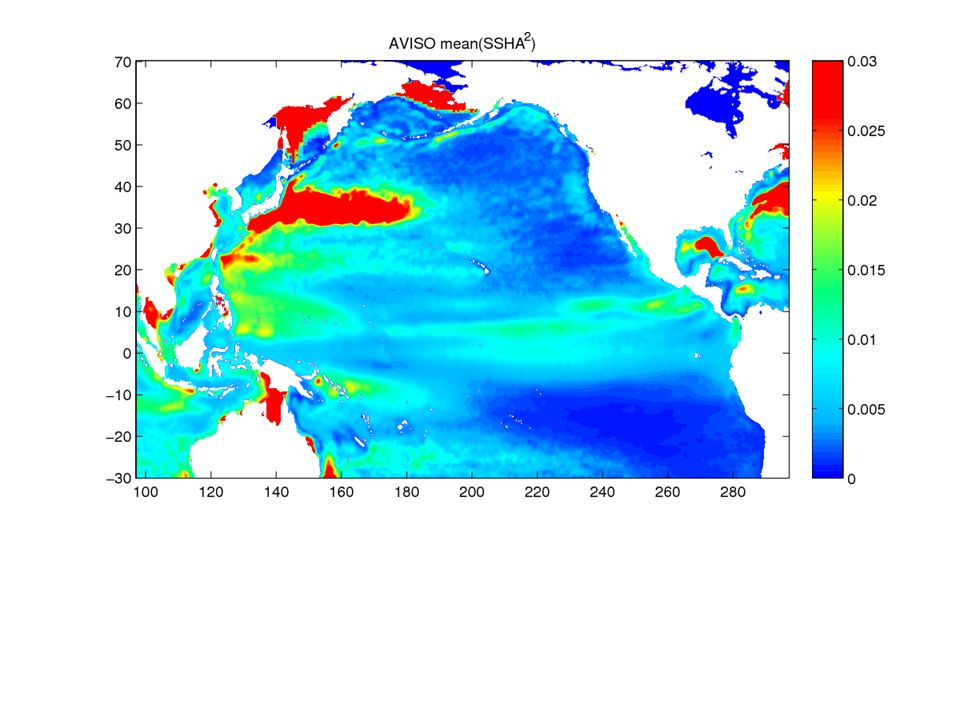
The eddy kinetic energy (EKE) is calculated by time mean(ƞ’ 2 ) ƞ’ is AVISO SSHA minus mean SSHA (slide16) The EKE is similar to the one in Qiu and Chen’s paper, except they mask out the two extreme regions (see their fig.1) Enlarge region
 is calculated by time mean(ƞ’ 2 ) ƞ’ is AVISO SSHA minus mean SSHA (slide16) The EKE is similar to the one in Qiu and Chen’s paper, except they mask out the two extreme regions (see their fig.1) Enlarge region")
12
A large EKE belt is shown east of Taiwan. The high EKE cannot pass through the sharp slope. It is limited in the deep water region.

13
Eda 20100903 Tide Gauge & AVISO

14
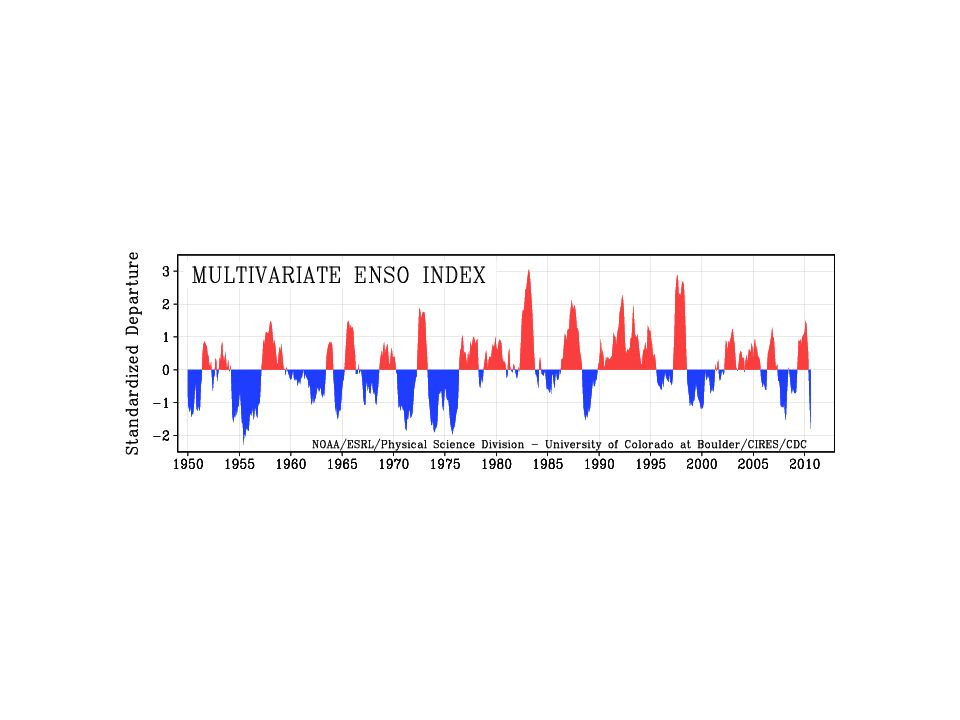
Nino3.4, West Pacific with Tide Gauge SSHA Colored bar are Nino3.4 or WP Contour is tide gauge SSHA SSHA does not correlate with Nino3.4. The correlation is better in WP (yellow box)
.")
15
AVISO & Tide Gauge Time: 1992/10/14~2008/12/31 (16 years) Tide Gauge : Ishigaki, Keelung AVISO: SSH, Ug, Vg (1/5 degree) Both tide gauge and AVISO data are monthly averaged Discussion: What contribute to the variation of the Kuroshio northeast off Taiwan? In order to answer this, the next part is the regression (correlation) between Tide Gauge SSHA and AVISO SSH, Ug, Vg.
 between Tide Gauge SSHA and AVISO SSH, Ug, Vg..")
16
Correlation coefficient Regression Y(i,j)=a(i,j)+b(I,j)*X X:tide gauge, Y:AVISO Plotted here is b Correlation Coef. Is very similar to regression b. The following plot will only use “b”. Tide gauge SSHA correlates well with a zonal band region east of Taiwan.

17
Zonal band=high EKE region The eddy activity contributes to the variation of Kuroshio transport northeast off Taiwan.

19
Regression, VgRegression, Ug Tide Gauge SSHA has good correlation with Kuroshio upstream and the Mindanao Current 1.Eddy zone (anti-cyclonic eddy) 2.Two branches of Kuroshio; East China Sea; Ryukyu Island p.s. the regressions are very similar to dSSH/dx, dSSH/dy (fig. not shown).
..")
20
corr Tide Gauge SSH (black) & mean eddy zone SSHA (red) Defined eddy zone Eddy activity has important influence to the variation of Kuroshio transport east off Taiwan
 & mean eddy zone SSHA (red) Defined eddy zone Eddy activity has important influence to the variation of Kuroshio transport east off Taiwan")
21
Regression : AVISO ∆SSH (same locations) & AVISO Regression : AVISO ∆SSH (East Luzon) & AVISO High regression also shows in eddy zone. Further south, at east of Luzon, the Kuroshio transport does not have high regression with eddy zone

22
East Luzon AVISO ∆SSH & AVISO Vg Interestingly, the Kuroshio transport east off Luzon does not correlate well with futhur north transport.

23
Nino3.4 WP

24
summary Kuroshio transport east off Taiwan is affected by eddy activity, therefore, it shows different variation with East Luzon transport where is south of the eddy zone. Tide gauge ∆SSH has good regression with two branches of Kuroshio; one enter East China Sea; the other one moves along Ryukyu Island

25
Eda 20100908 Tide Gauge & AVISO

26
Corr., Reg., Siglev. Corr: correlation coefficient. (+-1) The degree of correlation between X and Y Reg: regression (plotted “b”) How much Y fluctuates respecting to X Siglev: Significant level (95% confidence level)
 The degree of correlation between X and Y Reg: regression (plotted b ) How much Y fluctuates respecting to X Siglev: Significant level (95% confidence level).")
27
TideGauge & AVISO SSH Mean Vg (tide gauge)=0.52 m/s Distance=259km, f=6.2*1.e-5 s -1,g=9.806 ms -2
=0.52 m/s Distance=259km, f=6.2*1.e-5 s -1,g=9.806 ms -2")
28
Time series of SSHA Tide gauge (black solid) AVISO (red dash)
 AVISO (red dash)")
29
Time series of SSHA & Tauy Tide gauge (black solid) Tauy (red dash)
 Tauy (red dash)")
30
TW ? ? La nina El nino 12N wind

32
Eda 20100915 Tide Gauge & AVISO

33
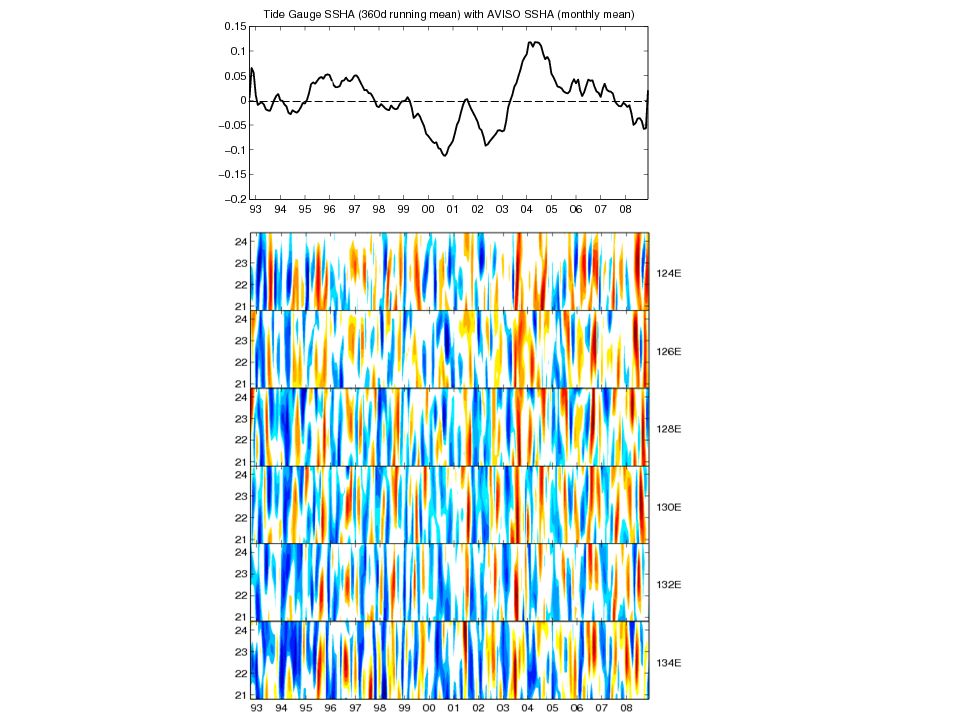
EOF AVISO SSH: 360d running mean mode1: 67% mode2: 7.3% mode3: 3.9 %

34
Time series of SSHA Tide gauge (black solid) AVISO (red dash)
 AVISO (red dash)")
35
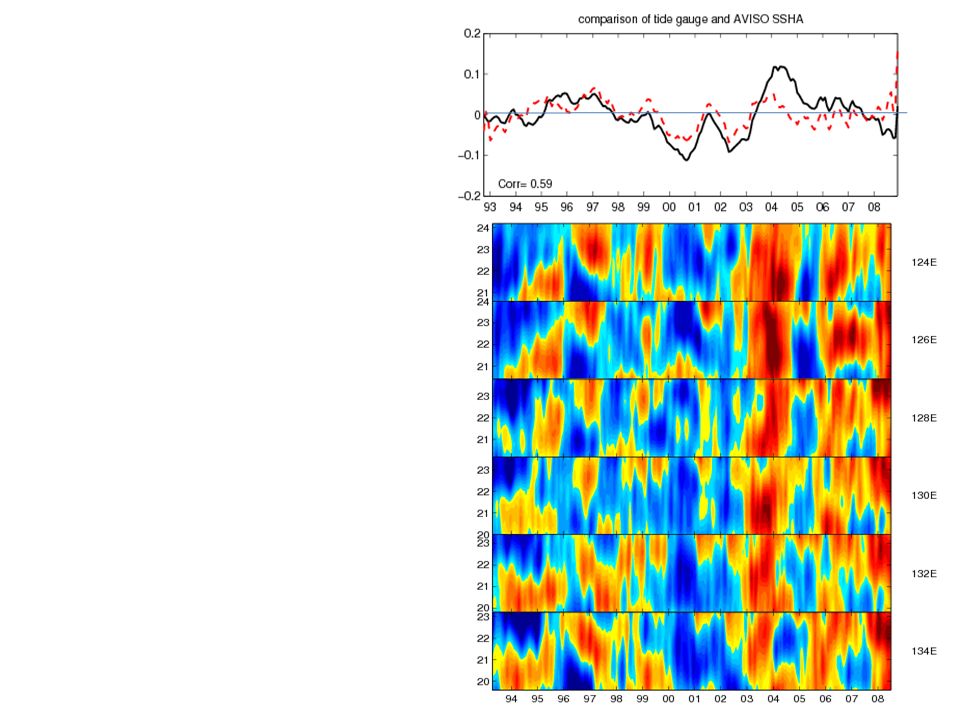
Comparison: tide gauge and AVISO

36
Time series of SSHA AVISO: south Taiwan

37
Time series of SSHA AVISO: east Luzon

38
Correlation and regression of AVISO SSHA & Tide Gauge North Taiwan

39
Correlation and regression of AVISO SSHA North Taiwan

40
Correlation and regression of AVISO SSHA South Taiwan

41
Correlation and regression of AVISO SSHA East Luzon

42
7 days

43
monthly

45
Comparison: tide gauge and AVISO

46
+ve http://jisao.washington.edu/pdo/ SST (color), SLP (contours) and wind stress (arrows) anomalies during +ve and –ve PDO’s -ve 1990
, SLP (contours) and wind stress (arrows) anomalies during +ve and –ve PDO’s -ve 1990")
47
http://www.o3d.org/npgo/
49
Eda 20100924 Tide Gauge & AVISO

50
Comparison: Tide Gauge and AVISO 360d running mean & Low-pass

51
+ve SST (color), SLP (contours) and wind stress (arrows) anomalies during +ve and –ve PDO’s -ve
, SLP (contours) and wind stress (arrows) anomalies during +ve and –ve PDO’s -ve")
52
PDO & eddy do not have direct correlation PDO-> Tide gauge Eddy-> Tide gauge

53
Discussion Tide gauge : Kuroshio north east off Taiwan Tide gauges are locate at the special positions. They are not only affected by the wind, but also get the influence of eddy activity. From Qiu and Chen’s (2010) fig.3: Kuroshio is part of the gyre north of bifurcation point. This gyre is affected by the large scale wind (curl<0). When the gyre moves northward, the gradient of SSH becomes larger-> Kuroshio becomes stronger. This larger gradient is contributed by the eddy zone (see their fig. 3a) When the gyre moves southward, the “eddy zone” becomes wider, therefore, the eddy is not only affect “tide gauge”, but also south Taiwan and east Luzon. So, the eddy activity we defined in the “eddy zone” should also relates to the wind.
 fig.3: Kuroshio is part of the gyre north of bifurcation point. This gyre is affected by the large scale wind (curl<0). When the gyre moves northward, the gradient of SSH becomes larger-> Kuroshio becomes stronger. This larger gradient is contributed by the eddy zone (see their fig. 3a) When the gyre moves southward, the eddy zone becomes wider, therefore, the eddy is not only affect tide gauge , but also south Taiwan and east Luzon. So, the eddy activity we defined in the eddy zone should also relates to the wind..")
54
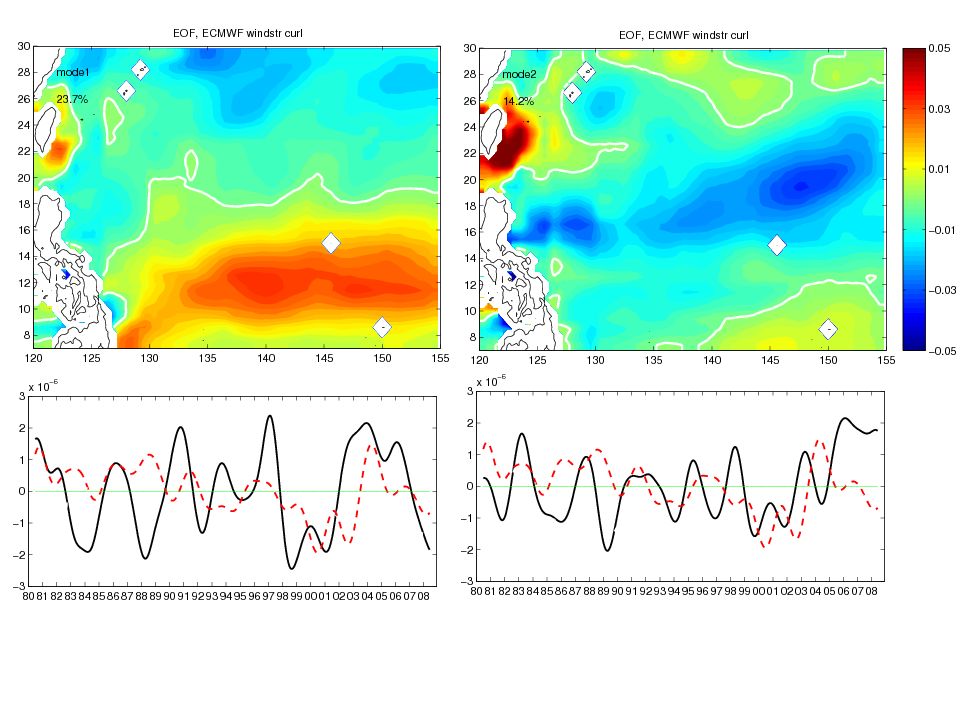
Discussion See Qiu and Chen’s fig.3 again… The Midanao current becomes stronger also when the Kuroshio strengthens. If Midanao current is affected the wind (curl>0, the region we are looking at): Curl increase -> Midanao current increase Midanao current increase -> Kuroshio also increase Therefore, we will get curl and tidegauge are correlated. Let’s see EOF will be more clearly….
: Curl increase -> Midanao current increase Midanao current increase -> Kuroshio also increase Therefore, we will get curl and tidegauge are correlated. Let’s see EOF will be more clearly…..")
57
WSCa_EOF1 TG WSCa_PC1 (A) (B) (C) Philippine Sea El Nino WSCa_PC2TG
 (B) (C) Philippine Sea El Nino WSCa_PC2TG")
61
Eda 20100928 Tide Gauge & AVISO

62
PDO leads tide gauge 11 months. Corr.Coef. ~0.47

64
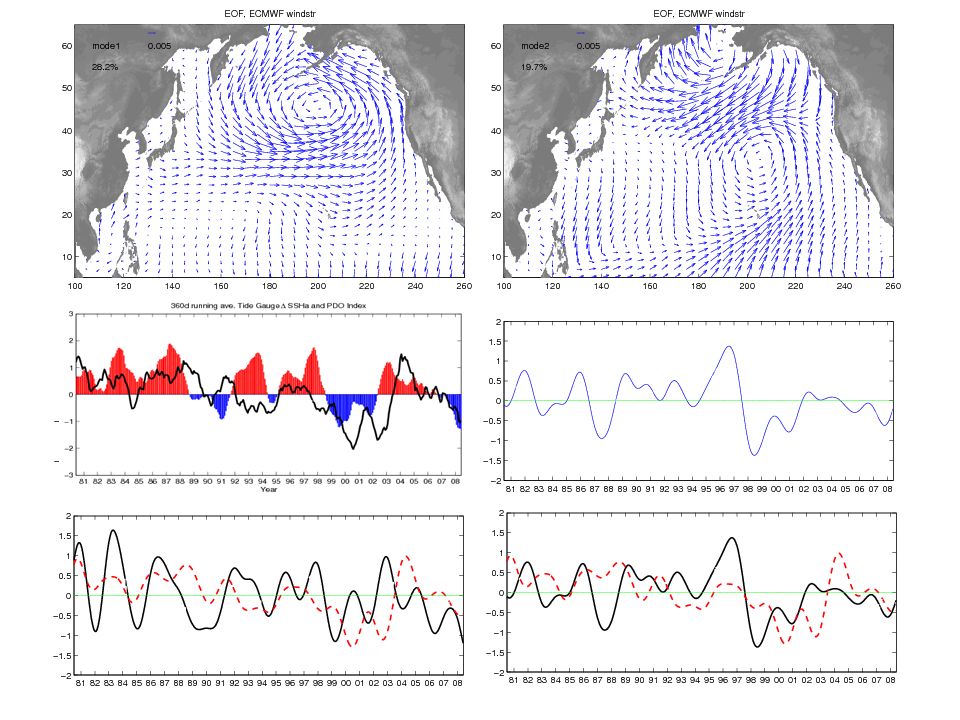
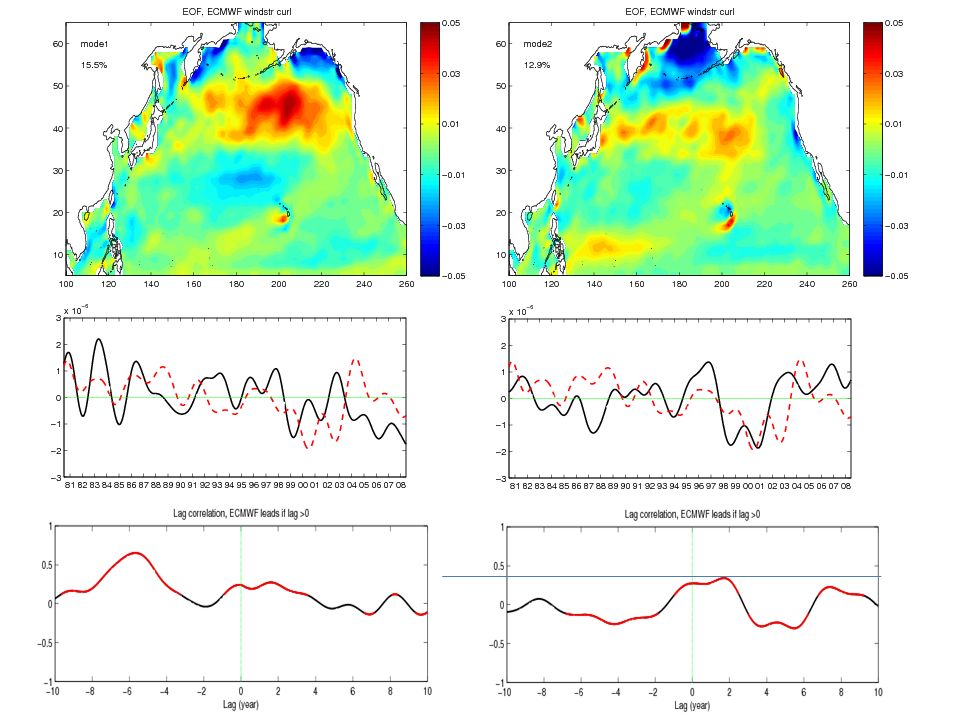
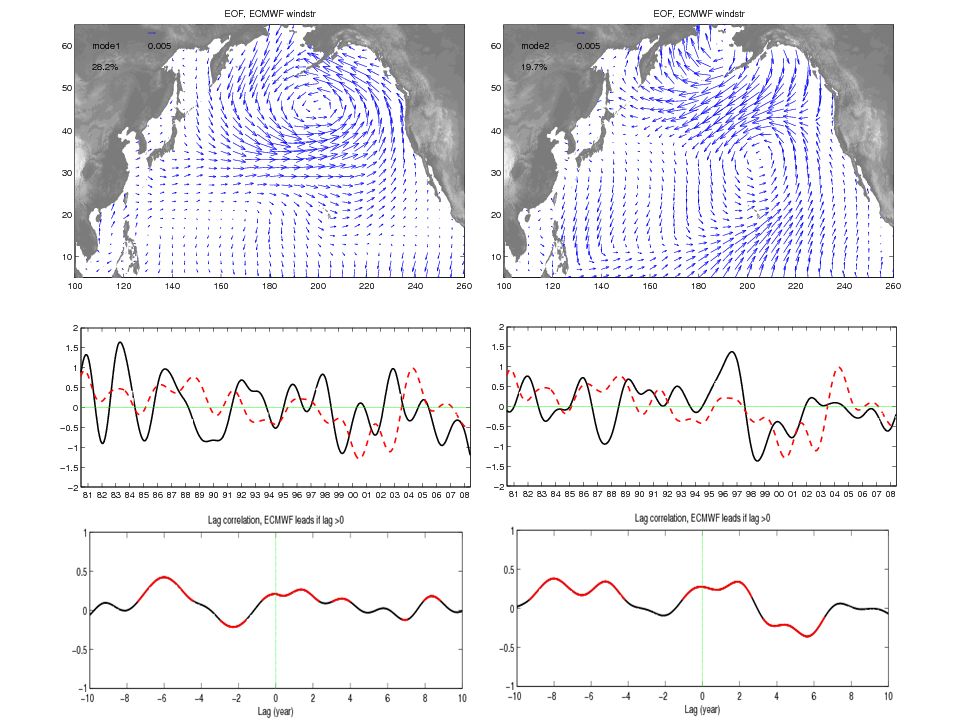
Mode 1 + 2 37.9% Wind stress curl leads ~ 1 year Corr. Coef.~0.5

66
Wind stress curl leads PDO 3 month. Corr.Coef. ~0.75

68
0 1 2

69
0 1 2 Near the S. center of the WP index.

70
PDO leads tide gauge 11 months. Corr.Coef. ~0.47 EkConv & PDO correlate So EkConv also leads TG EkConv = Ekman Convergence Fig.10b of Qiu & Chen, 2010, JPO, 213-225.

73
Weekly result Eda 20101008 & later Tide Gauge & AVISO TideGauge_20101008_eda.pptx TideGauge_20101015_eda_summary.pptxTideGauge_20101015_eda_summary.pptx (summary of TG, AVISO, ECMWF) TideGauge_20101015_eda_OFES.pptxTideGauge_20101015_eda_OFES.pptx (compare with OFES)
 TideGauge_ _eda_OFES.pptxTideGauge_ _eda_OFES.pptx (compare with OFES)")
75
monthly

Similar presentations


 L. Talley Fall, 2014 Talley SIO210 (2014)1 Variation of Coriolis with latitude: “β” Vorticity Potential vorticity.>")


 # F.-H. Xu & L.-Y. Oey* Princeton University *>")


 project.>")


 Review 09 – 11 March 2010 Satellite Observations of Seasonal Sediment Plume in the Central East China.>")


>")