Download presentation
Presentation is loading. Please wait.

1
City of Cornwall 2006 Draft Budget Presentation November 17, 2005

2
2006 Draft Budget 20062005 Operating expenditures$128,024,559 $120,255,796 Capital expenditures (net) 3,556,000 4,653,000 Net Expenditures$131,580,559 $124,908,796 Net tax levy $50,242,861 $ 47,355,196 Water $ 6,571,926 $ 6,520,690 Sewer 6,258,608 5,476,584 Net user charges$ 12,830,534 $ 11,997,274
 3,556,000 4,653,000 Net Expenditures$131,580,559 $124,908,796 Net tax levy $50,242,861 $ 47,355,196 Water $ 6,571,926 $ 6,520,690 Sewer 6,258,608 5,476,584 Net user charges$ 12,830,534 $ 11,997,274")
3
The departmental requests resulted in a year over year net expenditure increase of $8,615,120. This represents a 5.5% increase in expenditures over the 2005 approved budget. In reviewing these requests, administration has taken the following actions: maintained a constant tax rate as approved in 2005, resulting in a possible increase in tax revenues of $2,907,665. reductions to requests made by the CAO and Manager of Finance in the amount of $4,918,500 leaving a budgetary shortfall of $788,955.

4
The following represents the proposed cuts from 2006 requests: Capital Reductions Road Work Brookdale Avenue $1,150,000 Courtaulds Spur Line 700,000 Asphalt Resurfacing 100,000 Facilities Justice Building 110,000 Fire Headquarters (R) 800,000 Pumper(R) 150,000 Emergency Management Generator 86,942 Emergency Medical Service Headquarters (R) 500,000
 800,000 Pumper(R) 150,000 Emergency Management Generator 86,942 Emergency Medical Service Headquarters (R) 500,000")
5
Capital Reductions con’t Municipal Works Equipment (net)547,000 Recreation Cladding - Civic Complex600,000 Funding from Reserves Ambulance Replacement 42,251 Fleet Hydro Fuel Injection 24,612 $4,810,805 Operating Reductions Fire Truck Lease $ 10,751 Emergency Management Mapping and Op Center 18,655 EMS Advanced Care Training (net) 78,289 $107,695
547,000 Recreation Cladding - Civic Complex600,000 Funding from Reserves Ambulance Replacement 42,251 Fleet Hydro Fuel Injection 24,612 $4,810,805 Operating Reductions Fire Truck Lease $ 10,751 Emergency Management Mapping and Op Center 18,655 EMS Advanced Care Training (net) 78,289 $107,695")
6
Included in the 2006 budget is $3.5M in gross expenditures requests from outside / non- controllable entities. It is management’s view that budgets submitted by “outside agencies” (including City agencies) are beyond our scope to propose cuts in expenditure requests or service levels. Outside agencies include any budget approved by a board or commission prior to review by City Council.
 are beyond our scope to propose cuts in expenditure requests or service levels. Outside agencies include any budget approved by a board or commission prior to review by City Council..")
7
City of Cornwall Police Department Cornwall and Area Housing Corporation Cornwall Public Library Glen Stor Dun Lodge Eastern Ontario Health Unit Raisin Region Conservation Authority Cornwall and Seaway Valley Tourism Cornwall Historical Society Cornwall Regional Airport Cornwall Regional Art Gallery Heart of the City Genealogical Society Outside/Non-controllable agencies include:

8
When reviewing the level of these requests, the total contributions requested exceeds $6,067,000 (an increase of $999,000 over 2005). It should be noted that the Police Services Board has not yet approved the 2006 budget. (The 2005 approved budget approximated $13M and is expected to increase by approximately 3% in 2006. The specific budget has been included as a single line item in the draft budget being presented.) The total requests from these agencies (including 3% for the Police) exceeds $1.4M. Using the 2005 tax levy, this in itself would generate a tax increase of 3%. Wages and benefits (excluding Police) exceeded $40M in 2005. The industry standard for increases approximate 3%. A 3% wage increase itself represents an additional $1,2M in expenditures resulting in a 2.5% tax increase. This does not include step increases awarded to employees as they proceed through union contracts
 The total requests from these agencies (including 3% for the Police) exceeds $1.4M. Using the 2005 tax levy, this in itself would generate a tax increase of 3%. Wages and benefits (excluding Police) exceeded $40M in The industry standard for increases approximate 3%. A 3% wage increase itself represents an additional $1,2M in expenditures resulting in a 2.5% tax increase. This does not include step increases awarded to employees as they proceed through union contracts.")
9
and non-union pay grids. It should be noted that not all wage increases are passed on to the municipal taxpayer as specific departments (SS, EMS, GSDL) have portions of their wages and benefits funded through various ministries and the Counties of SD&G The expected cost of utilities, including, water, electricity and natural gas is projected to increase ($3,332,819) by $276,654, itself representing a potential tax increase of.58%. In reviewing other expenses, a significant increase is noted in contracted services. The majority of this increase relates to the “Best Start” program, that as we understand will be funded 100%.
 have portions of their wages and benefits funded through various ministries and the Counties of SD&G The expected cost of utilities, including, water, electricity and natural gas is projected to increase ($3,332,819) by $276,654, itself representing a potential tax increase of.58%. In reviewing other expenses, a significant increase is noted in contracted services. The majority of this increase relates to the Best Start program, that as we understand will be funded 100%..")
10
Best Start Wages & Benefits$ 83,593 Purchase of Goods 30,700 Services & Rents2,703,609 Financial 669 2,818,571 Corporate Costs 26,429 2,845,000 Provincial Funding2,845,000 Net Cost to Municipal taxpayer$ 0

11
Expenditure comparisons (excluding Police)
")
12
The major sources of funding can be segregated into a number of categories including: Taxes Government Grants Other Municipalities Fees and service charges Investment income Licences and permits Fines and penalties Funding Sources

13
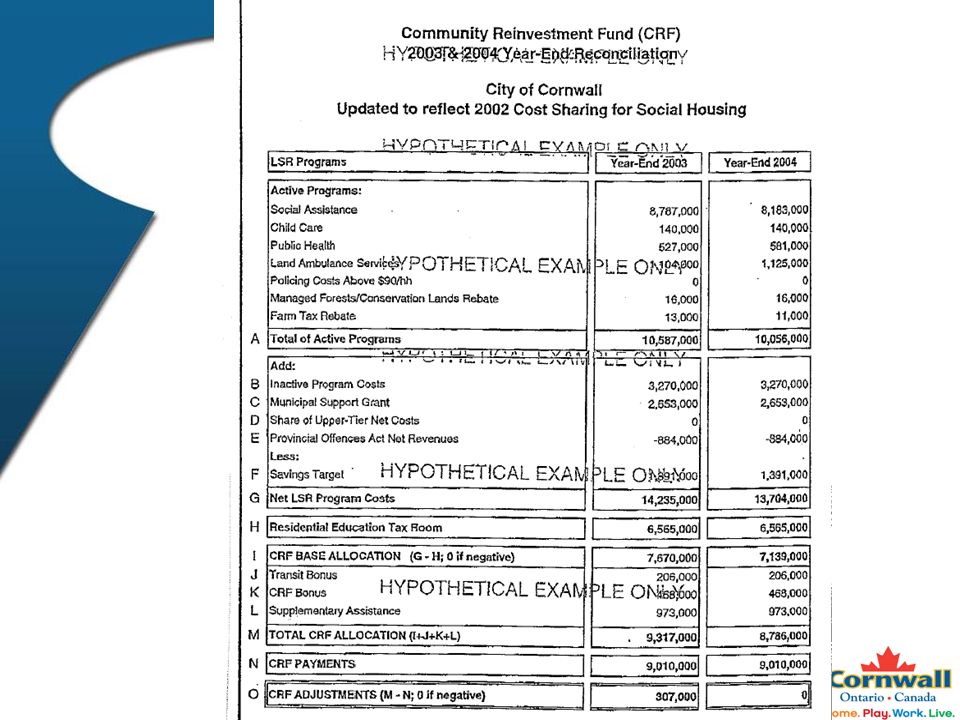
Government grants represent funding provided by the province and federal government. Provincial funding represents the majority of funding typically relating to various social programs. Ministries including Community and Family Services ($23M), Ministry of Health ($7.5M), Ministry of Transport ($150K) and Ministry of Municipal Affairs and Housing ($3.5M) provide funding for specific programming. The Ministry of Finance provides funding relating to downloaded services and replaces the former CRF. The CRF model funded a number of programs including Social Services, Social Housing, Emergency Medical Services (Land Ambulance), Public Health…
, Ministry of Health ($7.5M), Ministry of Transport ($150K) and Ministry of Municipal Affairs and Housing ($3.5M) provide funding for specific programming. The Ministry of Finance provides funding relating to downloaded services and replaces the former CRF. The CRF model funded a number of programs including Social Services, Social Housing, Emergency Medical Services (Land Ambulance), Public Health….")
15
The new funding model is based on cost of delivering social programs (social services and housing) and is related to individual municipal assessment. There does not appear to be a recognition of costs associated with either EMS or a similar costing of Public Health. Previous years budgets allocated a portion of CRF funding to EMS ($871,000) and the Eastern Ontario Health Unit ($497,000). The OMPF format does not appear to provide equalized funding. Is the taxpayer now funding these programs exclusively?
 and the Eastern Ontario Health Unit ($497,000). The OMPF format does not appear to provide equalized funding. Is the taxpayer now funding these programs exclusively .")
16
The 2005 City of Cornwall OMPF allocation is as follows: Social Programs Grant$7,613,906 Equalization Grant Assessment Equalization 4,503,016 Phase-in Adjustment ( limited to $80 per household ) (437,553) $11,679,369 Other Provincial Incentives Projected Public Health Net Benefit 33,237 Provincial Gas Tax 512,937 2005 OMPF Grant $12,225,543
 (437,553) $11,679,369 Other Provincial Incentives Projected Public Health Net Benefit 33,237 Provincial Gas Tax 512, OMPF Grant $12,225,543")
17
Other municipality revenues relate to shared services delivered by the City on behalf of both City and County taxpayers. These services include Social Services, EMS, Social Housing and Glen-Stor-Dun Lodge. The City will be receiving Federal Gas Tax in 2006 in the amount of $1,379,902 representing the full 2006 allocation and the balance from 2005. These funds can be utilized on a number of programs including water, sewer, solid waste, roads and bridges. The government has established specific rules for spending of these funds.

18
2005 tax rate at 2006 assessment 2005 levy at reduced tax rate 2005 tax levy plus taxes associated with new growth resulting in reduced tax rate change in tax rates to finance required expenditures change ratios to alter tax revenue from tax classes The tax levy represents the funding source that Council has complete control over. A number of scenarios can be presented to finance the net required expenditure base. These include:

19
CVA Assessment Growth 9.78% 6.93%1.96% -9.8%

20
New Growth 1.21%.02%.41% -3.46% (000’s)
")
21
2005 tax rates @ 2006 assessment $50,262,861

22
2005 tax levy $47,355,198

23
2005 tax levy 1,130 36 -437 -719Change $47,355,198 (000’s)
")
24
2005 tax levy Although the overall tax rate decreases by approximately 5.8%, to generate the same level of tax revenue, not all taxpayers will see a consistent tax bill. Because of the weighting of the assessment base a significant shift to the residential class will occur with a 5.8% tax rate reduction. If Council were to agree a 0% strategy as discussed, 3,230 residential tax payers would either remain the same or actually have a tax reduction whereas, 10,968 residential ratepayers would still see an increase in taxes. $47,355,198

25
2005 levy plus new growth $47,685,198

26
2005 levy plus new growth 1,305 68-342 -695 Change $47,685,198 (000’s)
")
27
Tax ratios The province has established a set of acceptable ratios for the various tax classes. Without specific overriding legislation, municipalities must move toward the range of fairness. The province will not allow an increase in respective ratios, thus mitigating the opportunity to pass on residential increases to other classes. The threshold ratios and comparative City ratios are as follows:

28
Ratios

29
Relative growth levels with our comparable communities

30
Education Rates A major component of the tax levy relates to the education portion of the tax bill. Rates are determined by the province and are consistent throughout the province for the residential and multi-residential classes. The rates for commercial and industrial vary significantly. The range for the commercial class varies from a low of 1.0155% to a high of 2.6417%. Similarly, the range for the industrial class varies from 1.745% to 3.4809%. The commercial rate for the City presently stands at 2.4709% (3rd highest in study) and the industrial rate is 2.9490% (21st in the study). We have annually attempted to persuade the province to implement a standard rate across the province for all classes.
 and the industrial rate is % (21st in the study). We have annually attempted to persuade the province to implement a standard rate across the province for all classes..")
31
We have had a number of discussions over the past years with the Ministry of Finance requesting a standard education rate. Using 2005 assessment and rates taxpayers would have benefited as follows: The total savings would be: (median across the survey) Commercial$3,073,163 (29.50%) Industrial$ 416,360 (17.28%) The total savings would be: (ave. across the survey) Commercial$2,580,748 (24.77%) Industrial$ 360,817 (14.94%)
 Commercial$3,073,163 (29.50%) Industrial$ 416,360 (17.28%) The total savings would be: (ave. across the survey) Commercial$2,580,748 (24.77%) Industrial$ 360,817 (14.94%).")
32
Total taxes on $100,000 assessment $612 $440 Savings with standardized rates

34
Ajax Aurora Barrie Belleville Brampton Brantford Burlington Caledon Cambridge Chatham-Kent Clarington Cobourg Cornwall East Gwillimbury Fort Erie Georgina Grimsby Guelph Halton Hills Hamilton Innisfil Kawartha Lakes King Kingston Kitchener Lakeshore Leamington Lincoln London Markham Windsor Milton Mississauga Newmarket Niagara Falls Niagara-on-the-Lake Norfolk North Bay Oakville Orangeville Oshawa Ottawa Pelham Peterborough Pickering Port Colborne Prince Edward County Richmond Hill Sarnia Sault Ste. Marie St. Catharines St. Thomas Stratford Sudbury Thorold Thunder Bay Timmins Toronto Uxbridge Vaughan Wainfleet Wasaga Beach Waterloo Welland West Lincoln Whitby Whitchurch-Stouffville

35
Net Levy per Capita

36
Taxes as a % of income

37
The total budgeted requests in 2006 exceed $145 million of which approximately $109 million is not under the direct control or authority of Council. Identified non-controllable departments include: Fire, Police, Social Services, Social Housing, Emergency Medical Services, Emergency Management, Winter Control, Solid Waste Management, Water, Sewer and certain outside agencies including Raisin Region Conservation Authority and the Eastern Ontario Health Unit. It is important to remember that any expenditure reductions (operational) typically have to be borne by those departments under full control of Council. For example, if Council were to request a reduction in total expenditures of $4 million, (3%), many of the above noted departments and agencies are restricted in their ability to reduce either expenditures or service levels. The $4 million would have to be deducted from the remaining 25% of expenditures resulting in a decrease of 11% against those departments.
 typically have to be borne by those departments under full control of Council. For example, if Council were to request a reduction in total expenditures of $4 million, (3%), many of the above noted departments and agencies are restricted in their ability to reduce either expenditures or service levels. The $4 million would have to be deducted from the remaining 25% of expenditures resulting in a decrease of 11% against those departments..")
38
Controllable vs non-controllable

39
Fire expenditures per capita

40
Net Policing cost per capita and per household

41
SSS net expenditure per capita

42
EMS services per capita

43
Roadway cost per capita

44
Assistance to aged per capita

45
City of Cornwall Review of specific departments

46
Protective Services Police (not included in 2006 budget document) Fire Services Emergency Medical Services Emergency Management The City has little control over the level of spending in these departments. (Wages and benefits represent 80.11% of total expenditures) City council has accepted fire marshal recommendations and have staffed the department to accommodate 14ff on each shift to ensure 10ff would be on scene. Similarly, the majority of EMS bases are staffed for 24 hour service.
 City council has accepted fire marshal recommendations and have staffed the department to accommodate 14ff on each shift to ensure 10ff would be on scene. Similarly, the majority of EMS bases are staffed for 24 hour service..")
47
Protective Services (excludes Police) (000’s)
 (000’s)")
48
Emergency Medical Services The City became the delivery agent for this service in 2000. At time of takeover, Provincial records indicated the service cost approximately $2.8M with 50% to come from the province. Standards have changed dramatically since that time resulting in a significant change to costs. Total budgeted expenditures for 2006$8,877,204 Ministry of Health Funding 2,968,282 33.4% CRF allocation in 2005$ 871,000 OMPF allocation in 2006 0 The net expenditure increase in 2006 $ 1,191,571 Tax rate increase required to support 2.51%

49
Social Support Services This is another department that allows limited opportunity for council to eliminate services or reduce costs. The Province mandates certain services and provides funding at varying levels from 50% to 100%. Permissive programs can be adjusted, however review of these programs in past years have provided limited savings due to the level of provincial and County funding. The net expenditure increase in 2006$754,793 Tax rate increase required to support 1.6%

50
Social Support Services

51
Glen Stor Dun Lodge The Lodge is now 10 years old and is requiring some renovations to a variety of areas including flooring, furniture and some exterior work. Standards of care are imposed by the province and funding is related to the level of care required for the residents. The net expenditure increase in 2006 $461,177 Tax rate increase required to support.98% Net costs are shared with the Counties on a 75:25 basis.

52
Glen-Stor-Dun Lodge

53
Social Housing Social Housing was downloaded to the City in 2000 based on a business plan submitted to the Province. The housing stock was aging at the date of transfer with the province providing a funding formula for capital that was less then the average spent over previous years when the service was managed by themselves. The housing stock requires significant maintenance exceeding previous capital allotment. The net expenditure increase in 2006 $422,603 Tax rate increase required to support.89%

54
Social Housing

55
Outside Agencies A number of outside agencies (non-city related) provide mandatory programming and are outside the ability of council to influence either the service level or funding requirements. Total funding requests from all outside agencies approximate $3.5M in gross expenditures.Of these requests, $1.2Mrelating to EOHU and RRCA cannot be altered by council under any circumstance. The tax rate alone for these two agencies is 2.6%. Council, if they so choose could eliminate funding to the other agencies.

56
Outside Agencies

57
Capital Total capital requested$ 10,500,000 Sewer surcharge$1,950,000 Sewer reserves 500,000 Waterworks 2,700,000 County re shared services 114,000 Other 137,000 Progress fund 960,000 General reserves 583,000 6,944,000 Tax Base$ 3,556,000

58
Capital Requests - Roadways Intersections$ 115 Asphalt resurfacing 1,500 1 st street parking lot 180 Sidewalks 235 Other 135

59
Capital Requests –Solid Waste Optimist Park$ 75 Gas Collection System 200

60
Capital Requests –Sewer Collection Eamers Corners$ 775 Cumberland 7 th – 9 th 500 Sydney 8 th – 9 th 190

61
Capital Requests – Wastewater Treatment Digester cleanout$ 200 WWTP upgrades 500 Others 185 Asset management 100

62
Capital Requests –Water Distribution $ 600 WPP Upgrade 1,200 General Improvements 225 Asset management 100 Meters 75 Cumberland 7 th – 9 th 500

63
Capital Requests –Recreational facilities HVAC - Complex$1,300 Roof – Complex 560

64
Capital Requests – EMS Ambulance replacement$240 Fuel injection system 60

65
Capital Requests – GSDL Building repairs$225 Flooring 175 Furniture 55

66
Capital Requests – other Transit Generator $45 Fire #2 Generator52 Skateboard Park80 Park & Furniture Replacement82 Fire Pre-emption System36

67
Water/Sewer To provide adequate supply of potable water for public consumption and fire protection. To efficiently operate the waste water treatment plant and maintain the sanitary system, combined sewer systems storm sewers. Water and sewer billings billed twice yearly Self supporting

68
Water/sewer per household

69
Sewer $761,117 year over year increase

70
Water $13,708 increase

71
Average Water/Sewer billings per household

72
Total municipal burden

73
Reserves and Reserve Funds at Sep 30, 2005 Working reserves (unrestricted)$ 4,055,493 Working reserves (restricted) 1,600,544 Stable Funding reserve 3,469,164 Reserve Funds 1,691,171 Progress Fund 25,418,889 Debt Retirement Fund 2,966,119 $39,201,380
$ 4,055,493 Working reserves (restricted) 1,600,544 Stable Funding reserve 3,469,164 Reserve Funds 1,691,171 Progress Fund 25,418,889 Debt Retirement Fund 2,966,119 $39,201,380")
74
Progress Fund Balance Sept 30, 2005 $25,418,889 Estimated investment income to Dec 31, 2005 206,412 Commitments (490,907) Project balance Dec 31, 2005 $25,134,394 Projected earnings in 2006 800,000 Request in 2006 budget (960,000) Projected balance Dec 31, 2006 $24,974,394
 Project balance Dec 31, 2005 $25,134,394 Projected earnings in ,000 Request in 2006 budget (960,000) Projected balance Dec 31, 2006 $24,974,394")
Similar presentations
 January 22 nd, 2007.>")


 Financial Management.>")


, plus ($1,094,808) in State pass throughs. State Aid allocation.>")

