Download presentation
Presentation is loading. Please wait.

1
The 1% and the 99% J. F. O’Connor

2
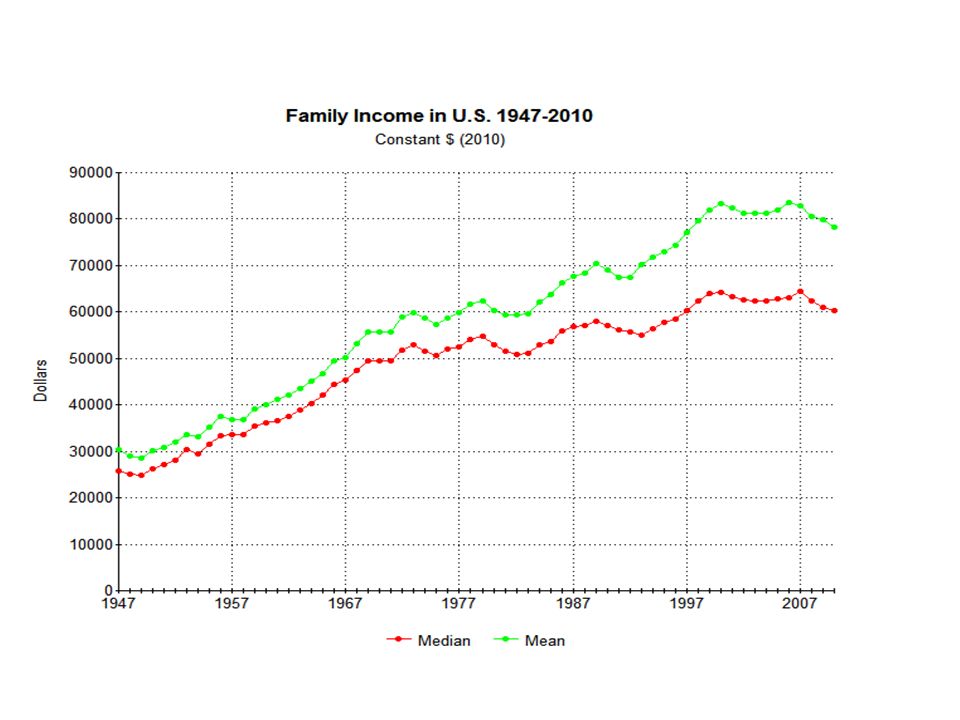
Distribution of family income in the U.S. Current distribution How has it changed over the years? Why has it changed? Why does it matter?

3
Some Preliminaries Income versus wealth – Wealth is the value of what you own minus what you owe. – Income consists of earned and unearned income Labor or earned income consists of wage, salaries, and proprietor’s income (75%) Capital income consists of dividends, interest, rent, and (capital gains) Transfer payments – social security, pensions, TANF
 Capital income consists of dividends, interest, rent, and (capital gains) Transfer payments – social security, pensions, TANF.")
4
Median Family Income Income of the typical family – 50% of families above the median and 50% below US 2010 ? Kentucky 2010 ? Madison County 2010 ?

7
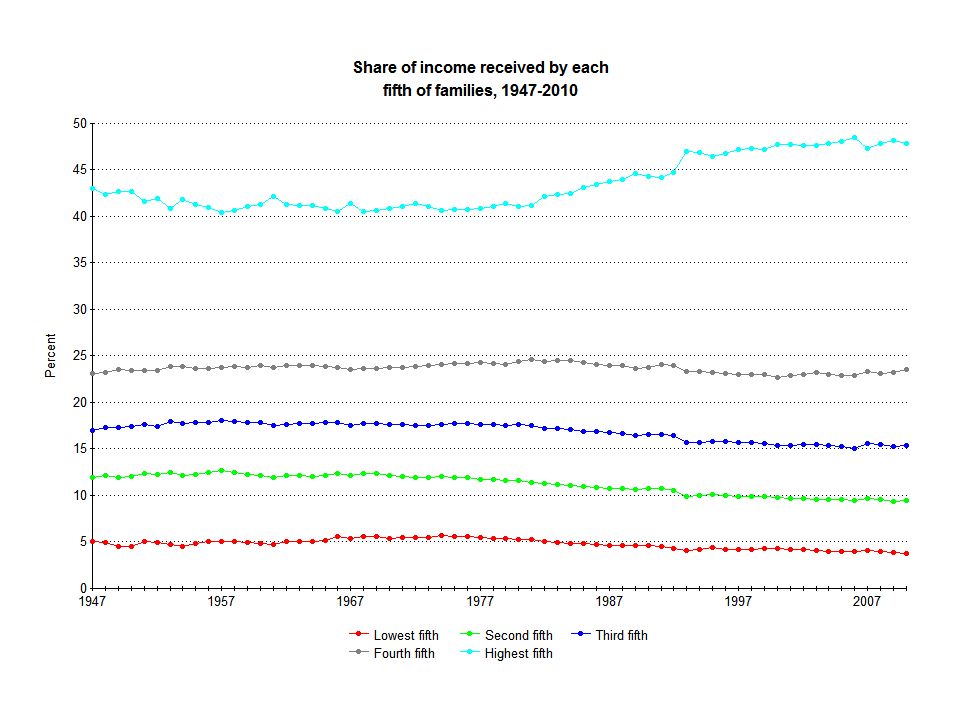
How to Assess Inequality Economists compare economies on basis of both efficiency and equity (fairness). Distribution of income is a major indicator of the fairness of the outcome of an economic system. (Equality of Opportunity is another) Common method is to look at the quintiles of the distribution. How much of total income goes to bottom 20%, next 20%, et cetera
 Common method is to look at the quintiles of the distribution. How much of total income goes to bottom 20%, next 20%, et cetera.")
11
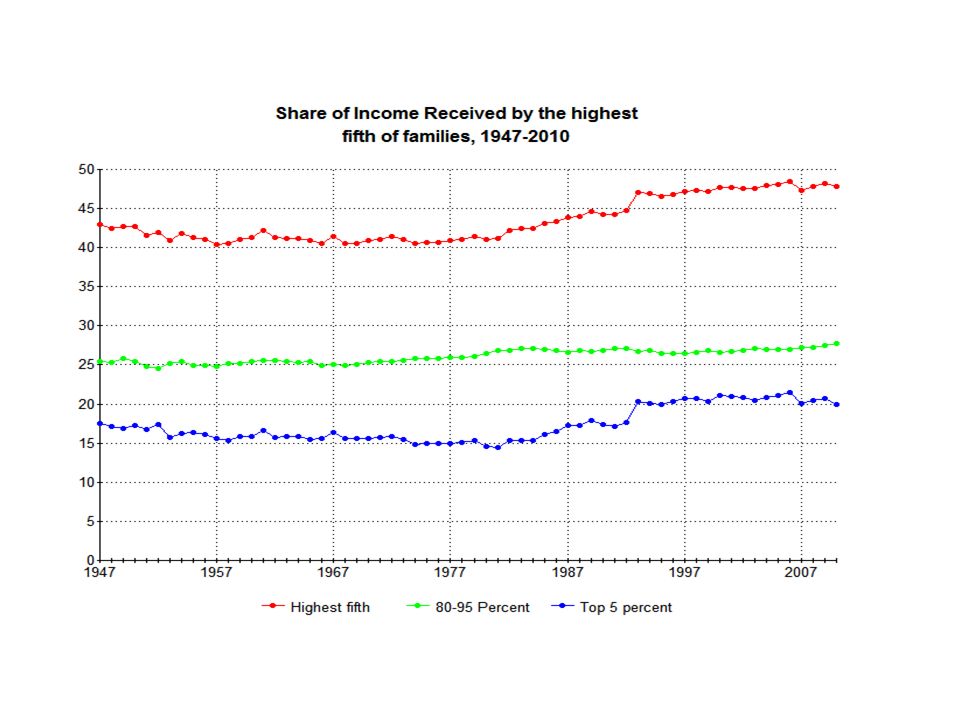
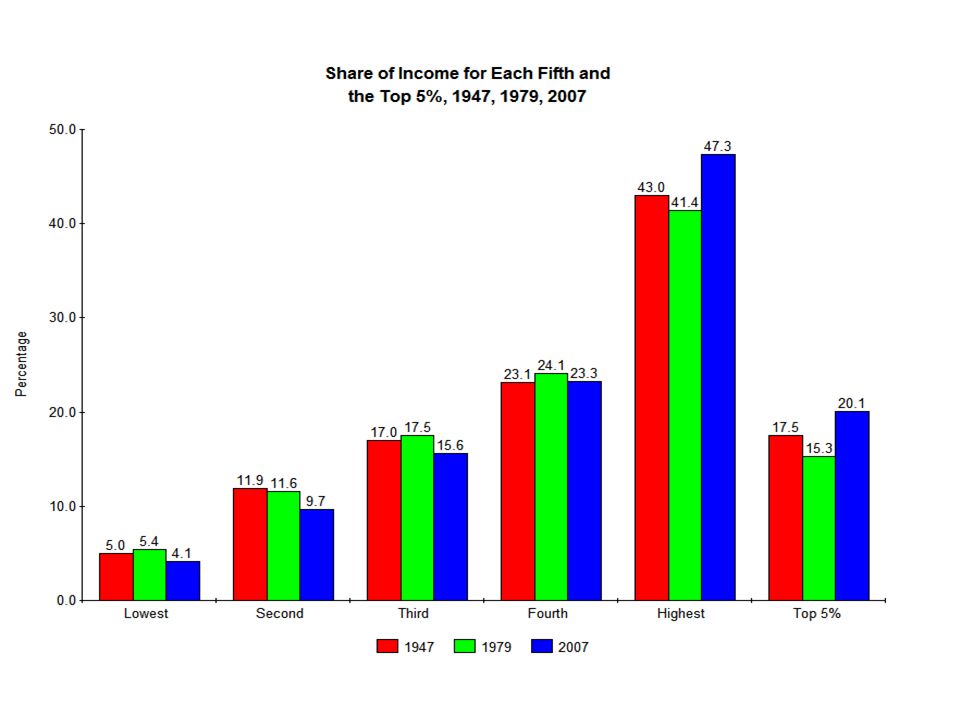
Quintiles and Top 5%

15
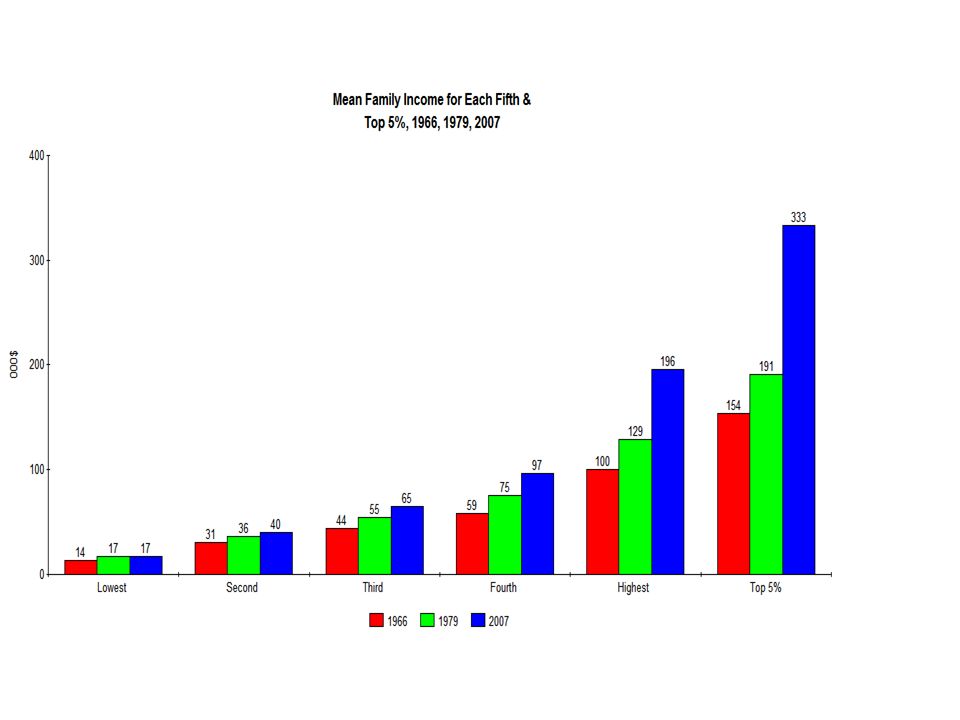
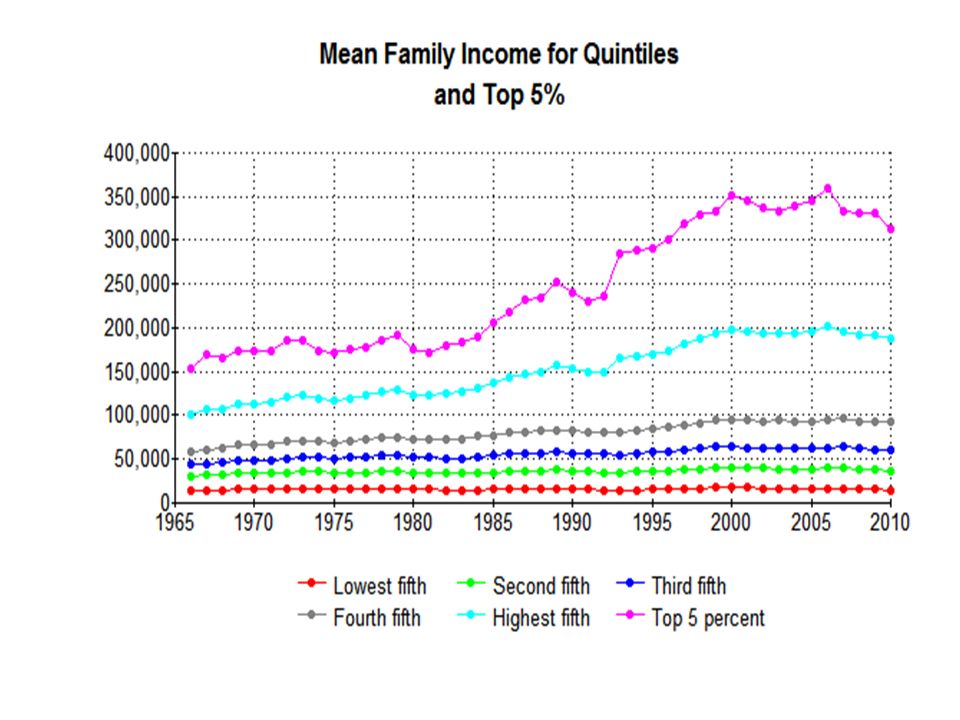
Mean Income for Quintiles and Top 5%

17
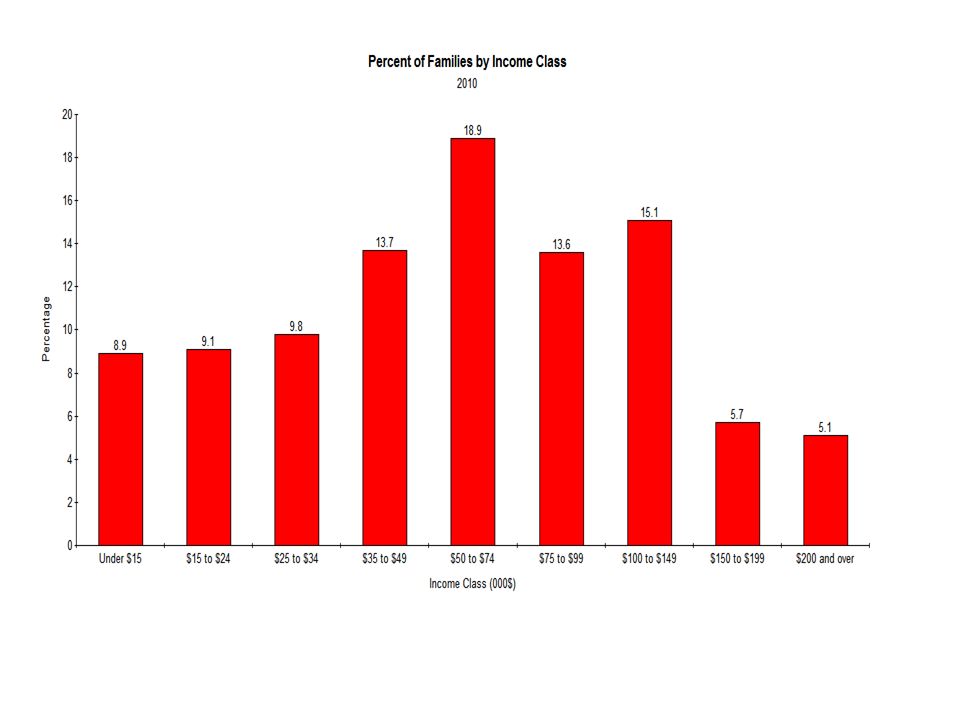
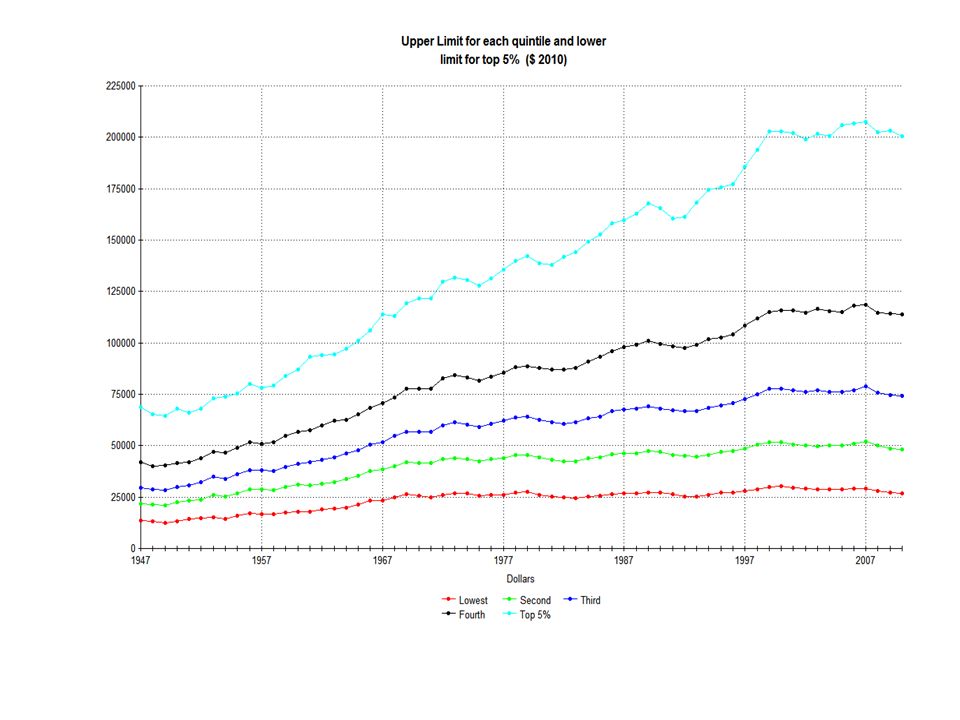
Quintile Limits in 2010 (000$) Class Limits Class mean Lowest fifth 0 – 27 15 Second Fifth 27 – 48 37 Third fifth 48 -- 74 60 Fourth fifth 74 – 137 92 Highest fifth 137 - 200 187 Top 5% 200 - 313
 Class Limits Class mean Lowest fifth 0 – Second Fifth 27 – Third fifth Fourth fifth 74 – Highest fifth Top 5%")
18
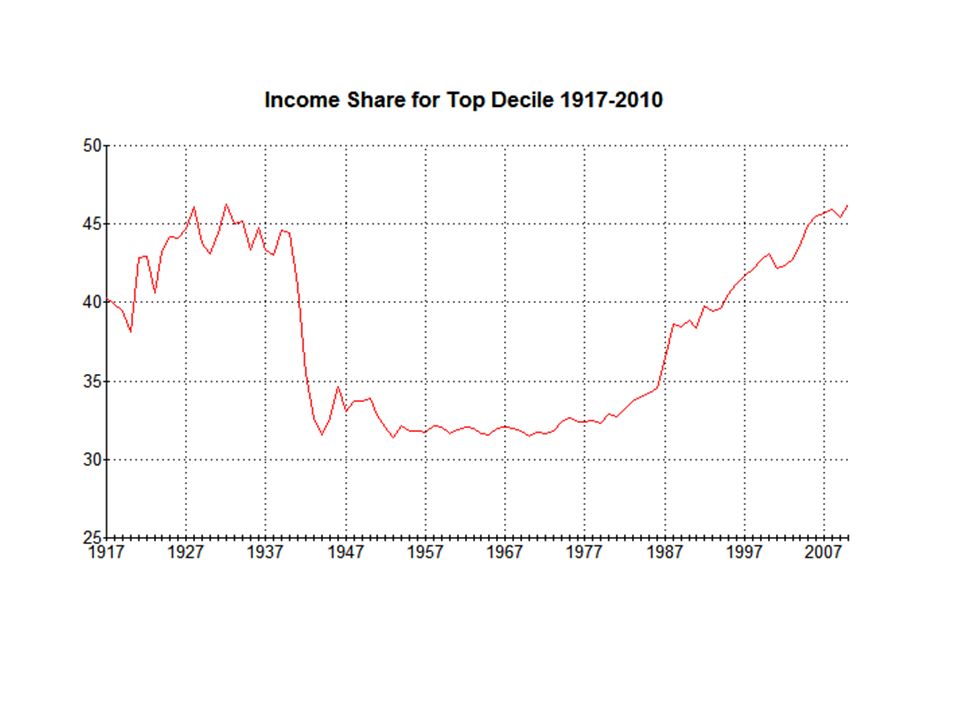
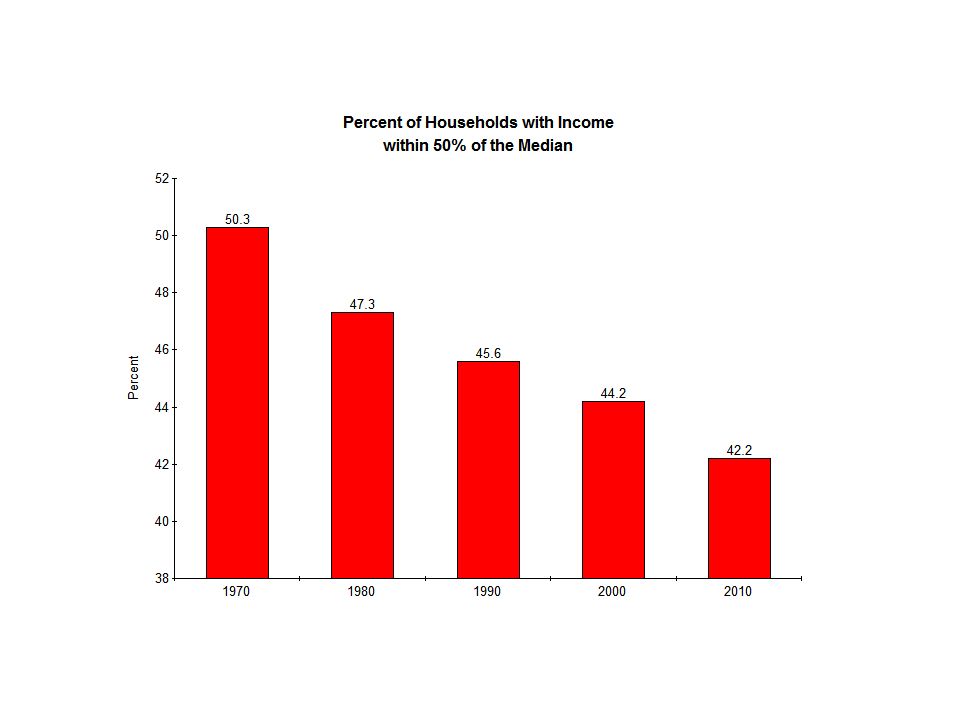
Conclusions so far? Distribution of family income in the U.S. has become more unequal from 1980 onward, after being fairly stable in the years 1947-79. Percentage of total family income going to top 20% families increased from 41.4% to 47.3%. Most of that gain went to the top 5% (4.8 out of 5.9). The average incomes of the families in the three lowest quintiles have been stagnant since 1979. From 1979 to 2007, average income for the top fifth increased by 50% and by 75% for the top 5%.
. The average incomes of the families in the three lowest quintiles have been stagnant since From 1979 to 2007, average income for the top fifth increased by 50% and by 75% for the top 5%..")
19
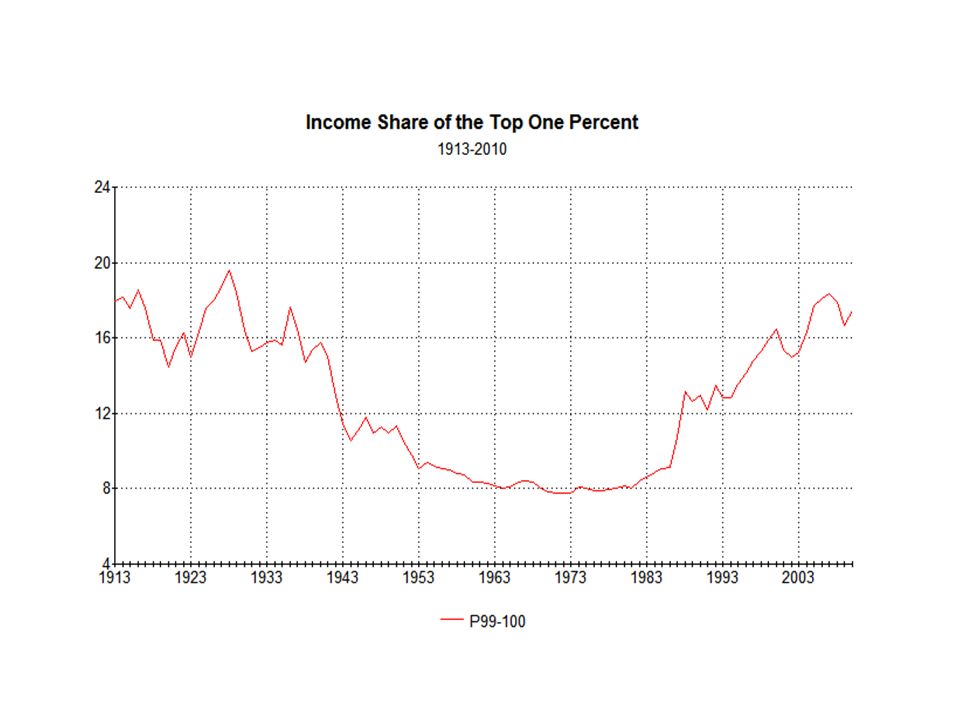
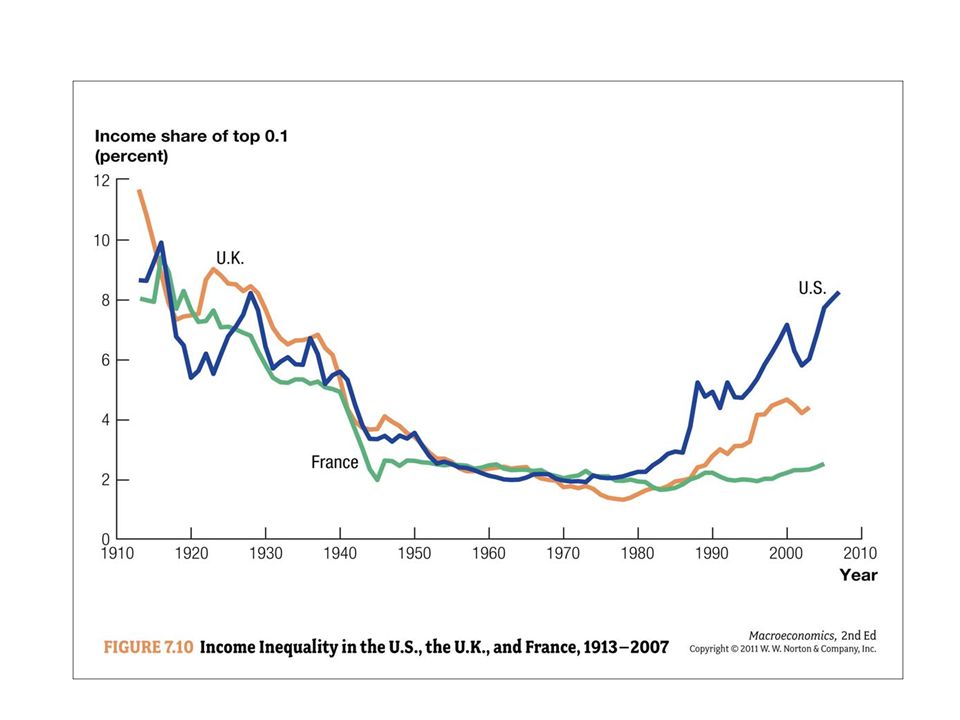
Where is the 1%? We need to switch to a different data set to get there. IRS data and it gives market income.

24
Explaining Increased Inequality of Income in 1979-2010 Key is this development is an outcome of the workings of a market economy and the changes are occurring in the labor market. Proportion of output going to labor and capital has remained relatively constant at 2/3 and 1/3. Two kinds of persons in the labor market – wage and salary employees and proprietors

25
Causes? Skill-biased technological advance, Globalization, immigration Minimum wage, and decline of unions Failure of educational system Politics Gender, race, family structure Changing norms regarding rewards – winner take all markets, CEO pay,

26
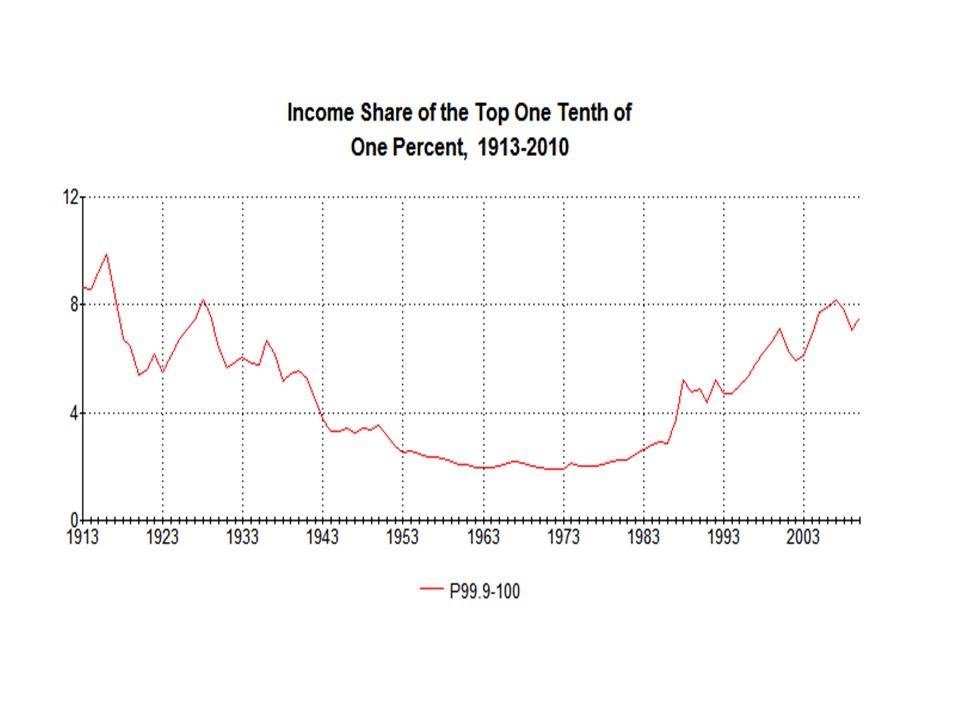
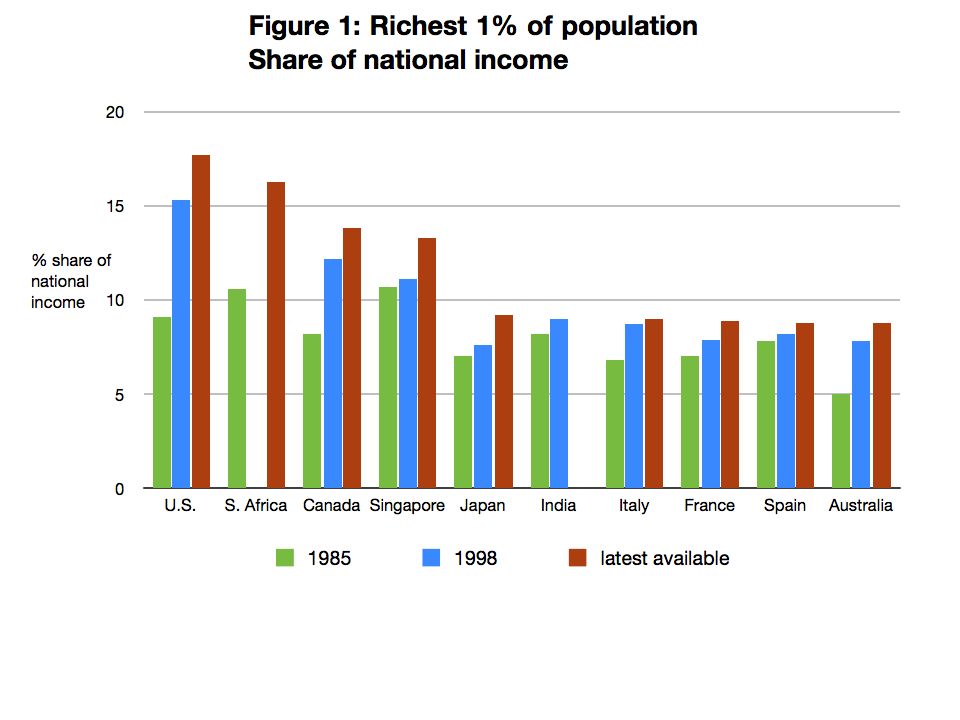
The Layers of Richness! Category Annual Income Somewhat Rich – top10% $100,000 + Rich - Top 1% $370,000 + Super Rich – Top.1% $1,000,000 +

27
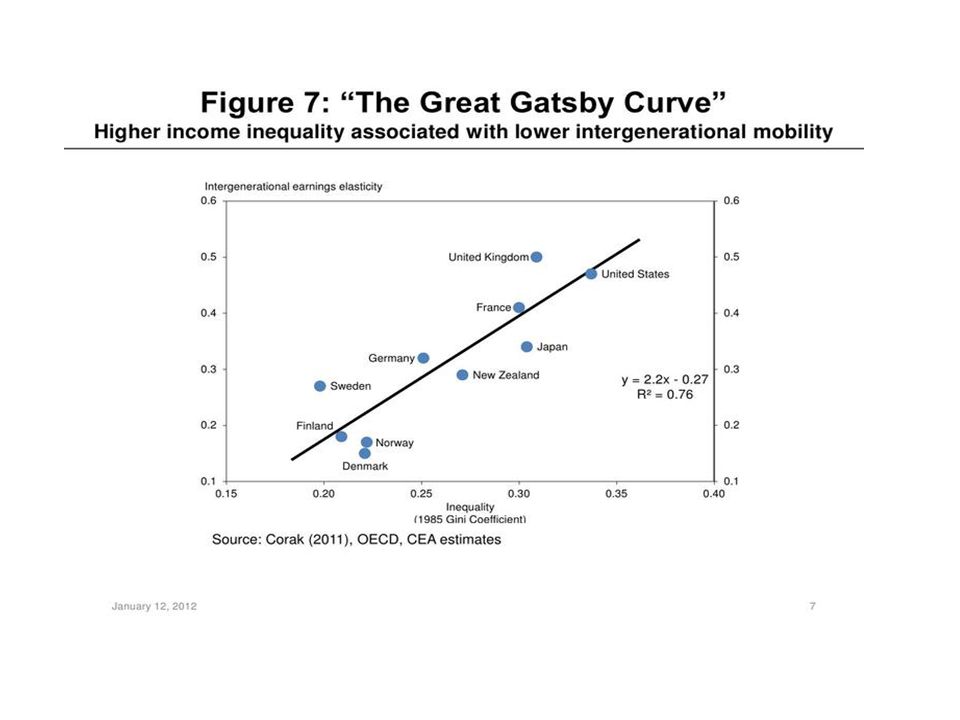
Implications? Transfer of income to the 1%, a trillion dollars a year! Creating a new Gilded Age Hollowing out of middle class Inter-generational mobility – equality of opportunity Macroeconomic effects?

30
Rights of Workers A just wage. The right to rest. Safe working environment ( physical health or moral integrity). Unemployment insurance A pension and insurance for old age, sickness, and in case of work-related accidents. Social security connected with maternity. Assemble and form associations
. Unemployment insurance A pension and insurance for old age, sickness, and in case of work-related accidents. Social security connected with maternity. Assemble and form associations.")
Similar presentations