Download presentation
Presentation is loading. Please wait.

1
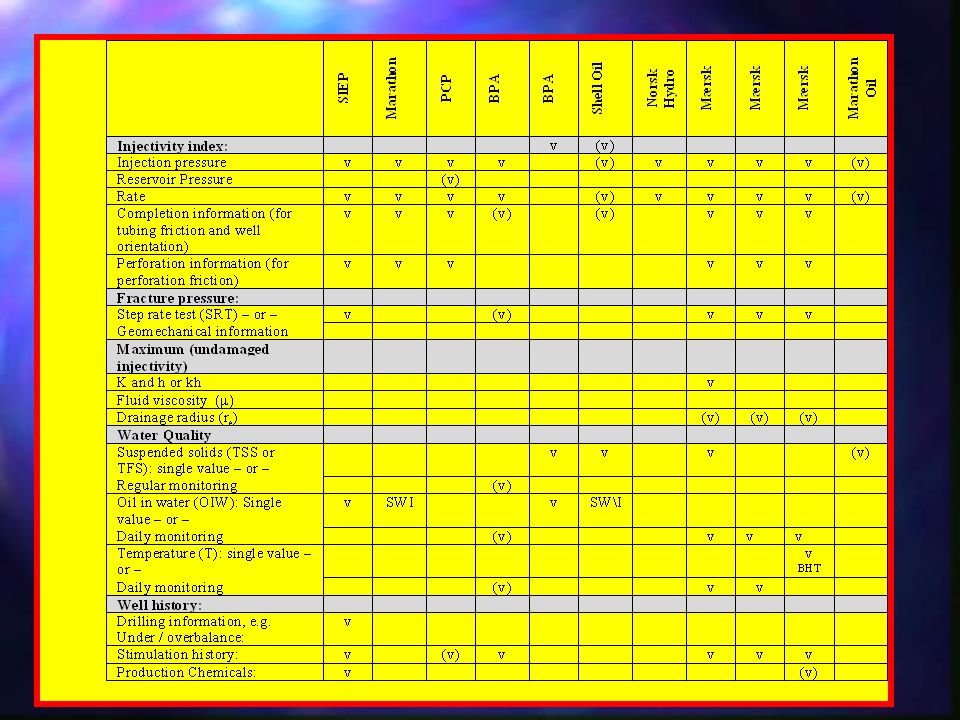
Stimulation (Audit) n General Review of Stimulation. –First draft on March 24, general stimulation techniques, not specific for PWRI n Review of Damage Mechanisms. n Perkins & Gonzalez Model –Excel spreadsheet tool, very unstable. n Injection Data Analysis Tool –BHP standard.xls.

2
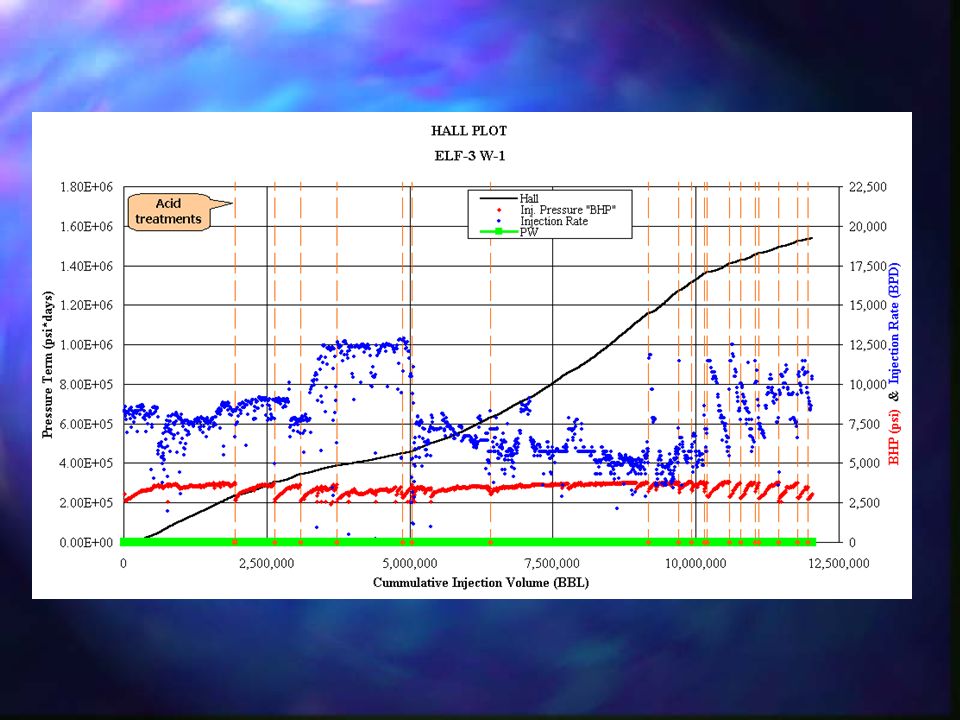
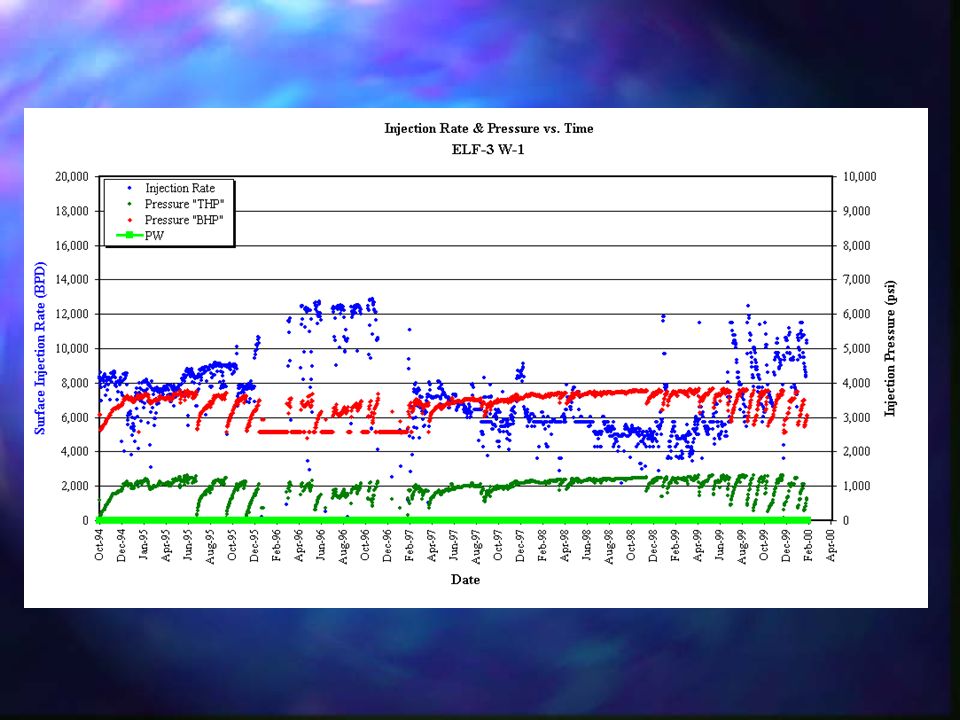
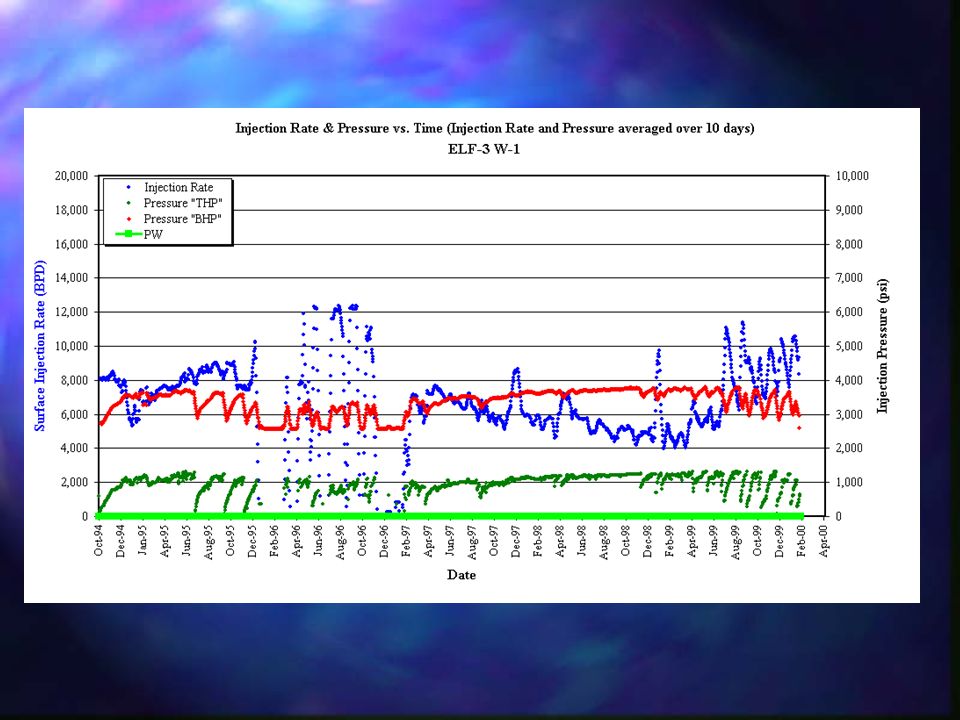
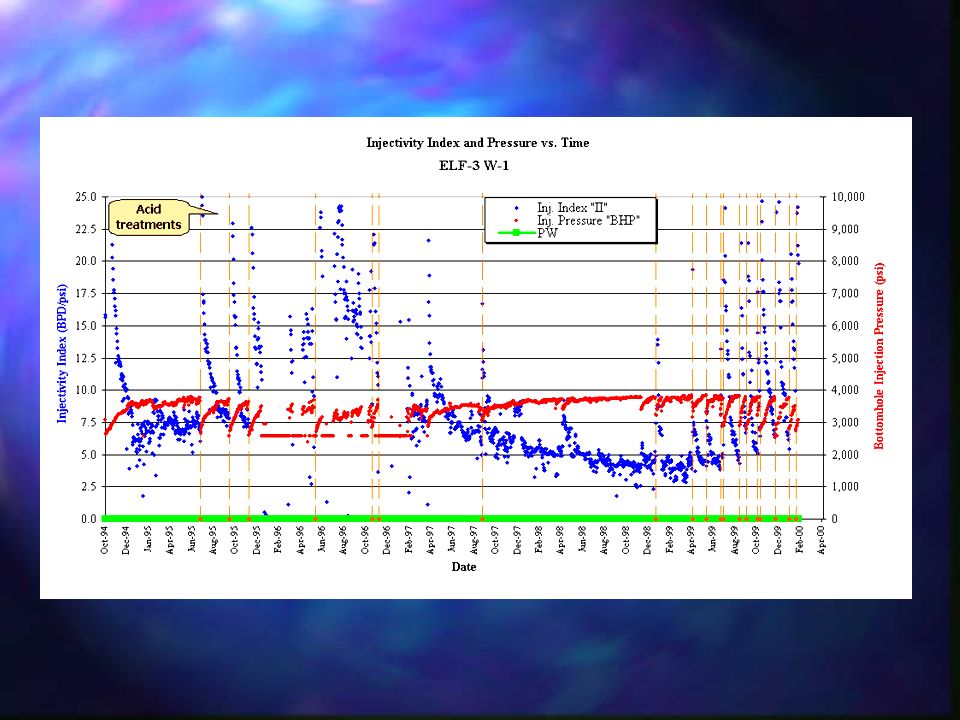
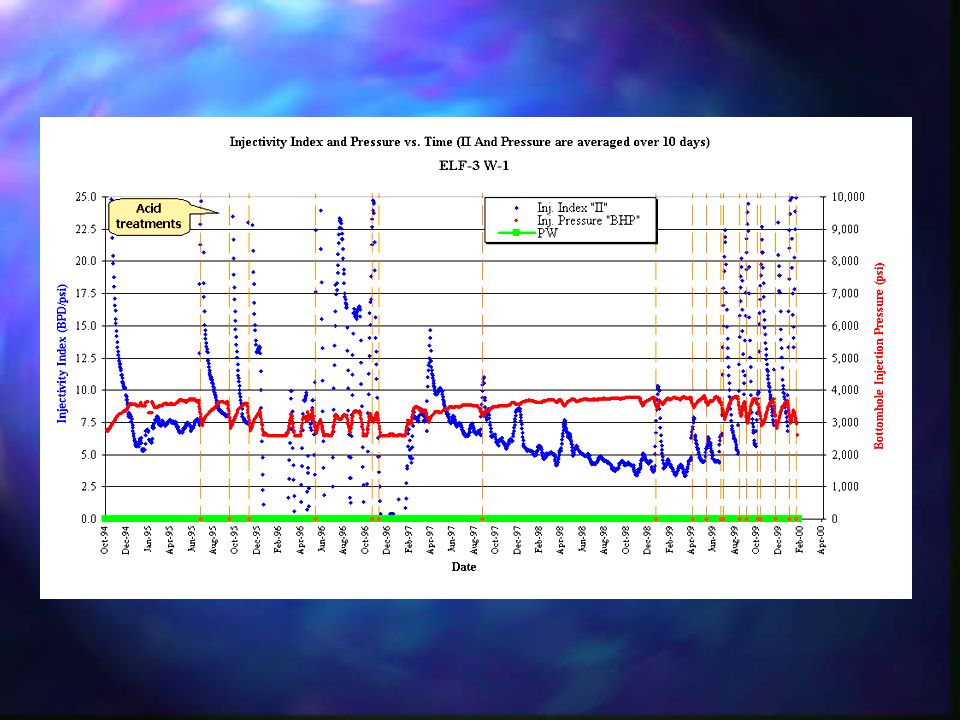
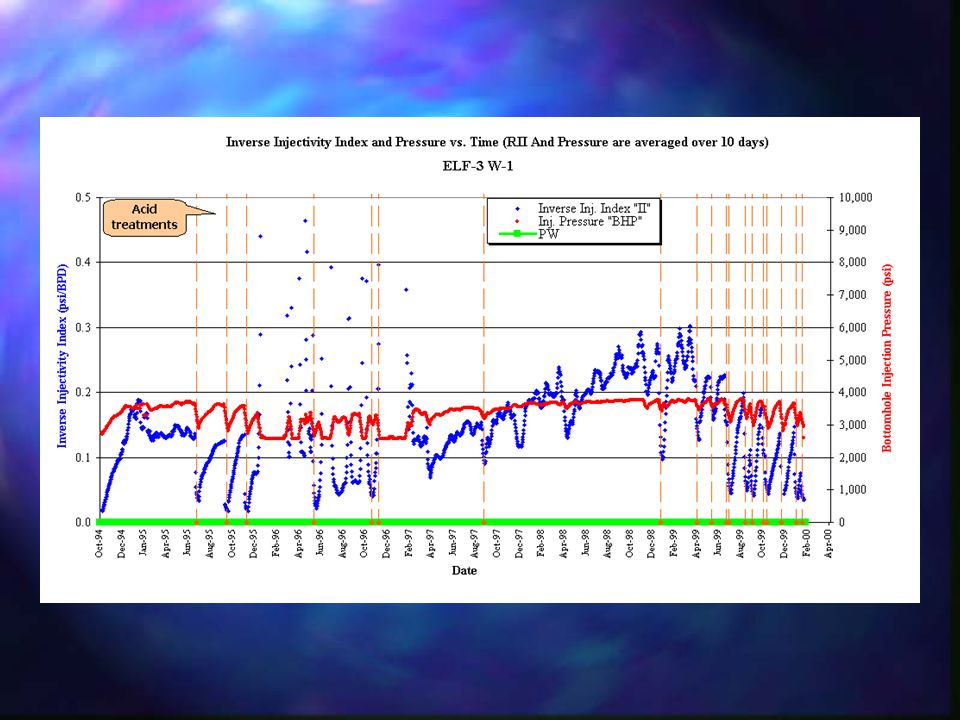
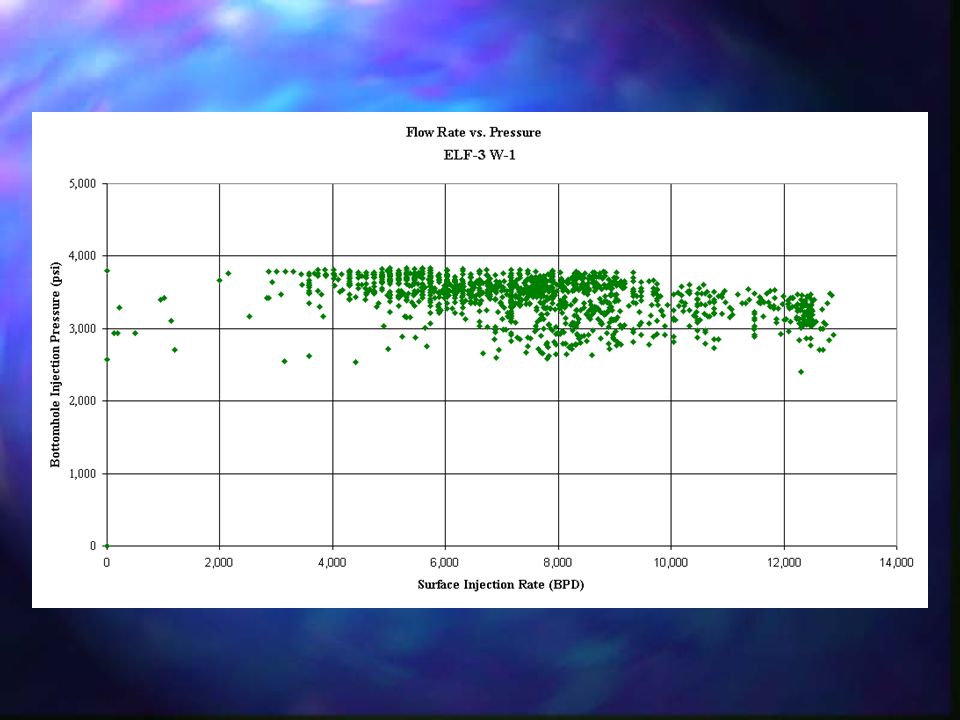
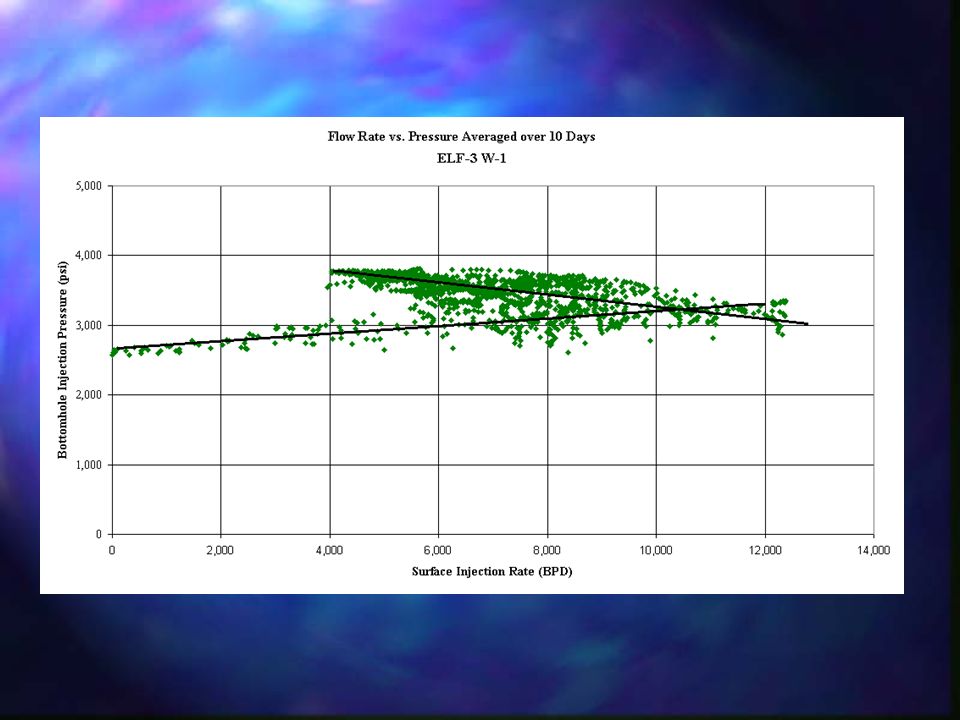
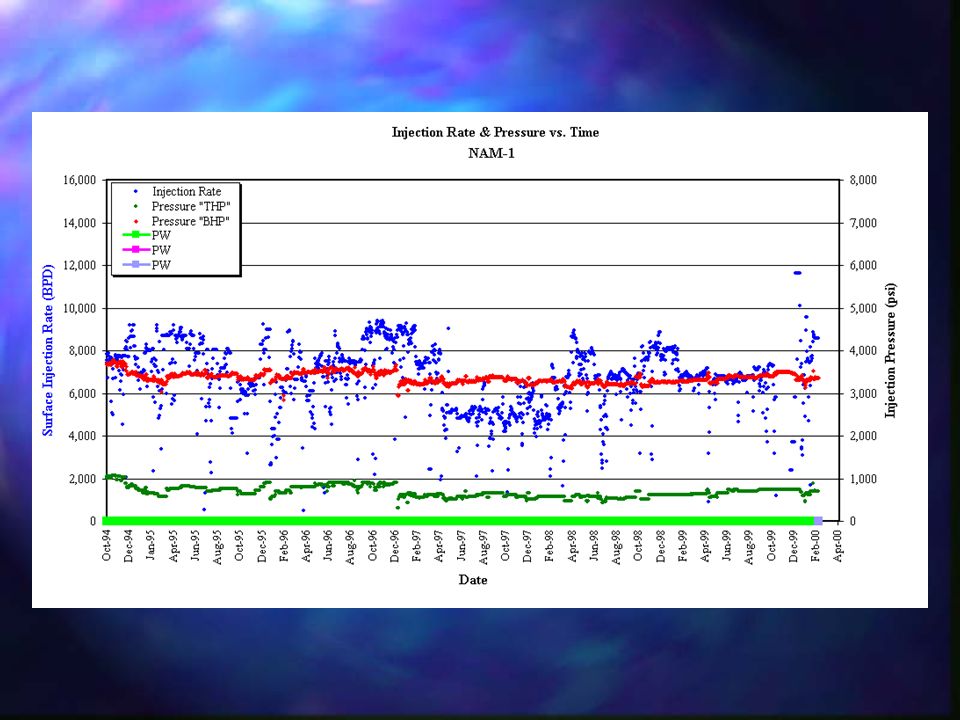
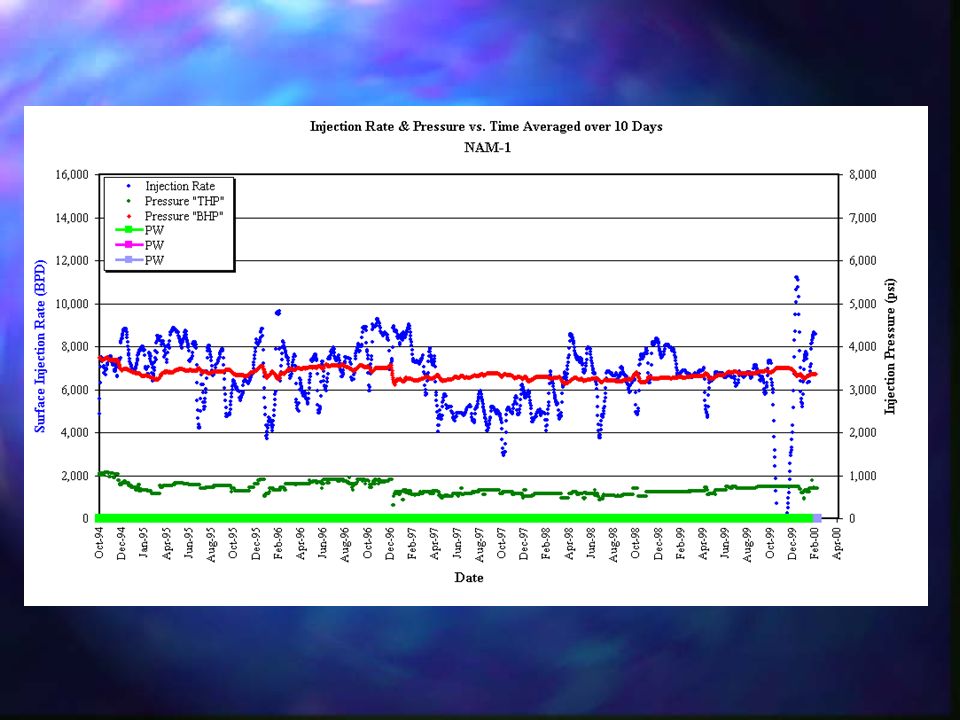
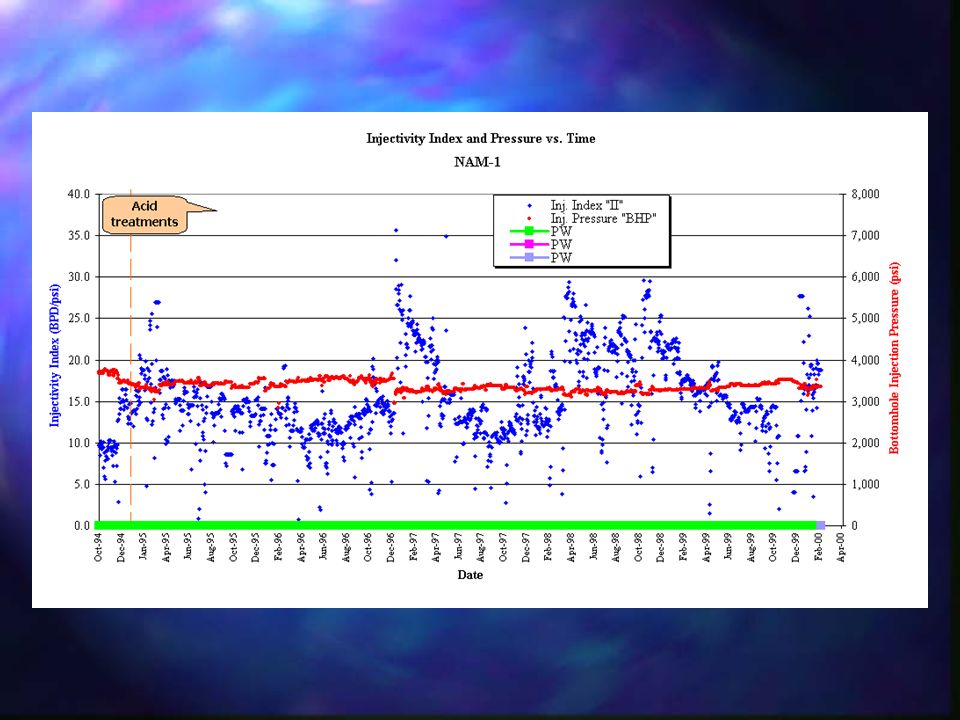
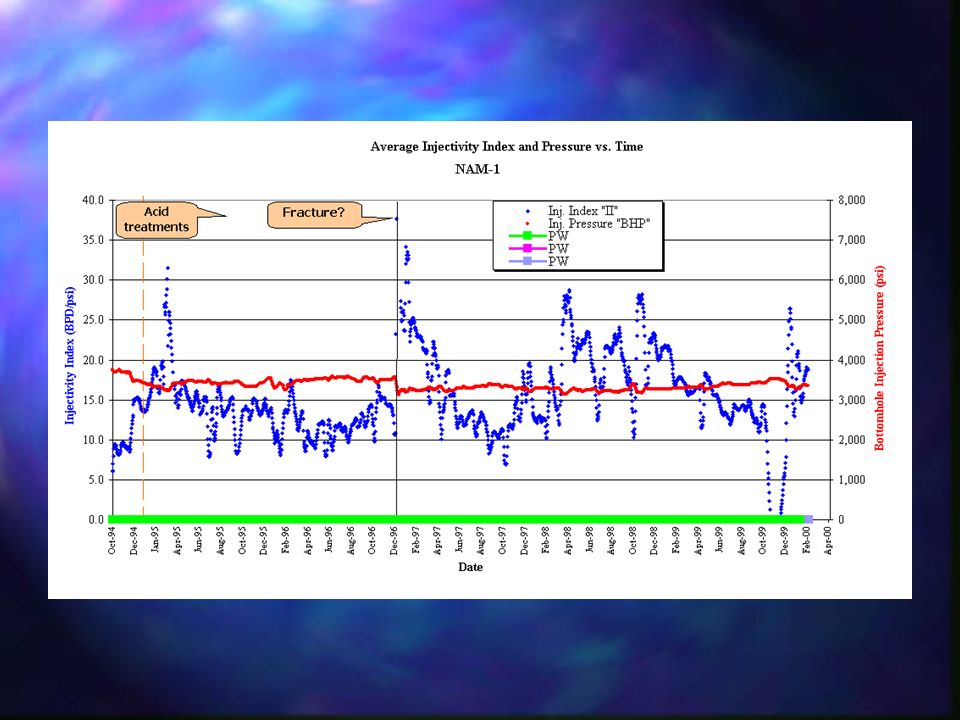
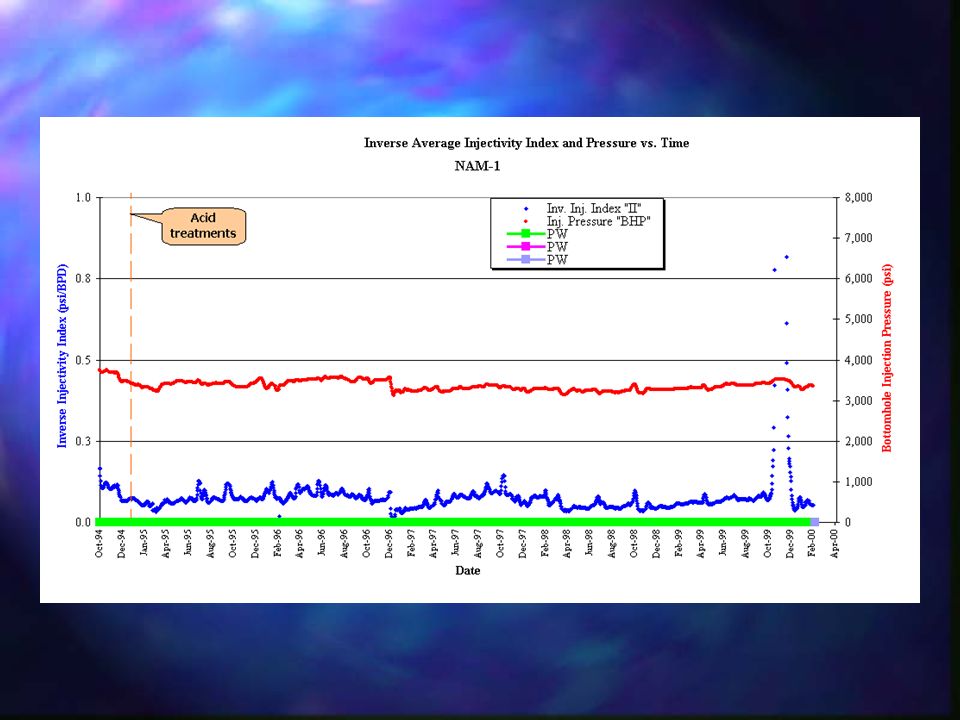
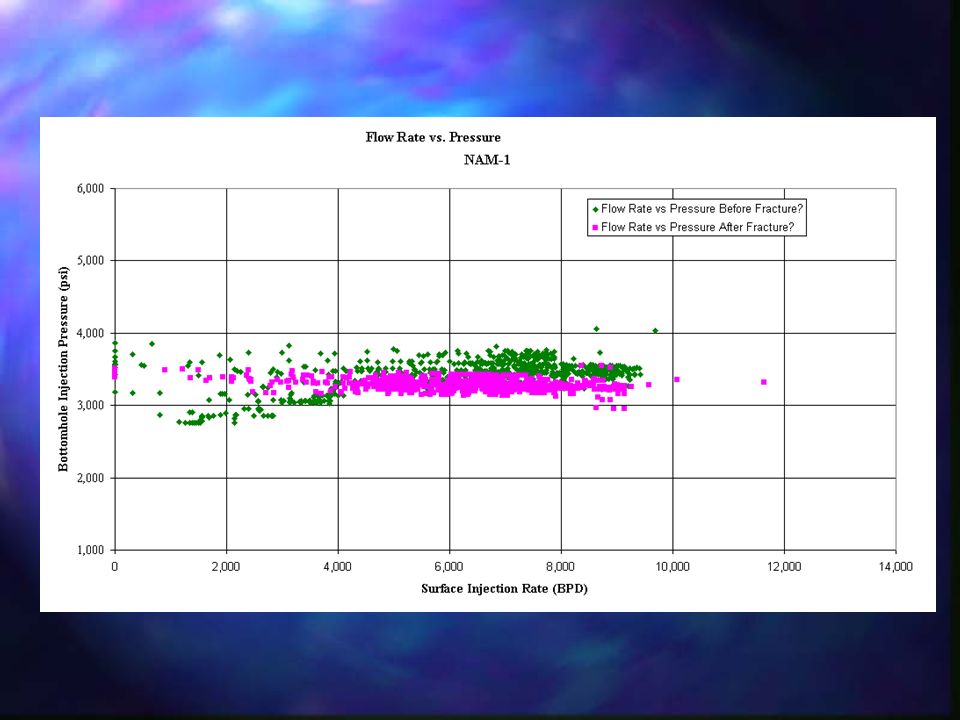
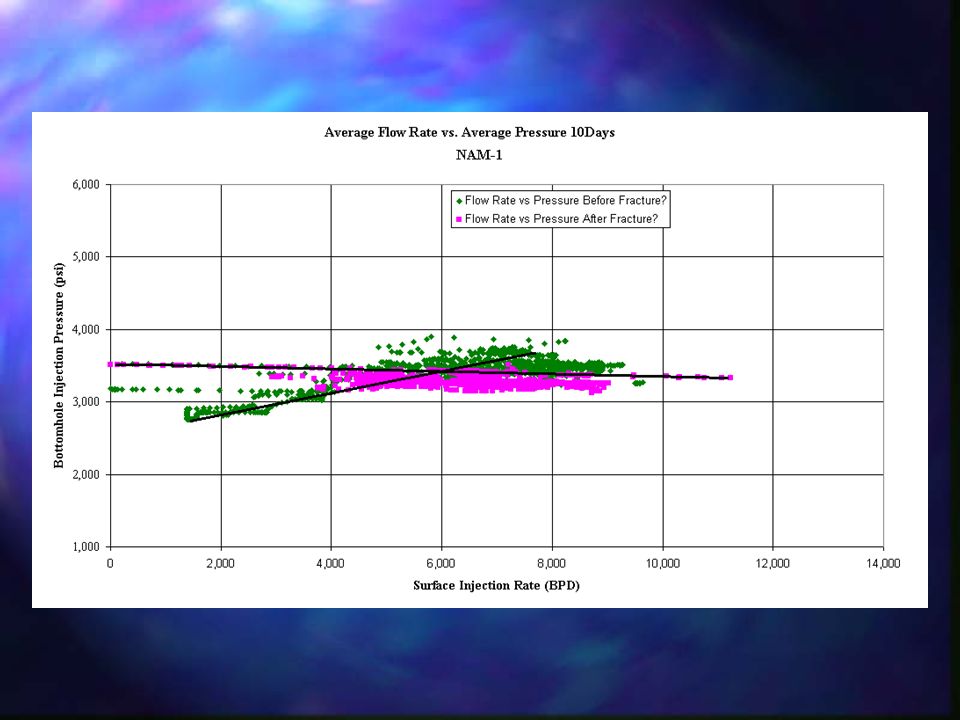
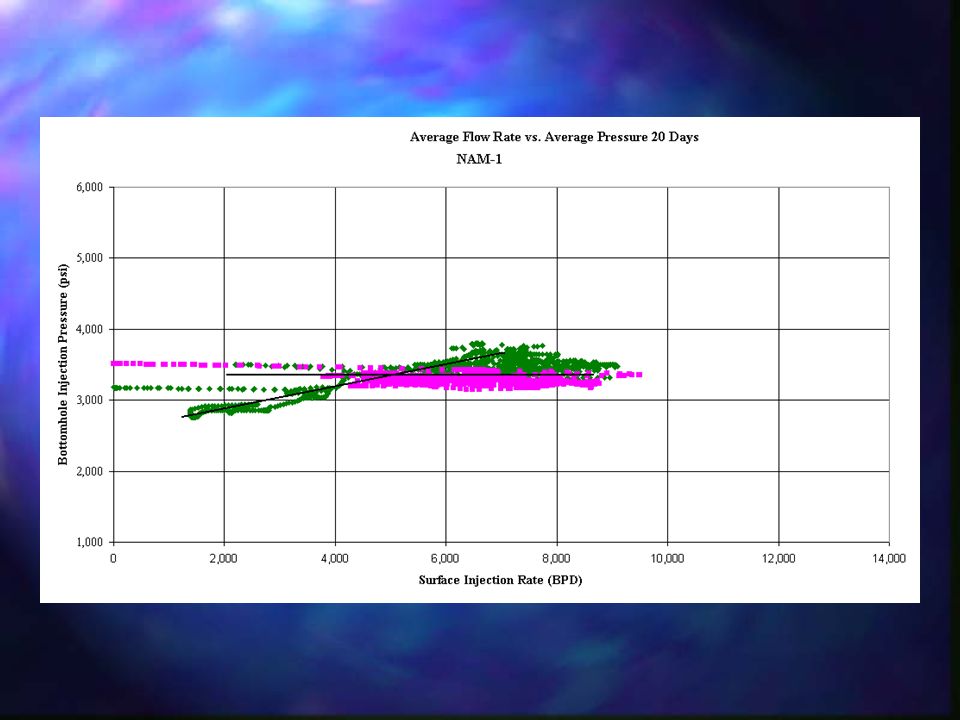
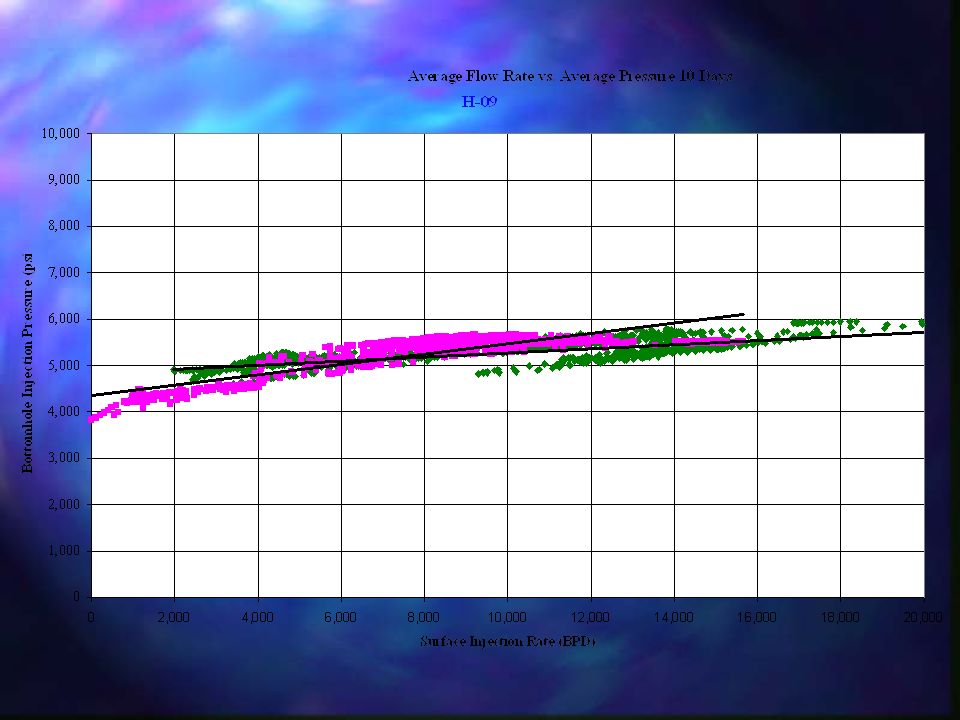
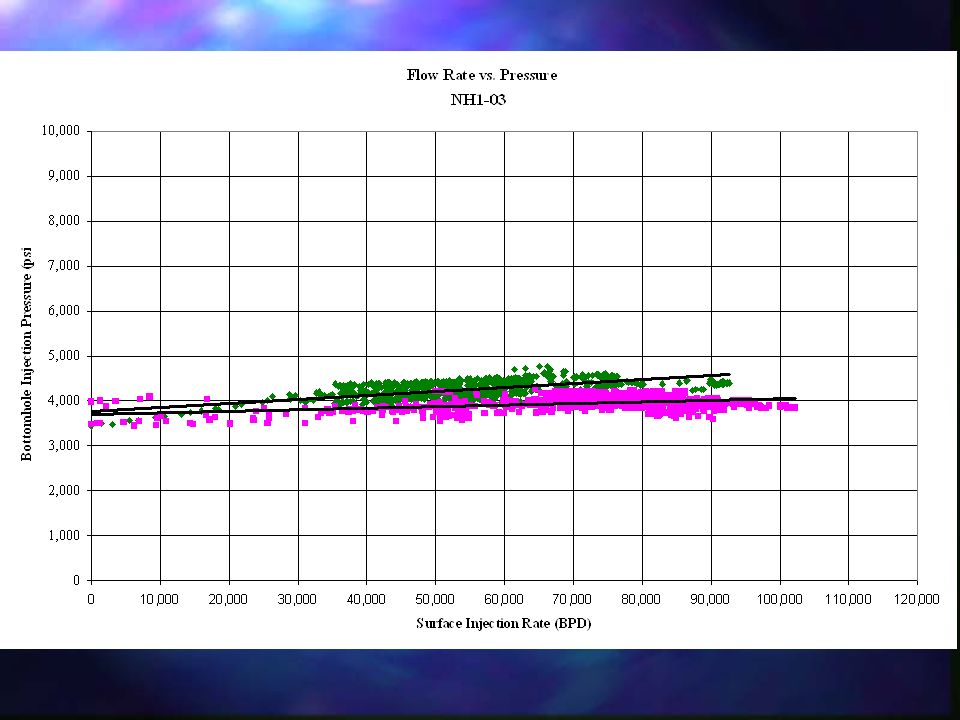
Injection Data Analysis Tool n A well written tool. n Can take both SI and oil Field Units. n Can compute tubular and perf frictions. n Plots many different curves with stimulation shown on plots. –Rate, pressures, inj. Index versus time. –Modified Hall Plot. –Rate versus BHP,...

5
Injectivity Alert System n When is the Hall Plot Changing? –How early can we identify real changes? –Injectivity data is usually very scattered –‘Eyeballing’ slope changes on Hall Plot + noise in data leads to ‘wait till we’re sure’ attitude –Early detection provides opportunity for early remedial work and can therefore potentially save a lot of money!

6
Shawhart Control Charts n Big “random” variations in PWRI injection data occur leading to delayed detection n Cumulative Sum Control Charts are more appropriate

7
Cumulative Sum Method Procedure 1. Set target value - we use “running average” over 15-25 data points 2. Calculate difference between target and data point Cumulative Sum Observation number 3. Sum the difference 4. Plot the sum against observation number

8
V-Mask for CuSum Charts n The objective is to highlight critical shifts n The angle of the mask represents number of standard deviations acceptable variations are Cumulative Sum Observation number n Narrow mask will give early indication of change but is more likely to give false alarms n Wide mask gives few false alarms but takes longer to note real changes

9
n The V-Mask method works very well on “perfectly random” synthetic datasets n Actual datasets are not perfectly random - “normal” fluctuations are big so the V-mask either indicates many false alarms or takes long to notice actual changes n They vary with time and from well to well and therefore it is difficult to automate the design - Custom design is necessary n Design of V-mask may only be practical when “normal” fluctuations are small Why difficult to design effective V-Mask?

10
Observations n CuSum plots are a powerful tool for early detection of slow gradual changes in injectivity (e.g. plugging) n This is important as there are many cases where early detection followed by (cheap) remedial action will reduce cost –e.g. readjustment of process facilities rather than carry out well stimulation
 n This is important as there are many cases where early detection followed by (cheap) remedial action will reduce cost –e.g. readjustment of process facilities rather than carry out well stimulation.")
11
Conclusions n CuSum method is effective for sudden injectivity changes e.g. fracturing, stimulation, but not necessarily more effective than the original Hall-Plot method where such changes are usually quite clear n Bottomhole and current reservoir pressure are required to quantify injectivity changes (skin, permeability) n Use of tubing head pressure alone can give false alarms if either rate or reservoir pressure is changing
 n Use of tubing head pressure alone can give false alarms if either rate or reservoir pressure is changing.")
28
First 400 days

Similar presentations


. Quality of Manufacturing Process depends on Entry Criteria.>")


