Download presentation
Presentation is loading. Please wait.

2
“Challenges and Possible Solutions in the Power Sector” A PRESENTATION TO THE ECONOMICS ASSOCIATION OF ZAMBIA R P SISALA MANAGING DIRECTOR 10 TH JULY 2008 ZESCO LIMITED

3
PRESENTATION LAYOUT 1.Overview of Zambian Power Sector 2.Outline of ZESCO Power System 3.The Power Supply Challenge 4.ZESCO System Status 5.Strategies to Overcome the Deficit 6.Conclusion

4
1.OVERVIEW OF ZAMBIAN POWER SECTOR

5
I.MAJOR ECONOMIC ACTIVITIES Mining Agriculture Tourism Industry & Commerce Construction And Housing

6
II.POWER SECTOR PLAYERS ZESCO-PUBLIC UTILITY Public Utility Generation, Transmission, Distribution and Supply COPPERBELT ENERGY CORPORATION Privately Owned Transmission & Distribution to Mines BSA with ZESCO to Purchase Power and Sell to Copperbelt Mines (Ex- ZCCM) 80MW Gas Turbines LUNSEMFWA HYDRO POWER COMPANY Privately Owned Generation Capacity-37MW Some transmission lines into Kabwe PSA with ZESCO for Sale of Bulk Power
 80MW Gas Turbines LUNSEMFWA HYDRO POWER COMPANY Privately Owned Generation Capacity-37MW Some transmission lines into Kabwe PSA with ZESCO for Sale of Bulk Power")
7
2. OUTLINE OF ZESCO POWER SYSTEM

8
I.ZESCO FACT SHEET Vertically integrated utility Annual turnover: US$$300million Assets in excess of US$3.0billion Customer base: over 300,000 Employees: 3,900 Sales: 9,450GWh National maximum demand: +1,500MW Customer/employee ratio: 80 Approx. 50% sales to CEC & other mining customers 5% exports to regional markets Access rates-27%

10
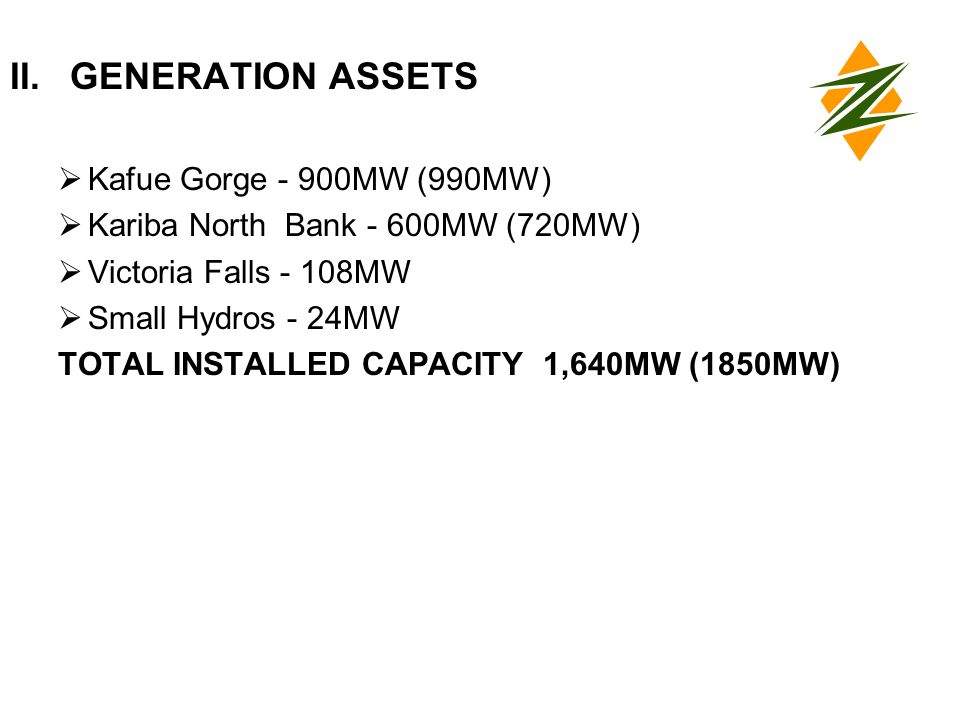
II.GENERATION ASSETS Kafue Gorge - 900MW (990MW) Kariba North Bank - 600MW (720MW) Victoria Falls - 108MW Small Hydros - 24MW TOTAL INSTALLED CAPACITY 1,640MW (1850MW)
 Kariba North Bank - 600MW (720MW) Victoria Falls - 108MW Small Hydros - 24MW TOTAL INSTALLED CAPACITY 1,640MW (1850MW)")
11
III.TRANSMISSION ASSETS 330KV - 2,008km 220KV - 548km 132KV - 85km 88KV - 704km 66KV - 3,014km High Voltage Substations - 27 National Control Centre - 01 Regional Control Centres - 03

12
IV.DISTRIBUTION ASSETS 66kV+3,000km 33kV & 11KV+6,500km MV lines+20,000km In excess of 5,000 substations 6 Diesel fired power stations 8MW

13
D R CONGO TANZANIA MALAWI MOZAMBIQUE ZIMBABWE NAKONDE KASAMA ISOKA CHINSALI MPOROKOSO LUWINGU MPIKA PENSUL O SERENJE CHIPATA CHIRUNDU LEOPARDS HILL KARIBA SOUTH MUSONDA FALLS (5MW) LUSIWASI (12MW) MULUNGUSHI (20MW) MSORO LUNDAZI MFUE AZELE LUNSEMFWA (18MW) CHISHIMBA FALLS LUNZUA (0.75MW) MBALA SAMFYA KASHIKISHI PETAUKE MOMBUTUTA CHIENGI LUAPULA RIVER To Sumbuwanga KALUNGWISHI RIVER MPULUNGU NAMIBIA BOTSWANA ANGOLA KALAB O MONGU SENANGA SESHEKE SOLWEZI ITEZHI – TEZHI (120MW) VICTORIA FALLS (108MW) MUZUMA MICHELO LUANO KITWE MAPOSA KANSUSWA KABWE KAPIRI MPOSHI MPONGWE LUSAKA WEST KAFUE WEST KAFUE TOWN KAFUE LOWER (750MW) KAFUE GORGE 900MW(1080MW) KARIBA NORTH (600MW(750MW) LAKE KARIBA MAZABUKA MUMBWA MANSA MAMBILIMA KAFUE RIVER ZAMBEZI RIVER CHAMBESHI RIVER WEST LUNGA at West Lunga River (2.5MW) KASEMPA CHIKATA FALLS (3.5MW) MUFUMBWE LUKULU KAOMA 220kV 22 o East 33.5 o East 8o8o 18 o KATIMA MULILO ZAMBEZI LUANGWA 132kV 88kV 66kV 330kV EXISTING POWER\SUBSTATIONS AND POWER LINES PROPOSED POWER\SUBSTATIONS AND POWER LINES 330kV 220kV 132kV 88kV 66kV HYDRO POWERSTATION SUBSTATION DIESEL STATION PROPOSED HYDROPOWERSTATION PROPOSED SUBSTATION PROPOSED DIESEL STATION CHONGWE CHAVUMA KABOMPO MWINILUNGA KANSANSHI LUMWANA (Mine) KAPUTA NCHELENGE CHAMA KUNDABWIKA (101MW) KABWELUME (62MW) KAWAMBWA TEA MBERESHI LUSIWASI EXTENSION (40MW) KARIBA NORTH EXTENSION (600MW(750MW) BATOKA GORGE (800MW) DEVILS GORGE (800MW) BWANA MKUBWA ROMA COV. NAMPUNDWE MAAMBA KATIMA MULILO KABOMPO Gorge (34MW) Luangwa Bridge Mkushi Farm Block Mkushi Central Kawambwa Town Chambasitu SHANGOMBO MUYOMBE ZESCO GRID (66 – 330kV)
 Luangwa Bridge Mkushi Farm Block Mkushi Central Kawambwa Town Chambasitu SHANGOMBO MUYOMBE ZESCO GRID (66 – 330kV).")
14
3. THE POWER SUPPLY CHALLENGE - REGIONAL AND ZAMBIAN PERSPECTIVE

15
I.MAIN DRIVERS OF ELECTRICTY DEMAND AND THE DEFICIT Economic Growth of more than 5% in most of the SADC member countries resulting in unprecedented growth in electricity consumption and demand Driven by increased demand for base metals resulting in high metals prices on world market New mining companies established and others expanded Growth in other sectors such as industry, commerce, agriculture, housing, etc Country electrification programmes – rural and urban Inadequate investment in generation and transmission infrastructure over the last 20 – 30 years

16
II.ENERGY DEMAND PROJECTIONS EXISTING CAPACITY TO BE EXHAUSTED AROUND 2007/08 BOTH NATIONAL AND REGIONAL DEMAND TO SURPASS CURRENT CAPACITY NEED FOR NEW POWER PLANTS ELECTRICITY IS KEY TO NATIONAL ECONOMIC DEVELOPMENT

17
1998 2007 20102000 Installed Capacity Future demand SAPP DEMAND PROJECTIONS 1998 TO 2010

19
THE CHALLENGE WAS IDENTIFIED AND COMMUNICATED BUT NOT ADEQUATELY ADDRESSED

20
III.CHALLENGES NOT ADEQUATELY ADDRESSED CAPITAL INVESTMENT REQUIREMENTS -Power projects have long gestation periods -Pre-feasibility & feasibility studies plus EIA -Project packaging and mobilisation of finance -Plus project implementation 5 – 7years -Power sector investments require huge capital outlay -Characterised by long payback periods -But private sector requires short term returns -Power projects compete for capital with more lucrative projects with short term returns

21
CHALLENGES NOT ADEQUATELY ADDRESSEDCont’d SUB-ECONOMIC TARIFFS -Tariffs in Zambia too low & not cost reflective -Cannot meet typical investment requirements -Legacy of socialist economy -Topic flavoured by socio-political issues

22
COMPARISON OF REGIONAL TARIFFS (2007)
")
24
CHALLENGES NOT ADEQUATELY ADDRESSEDCont’d SURPLUS CAPACITY - Zambia was an energy surplus nation -Economy went through period of stagnation -Did not anticipate high rate of economic recovery -

25
CHALLENGES NOT ADEQUATELY ADDRESSEDCont’d STAKEHOLDERS AND LOBBY GROUPS -Sector opened to private investment through Electricity Act CAP 433 of 1995 -Govt. established OPPI in 1999 -Package of incentives for private sector investment in power projects put in place -Future generation projects to be private sector driven -Endless debates on privatisation and/or restructuring of ZESCO but no new Megawatts -Private sector was seen as panacea for future energy requirements but none came to invest -Generation projects taken away from ZESCO -

26
ZESCO’S RESPONSE -ZESCO recognised that time was being lost in privatisation and other debates about the structure of the industry -Not permitted to invest in new generation projects -Saw that the nation would one day wake up to a power deficit -Need for quick intervention at least to delay day of reckoning - Took the option of changing scope of its Power Rehabilitation Project to include uprating -Uprating of Kafue Gorge and Kariba North Bank to add 210MW of additional capacity at minimal cost -This action delayed project completion but it was worthwhile ZESCO’S RESPONSE TO CHALLENGES

27
4. ZESCO SYSTEM STATUS

28
-PRP in progress at Kafue Gorge and Kariba North Bank power stations -Total 450MW not available -Available capacity 1,170MW -Current national demand 1,450MW -The deficit is a peak period phenomenon, sufficient capacity during off-peak periods -Load management otherwise known as load shedding required in order to maintain balance of supply and demand during peak periods ZAMBIA: CURRENT DEFICIT

30
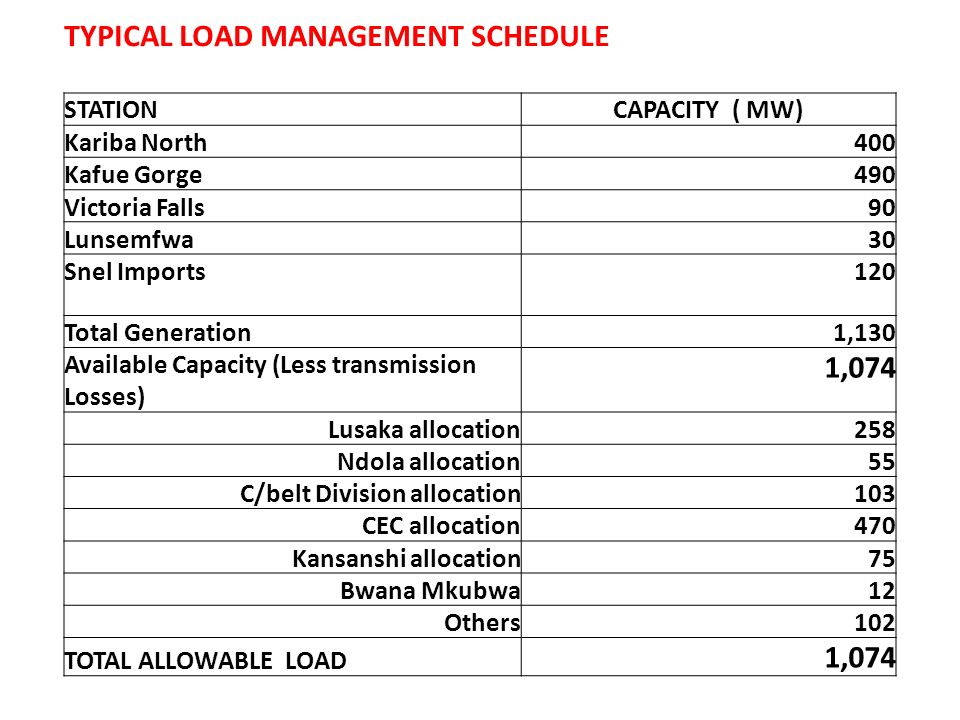
TYPICAL LOAD MANAGEMENT SCHEDULE STATIONCAPACITY ( MW) Kariba North400 Kafue Gorge490 Victoria Falls90 Lunsemfwa30 Snel Imports120 Total Generation1,130 Available Capacity (Less transmission Losses) 1,074 Lusaka allocation258 Ndola allocation55 C/belt Division allocation103 CEC allocation470 Kansanshi allocation75 Bwana Mkubwa12 Others102 TOTAL ALLOWABLE LOAD 1,074
 Kariba North400 Kafue Gorge490 Victoria Falls90 Lunsemfwa30 Snel Imports120 Total Generation1,130 Available Capacity (Less transmission Losses) 1,074 Lusaka allocation258 Ndola allocation55 C/belt Division allocation103 CEC allocation470 Kansanshi allocation75 Bwana Mkubwa12 Others102 TOTAL ALLOWABLE LOAD 1,074")
31
5. STRATEGIES TO OVERCOME THE DEFICIT

32
I.SHORT TERM STRATEGIES DEMAND SIDE MANAGEMENT Reduction in peak demand by voluntary load reduction -otherwise power rationing and load shedding by ZESCO Process efficiencies Use energy efficient appliances equipment e.g. - replace incandescent lamps with Compact Fluorescent Lamps (CFLs) Shifting of load away from peak periods -switch off unnecessary appliances during peak periods e.g. electric geysers, swimming pool pumps, borehole pumps -business houses can shift (some) production processes to off-peak and benefit from off-peak tariffs Power factor improvements -large consumers such as mines, industry and agriculture -carefully selected process equipment -retro-fitting capacitor units on inductive equipment such as electric motors
 Shifting of load away from peak periods -switch off unnecessary appliances during peak periods e.g. electric geysers, swimming pool pumps, borehole pumps -business houses can shift (some) production processes to off-peak and benefit from off-peak tariffs Power factor improvements -large consumers such as mines, industry and agriculture -carefully selected process equipment -retro-fitting capacitor units on inductive equipment such as electric motors.")
33
UPRATING OF EXISTING POWER STATIONS Kafue Gorge- 900MW TO 990MW Kariba North Bank- 600MW TO 720MW Additional capacity:- 210MW ZESCO to accelerate PRP -complete Kafue Gorge December 2008 -complete Kariba North Bank March 2009 Similar projects being undertaken at regional level SHORT TERM STRATEGIES cont’d

34
PROMOTING ENERGY EFFICIENCY STRATEGIES - USE OF CFL’s Suspension of duty and VAT Partnerships with retailers Encourage use by consumers 8/30/2015

35
Save 80% USE OF ENERGY SAVING lamps – Compact Flourescent Lamps (CFLs).. Dimmer Switchers INDOOR LIGHTING: Hotels, Homes 8/30/2015

36
INCANDESCENT VS ENERGY SAVER BULB TYPE OF BULB WATTAGE100W18W AVERAGE COSTK 2,000.00K 15.000.00 AVERAGE LIFE SPAN6-12 MONTHS 5-6 YEARS AVERAGE ENERGY USED PER MONTH (for 3 bed room home 6HRS/DAY) 144kWh25.92kWh COST OF ENERGY USED PER MONTH (CURRENT TARIFF K70/kWh) K12,384.00K2,222.64 8/30/2015
 144kWh25.92kWh COST OF ENERGY USED PER MONTH (CURRENT TARIFF K70/kWh) K12,384.00K2, /30/2015")
37
METER INSTALLATION PROGRAMME Prepaid meter installed in Lusaka-22,000 Further 60,000 in Phase 2 of Lusaka 65,000 in Copperbelt 70,000 in other urban areas by 2010 Reduction in non-technical losses Increased Energy savings 8/30/2015

38
ENERGY MANAGEMENT RESIDENTIAL SWITCHING OFF APPLIANCES e.g GEYSERS,SWIMMING POOL PUMPS, SECURITY LIGHTING,DEEP FREEZERS, BOREHOLE PUMPS etc.. DURING PEAK LOAD TIMES SET GEYSER THERMOSTART @ 60 DEG. CORRECT INSULATION 8/30/2015

39
MANAGING GEYSERS Switching off 2kw geysers between 07- 21hrs 24hrs operation-864kWh/Month @ K170,000 10hrs operation-360kWh/Month@K49,000 Savings-K121,000 Switching off 3kw geysers between 07-21hrs 24hrs operation-1296kWh@K276,000 10hrs operation-540kWh@K138,000 Savings-K138,000 8/30/2015

40
SECURITY/OUTDOOR LIGHTING HOMES, HOTELS, INDUSTRY Save 80% by replacing ML 160w with Master Ecotone 45w/65w lamps

41
COMMERCIAL INSTALL ROOM OCCUPANCY SENSORS – to switch off lights & air-conditioning in unoccupied rooms INSTALL POWER FACTOR CORRECTION EQUIPMENT (where lots of electric motor are in use) REPLACE ORDINARY BULBS WITH ENERGY SAVERS (CFLs) REPLACE MERCURY VAPOUR LAMPS WITH METAL HALIDE LAMPS (45W/60W FOR 160W) FOR OUTDOOR LIGHTING
 REPLACE ORDINARY BULBS WITH ENERGY SAVERS (CFLs) REPLACE MERCURY VAPOUR LAMPS WITH METAL HALIDE LAMPS (45W/60W FOR 160W) FOR OUTDOOR LIGHTING")
42
ROOM OCCUPANCY SENSORS INSTALL IN EACH ROOM SWITCHES OFF LIGHTS & AIRCONS IN UNOCCUPIED ROOMS

43
INDUSTRIAL INSTALL ELECTRIC MOTOR OPTMISERS ON BIG MOTORS USE Variable Speed Drives (VSDs) for pulley coupled drives INSTALL POWER FACTOR CORRECTION EQUIPMENT(CAPACITOR BANKS) DO NOT START ALL YOUR MACHINES AT THE SAME TIME TO AVOID CREATING LOCAL PEAK LOADS ARREST ALL COMPRESSED AIR LEAKS INSULATE ALL STEAM PIPES CORRECTLY
 for pulley coupled drives INSTALL POWER FACTOR CORRECTION EQUIPMENT(CAPACITOR BANKS) DO NOT START ALL YOUR MACHINES AT THE SAME TIME TO AVOID CREATING LOCAL PEAK LOADS ARREST ALL COMPRESSED AIR LEAKS INSULATE ALL STEAM PIPES CORRECTLY")
44
Intelligent because it matches power input to shaft load Saves up to 40% energy Has inbuilt soft start/stop Reduces inrush currents 8/30/2015 INTELLIGENT MOTOR CONTROLLERS

45
Floor mounted Capacitor Bank Power factor correction Reduces KVA input Save up to 15% energy

46
VARIABLE SPEED DRIVES (VSD) SAVE UP TO 15% ERNEGY
 SAVE UP TO 15% ERNEGY")
47
STREET LIGHTING : USE METAL HALIDE LAMPS REPLACE THE INEFFICIENT MERCURY VAPOUR LAMPS WITH METAL HALIDE LAMPS 400W/250W MV LAMPS WITH 160W METAL HALIDES METAL HALIDES HAVE INBUILT SENSORS TO RUN DIM WHEN NO TRAFFIC ON ROAD ENHANCED BRIGHTNESS

48
REVISED SAPP PROJECTIONS 2005 TO 2020

49
INCREASE GENERATION CAPACITY BY BUILDING NEW PLANT Zambia has an estimated hydro power potential of 6,000MW of which less than 2,000MW has been harnessed. Sites yet to be developed include Kafue Gorge Lower, Itezhi Tezhi, Kalungwishi, Mambilima, Batoka Gorge, Devil’s Gorge, Kabompo, etc II.MEDIUM TO LONG TERM STRATEGIES

50
In Zambia planned projects include the following ZESCO projects: Itezhi Tezhi -Capacity120MW -Cost US$250Million -Implementation 2008 – 2012 Kariba North Bank Extension -Capacity:360MW -Cost:US$300Million -Implementation:2008 – 2012 MEDIUM TO LONG TERM STRATEGIES cont’d

51
INCREASE GENERATION CAPACITY BY BUILDING NEW PLANT Other planned projects in Zambia include: Kafue Gorge Lower600 – 750MW Maamba(Coal fired)300 – 450MW Similar projects planned or in progress at regional level MEDIUM TO LONG TERM STRATEGIES cont’d
300 – 450MW Similar projects planned or in progress at regional level MEDIUM TO LONG TERM STRATEGIES cont’d")
52
REGIONAL INTERCONNECTIONS TO OTHER UTILITIES (TO SHARE REGIONAL GENERATION CAPACITY) Existing -Zambia – Zimbabwe:2 x 330KV -Zambia – DRC:1 X 220KV Planned -Livingstone – Hwange (Zimbabwe):1 x 330KV -Livingstone – Katima Mulilo (Namibia):1 x 220KV (Phase 1 on Zambian side complete, phase 2 in Namibia in progress) -Kafue – Livingstone:upgrade existing 220KV to 330KV -Zambia – DRC:1 x 330KV -Zambia – Tanzania – Kenya:double circuit 330KV - Planned interconnectors between Other planned projects in Zambia include: Kafue Gorge Lower600 – 750MW Maamba(Coal fired)300 – 450MW Similar projects planned or in progress at regional level MEDIUM TO LONG TERM STRATEGIES cont’d
 Existing -Zambia – Zimbabwe:2 x 330KV -Zambia – DRC:1 X 220KV Planned -Livingstone – Hwange (Zimbabwe):1 x 330KV -Livingstone – Katima Mulilo (Namibia):1 x 220KV (Phase 1 on Zambian side complete, phase 2 in Namibia in progress) -Kafue – Livingstone:upgrade existing 220KV to 330KV -Zambia – DRC:1 x 330KV -Zambia – Tanzania – Kenya:double circuit 330KV - Planned interconnectors between Other planned projects in Zambia include: Kafue Gorge Lower600 – 750MW Maamba(Coal fired)300 – 450MW Similar projects planned or in progress at regional level MEDIUM TO LONG TERM STRATEGIES cont’d")
53
Map of Southern Africa 10 40 Equator 45

54
6.CONCLUSION Power sector crucial to dynamic economic growth Massive investments required in power sector Cost reflective tariffs an important element in all efforts Demand Side Management crucial to manage deficit The task is heavy but not insurmountable Need for all stakeholders to play their part

55
THANK YOU

Similar presentations


, Tanzania,>")


