Download presentation
Presentation is loading. Please wait.

1
Interactions Within Ecosystems

2
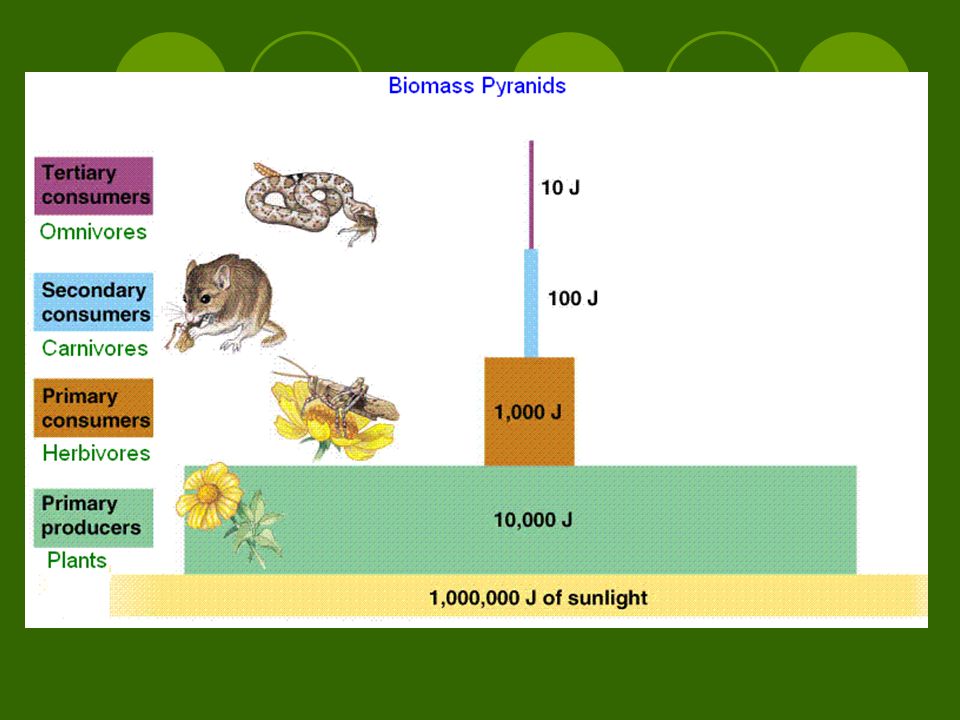
Cast of Food Web Characters
Tertiary Consumers – Animals that eat animals that eat animals Secondary Consumers – Animals that eat animals that eat plants Primary Consumers – Animals that eat plants Primary Producers – Plants and Phytoplankton: organisms using the sun for energy Students have a copy of this pyramid on their worksheet and are to identify primary producers, primary consumers, secondary consumers, and tertiary consumers.

3
Groups of living things interact within ecosystems
The environment can be organized into five levels Biome : region with similar climate, types of plants, and animals Ecosystem: The living and non-living things that interact in one environment. Community: The living organisms of an ecosystem Population: A group of organisms of the same species that live in the same area. Organism: A single living thing, made up of one or many cells, that is capable of growing and reproducing.

4
Patterns Exist in Populations
Patterns in Living Space Animals in a habitat are located based on food supplies, water, and shelter locations. Some animals live in large groups for safety ( fish and elephants )
")
5
Patterns in Time Population sizes can change with seasons
Many organisms migrate to other areas (monarch butterflies and birds)
")
6
Organisms Interact in Different Ways
Organisms may cooperate, compete, or depend on each other for survival Predator and Prey relationships Predators can affect how the prey populations are distributed (fish in large groups) Prey can affect the location and number in predator populations (birds feeding on insects migrate to the areas where the insects are plentiful)
 Prey can affect the location and number in predator populations (birds feeding on insects migrate to the areas where the insects are plentiful)")
7
Organisms Interact in Different Ways
Competition Competition is the struggle between individuals or different populations for a limited resource

8
Also any resource in any ecosystem exists only in a limited supply.
All the organisms in any ecosystem have some effect on every other organism in that ecosystem. Also any resource in any ecosystem exists only in a limited supply. When these two conditions apply jointly, competition takes place.

9
Example: Seagull In a seagull colony on an oceanic outcrop, as the population grows, so the pressure for good nesting sites increases. This can affect the number of eggs that each female can successfully hatch, and so affects the birth rate of the population as a whole. This sort of interaction is called a Density Dependent factor - the effect is depends on the population density ( low density small effect, high density large effect). This mainly associated with pressure for food, nutrients or space.
. This mainly associated with pressure for food, nutrients or space.")
10
Competition can happen with the same species (plants compete for light, space, and nutrients)
Competition between different species (hyenas and vultures compete for remains of dead animals)
")
11
INTRASPECIFIC COMPETITION.
Competition between members of the same species When the numbers of a population are small, there is little real competition between individuals for resources. Provided the numbers are not too small for individuals to find mates, population growth will be high. As the population grows, so does the competition between individuals for the same resources until eventually the carry capacity of the ecosystem is reached. In this situation, often the stronger individuals claim the larger share of the resources.

12
Intraspecific continued…
Some species deal with intraspecific competition by being territorial. An individual or pair hold an area and fend off rivals. Individuals that are the most successful reproductively will hold the biggest territory and hence have access to more resources. Example: animals will often spray urine to mark their territories and claim their area

13
Intraspecific competition tends stabilize populations dependent upon the controlling resources.

14
Intraspecific produces something called logistic growth
The graph illustrates this for a colony of yeast grown in a constant but limited supply of nutrient. During the first few days the colony grows slowly as it starts to multiply (lag phase) then it starts to grow very rapidly as the multiplying colony has a plentiful nutrient supply (exponential phase). Eventually the population size stabilizes as only a set number of yeast cells can exploit the limited resources (stationary phase). Anymore yeast cells and there is not enough food to go around.
 then it starts to grow very rapidly as the multiplying colony has a plentiful nutrient supply (exponential phase). Eventually the population size stabilizes as only a set number of yeast cells can exploit the limited resources (stationary phase). Anymore yeast cells and there is not enough food to go around.")
15
INTERSPECIFIC COMPETITION
Individuals of different species competing for the same resource. Interspecific competition may result in a balance, in which both species share the resource. The other outcome is that one species may totally out compete the other, this is the principal of competitive exclusion.

16
Interspecific Competition
An example of both of these outcomes can be seen in a garden that has become overrun by weeds. A number of weed species coexist together, but often the original domestic plants have been totally excluded.

17
Interspecific Think of it like 2 species intersecting

18
In a woodland light is a limiting resource.
Plant species that can not get enough light will die out in a woodland. This is especially true of small flowering plants on the woodland floor that are not only shaded out by trees but by shrubs and bushes as well. Beech trees have very closely overlapping leaves, resulting in an almost bare woodland floor.

19
But even in Beech woods, flowers manage to grow in the spring
But even in Beech woods, flowers manage to grow in the spring. Carpets of Snowdrops, Primroses and Bluebells an integral part of all Northern European deciduous woodlands in the spring. The key to these species success is that they grow, flower and reproduce before the shrub and tree species burst into leaf. They avoid competing directly with species that would out compete them for light by completing the stages of their yearly cycle that require the most energy and therefore the greatest photosynthesis when competition is less.

20
Organisms Interact in Different Ways
Cooperation Some organisms work together to benefit each other Killer whales hunt in pods (groups) Ants, bees, and termites (members of a colony have different roles and responsibilities…queen bee, worker bees, etc.)
 Ants, bees, and termites (members of a colony have different roles and responsibilities…queen bee, worker bees, etc.)")
21
Survival of One Species Might Depend on Another Species
Symbiosis: two different species who live together in a close relationship Both species benefit One species benefits while the other is not affected One species benefits while the other is harmed

22
Types of Symbiosis Mutualism: Two species interacting with each other that benefits both species. (bees and flowers)

23
Types of Symbiosis Commensalism: two species interacting with each other with one species benefiting and the other unaffected. (jellyfish and fish)

24
Types of Symbiosis Parasitism: two species interacting while one species benefits and the host species is harmed Examples of human parasites.

25
Populations Change Over Time
Population growth and decline Predator-prey interactions can affect population increase or decrease ( as a wolf population increases the moose population decreases) Birth rate may decline or increase
 Birth rate may decline or increase.")
26
Populations Change Over Time
Limiting factors: any factor or condition that limits the growth of a population in an ecosystem (food, water, light, large group of predators, small group of prey)
 print=true.")
27
Maintaining a Balance in an Ecosystem
Carrying Capacity: the maximum number of individuals that an ecosystem can support. Limiting factors affect the carrying capacity

28
Main Points on Organism Interactions in Ecosystems
Groups of living things interact within ecosystems (biome, ecosystem, community, population, organism) Organisms can interact in different ways (symbiosis: mutualism, commensalism, parasitism)
 Organisms can interact in different ways (symbiosis: mutualism, commensalism, parasitism)")
29
Bioaccumulation = the accumulation of a contaminant or toxin in or on an organism from all sources (e.g., food, water, air). An increase in the concentration of a chemical in a biological organism over time, compared to the chemical's concentration in the environment. Compounds accumulate in living things any time they are taken up and stored faster than they are broken down (metabolized) or excreted. Chemicals that are soluble in fat, like DDE, particularly tend to bioaccumulate compared to those soluble in water. Chemicals that are soluble water are removed from the body in urine, whereas those soluble in fat, do not have a means to leave the body and remain in tissue.

30
Biomagnification = the increase in concentration of toxin as it passes through successive levels of the food web

31
Ospreys and eagles are tertiary consumers and this makes them particularly vulnerable to DDT because of bioaccumulation and biomagnification.

32
Ecosystem structure Food Chain
Shows the flow of energy from one organism to the next Trophic Level The feeding level based on an organisms source of nutrients Nearly all energy that sustains a food chain begins with the sun

33
Trophic level: The position that an organism occupies in a food chain, or a group of organisms in a community that occupy the same position in food chains. It is possible to classify the way organisms obtain energy into two categories.

34
Producers or Autotrophs: These manufacture their own food from simple inorganic substances (plants)
Consumers or Heterotrophs: Feed on autotrophs or other heterotrophs to obtain energy (herbivores, carnivores, omnivores, detrivores and decomposers But within the consumers their is a feeding hierarchy of Plants capture the suns energy and convert it to glucose, herbivores eat plants and carnivores eat herbivores - different feeding levels (Greek for food is trophe)
")
35
Trophic level 1 - producer
Trophic level 2 - herbivore (primary consumers) Trophic level 3 - carnivore (secondary consumers) Trophic level 4 - carnivore (tertiary consumer) The first trophic level, the autotrophs supports the energy requirements of all the other trophic levels above.
 Trophic level 3 - carnivore (secondary consumers) Trophic level 4 - carnivore (tertiary consumer) The first trophic level, the autotrophs supports the energy requirements of all the other trophic levels above.")
36
Use the terms producer , consumer, decomposer, herbivore, carnivore and top carnivore to explain the following diagram

37
Trophic Levels Producers (autotrophs)
–Use photosynthesis to create nutrients from sun and compounds Primary consumers (herbivores) Mainly feed on grass, leaves, plants Secondary consumers (carnivores) –Feed on the flesh of animals (mainly herbivores) Tertiary or higher consumers (carnivores) Feed primarily of the flesh of other animals herbivores or carnivores
 Mainly feed on grass, leaves, plants. Secondary consumers (carnivores) –Feed on the flesh of animals (mainly herbivores) Tertiary or higher consumers (carnivores) Feed primarily of the flesh of other animals herbivores or carnivores.")
38
Food Chain Ecosystems have an hierarchy of feeding relationships (trophic levels) that determine the pathway of energy flow in the ecosystem. The energy flow in the ecosystem can be illustrated as a Food chain.

39
Limits to Food Chains

40
It is possible to construct food chains for an entire ecosystem, but this starts to create a problem. The food chains below are form a European Oak Woodland. In fact they are based on real food chains at Wytham Wood in Oxford

41
In the four different food chains only ten species are listed and some of them are in more than one food chain. If we continued to list all the species in the wood and their interactions in every food chain the list would run for many pages. Food chains only illustrate a direct feeding relationship between one organism and another in a single hierarchy. The reality though is very different. The diet of almost all consumers is not limited to a single food species. So a single species can appear in more than one food chain.

42
A further limitation of representing feeding relationships by food chains is when a species feeds at more than one trophic level. Voles are omnivores and as well as eating insects they also eat plants. We would then have to list all the food chains again that contained voles but moving them to the second trophic level rather than the third in a shorter food chain.

43
The reality is that there is a complex network of interrelated food chains which create a food web.

44
Food Web

45
Ecological pyramids A bar diagram that indicates the relative numbers of organisms at each trophic level in a food chain. The length of each bar gives a measure of the relative numbers. Pyramids begin with producers, usually the greatest number at the bottom decreasing upwards.

46
Pyramid Advantages It is a simple easy method of giving an overview and is good at comparing changes in population numbers with time or season. Disadvantages All organisms are included regardless of their size, therefore a system say based on an oak tree would be inverted (have a small bottom and bet larger as it goes up trophic levels). Also they do not allow for juveniles or immature forms. Numbers can be to great to represent accurately.
. Also they do not allow for juveniles or immature forms. Numbers can be to great to represent accurately.")
47
Pyramids Biomass Pyramid Measures mass per area (kg·m-2)
Energy Pyramid Measures energy in Joules or kilocalories (kcal·m-2) or (J·m-2)
 or (J·m-2)")
48
Pyramids of biomass As pyramids of number but uses dry mass of all organisms at each trophic level. Advantages Overcomes the problems of pyramids of number. Disadvantages Only uses samples from populations, so it is impossible to measure biomass exactly. *Also the time of the year that biomass is measured affects the result.

49
Biomass Pyramid -Biomass shows the mass of all species in a given area
Units are generally given in kilograms per meter2. -Biomass pyramids attempt to quantify mass per unit area by trophic level Extrapolate by multiplying to account for total area

50
Biomass Pyramid Extrapolation
The total biomass of a meter2 is calculated as 32kg/m2. If this square meter were representative of an area that is 1 km2, what is the biomass of the area? 32 kg ,000,000 m2 = 3.2 x 10⁷ kg·km-2 1m km2

51
Pyramids of energy The bars are drawn in proportion to the total energy utilized at each trophic level. Also the productivity of producers in a given area measured for a standard time, and the proportion utilized by consumers can be calculated. Advantages Most accurate system shows the actual energy transferred and allows for rate of production. Disadvantages It is very difficult and complex to collect energy data.

53
Why use ecological pyramids.
Ecological pyramids allow you to examine easily energy transfers and losses. They give an idea of what feed s on what and what organisms exist at the different trophic levels. They also help to demonstrate that ecosystems are unified systems, that they are in balance.

Similar presentations