Download presentation
Presentation is loading. Please wait.

2
Estimation of Demand Prof. Ravikesh Srivastava Lecture-8

3
From Theory to Practice What is the true quantitative relationship between demand and the factors that affect it? How can demand functions be estimated? How can managers interpret and use these estimations?

4
Procedures used in marketing research for demand estimation Consumer Surveys Consumer Clinics Market Experiments Historical Time Series Experiments Statistical Links Between National, State, And Regional Performance With Consumer Demand In The Region.

5
Most common methods used are: a) consumer interviews or surveys b) market studies and experiments c) regression analysis
 consumer interviews or surveys b) market studies and experiments c) regression analysis")
6
Consumer Surveys A survey instrument is designed and administered either by mail or by phone or in person. Ask potential buyers how much of the commodity they would buy at different prices (or with alternative values for the non-price determinants of demand)
.")
7
Consumer Clinics Participants know what you are trying to learn and may try to assist the research or support expected findings. These are also very costly to administer.

8
Consumer Interviews continued Problems: 1. Selection of a representative sample what is a good sample! 2. Response bias how truthful can they be? 3. Inability or unwillingness of the respondent to answer accurately

9
Market Studies and Experiments More expensive and difficult technique for estimating demand Displaying the products in several different stores, generally in areas with different characteristics, over a period of time For instance, changing the price, holding everything else constant

10
Market Studies and Experiments continued Problems in conducting market studies and experiments: a) expensive b) availability of subjects c) do they relate to the problem, do they take it seriously
 expensive b) availability of subjects c) do they relate to the problem, do they take it seriously")
11
Simple Linear Regression- an effective method to estimate Demand We assume a two variable case where the form of the relationship between variables is linear.

12
Regression Analysis and Demand Estimation The most frequently used statistical technique in demand estimation Estimates the quantitative relationship between variables Quantity demanded being the dependent variable If only one independent variable (predictor) used: simple regression If several independent variables used: multiple regression
 used: simple regression If several independent variables used: multiple regression")
13
Think of a demand function of general form: Q i = + 1 Y - 2 p i + 3 p s - 4 p c + 5 Z + e where Q i = quantity demanded of good i Y = income p i = price of good i p s = price of the substitute(s) p c = price of the complement(s) Z = other relevant determinant(s) of demand e = error term
 p c = price of the complement(s) Z = other relevant determinant(s) of demand e = error term")
14
and i has to be estimated from historical data Data used in regression analysis: Cross-sectional Time series

15
Simple Linear Regression Model In the simplest case, the dependent variable Y is assumed to have the following relationship with the independent variable X: Y = a + bX + u where Y = dependent variable X = independent variable a = intercept b = slope u = random factor

16
Estimating the Regression Equation Finding a line that ”best fits” the data The line that best fits a collection of X,Y data points, is the line minimizing the sum of the squared distances from the points to the line as measured in the vertical direction This line is known as a regression line, and the equation is called a regression equation Estimated Regression Line: Y= â + bX ˆˆ

17
Observed Combinations of Output and Labor input

19
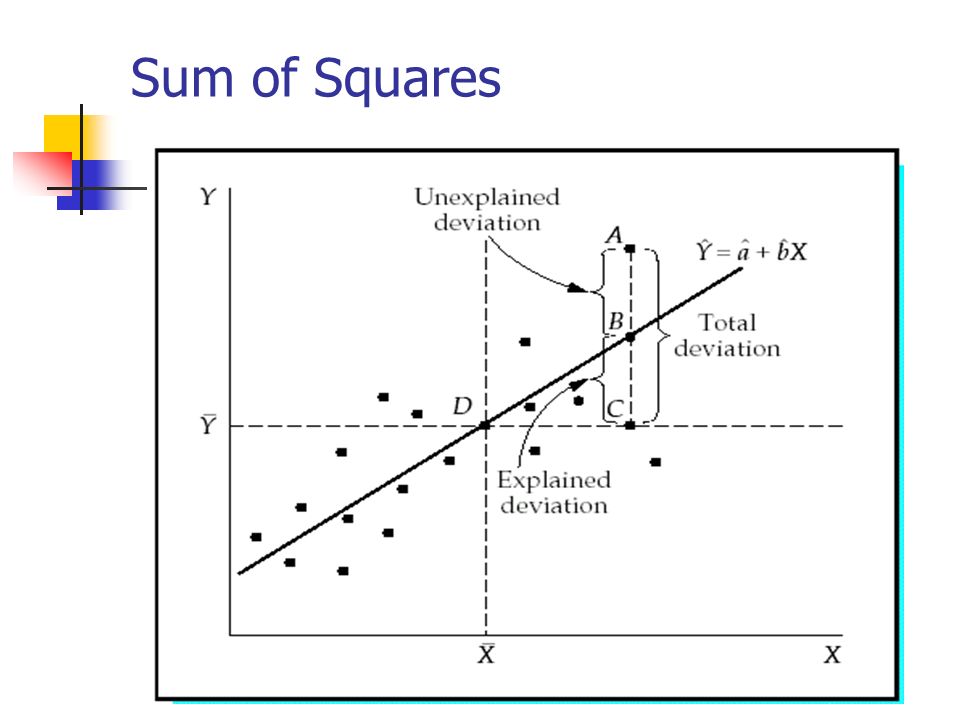
Sum of Squares

20
Sum of Squares cont. TSS= (Y i - Y) 2 RSS= (Ŷ i - Y) 2 ESS= (Y i - Ŷ i ) 2 This regression line gives the minimum ESS among all possible straight lines. ^ ^ where Y = mean of Y
 2 RSS= (Ŷ i - Y) 2 ESS= (Y i - Ŷ i ) 2 This regression line gives the minimum ESS among all possible straight lines. ^ ^ where Y = mean of Y.")
21
The Coefficient of Determination Coefficient of determination R 2 measures how well the line fits the scatter plot (Goodness of Fit) R 2 is always between 0 and 1 If it’s near 1 it means that the regression line is a good fit to the data Another interpretation: the percentage of variance ”accounted for”
 R 2 is always between 0 and 1 If it’s near 1 it means that the regression line is a good fit to the data Another interpretation: the percentage of variance accounted for")
22
Specification of Regression Model: Proxy variables to present some other “real” variable, such as taste or preference, which is difficult to measure Dummy variables (X 1 =0; X 2 =1) for qualitative variable, such as gender or location Linear vs. non-linear relationship quadratic terms or logarithms can be used Y = a + bX 1 + cX 1 2 Q D =aI b logQ D = loga + blogI

23
Example: Specifying the Regression Equation for Pizza Demand We want to estimate the demand for pizza by college students in India What variables would most likely affect their demand for pizza? What kind of data to collect?

24
Data: Suppose we have obtained cross- sectional data on college students of randomly selected 30 college campus (by a survey) The following information is available: average number of slices consumed per month by students average price of a slice of pizza sold around the campus price of its complementary product (soft drink) tuition fee (as proxy for income) location of the campus (dummy variable is included to find out whether the demand for pizza is affected by the number of available substitutes); 1 urban, 0 for non-urban area
 The following information is available: average number of slices consumed per month by students average price of a slice of pizza sold around the campus price of its complementary product (soft drink) tuition fee (as proxy for income) location of the campus (dummy variable is included to find out whether the demand for pizza is affected by the number of available substitutes); 1 urban, 0 for non-urban area")
25
Linear additive regression line: Y = a + b 1 p p + b 2 p s + b 3 T + b 4 L where Y= quantity of pizza demanded a= the intercept P p = price of pizza P s = price of soft drink T= tuition fee L= location b i = coefficients of the X variables measuring the impact of the variables on the demand for pizza

Similar presentations