Download presentation
Presentation is loading. Please wait.

1
Manufacturing Decline Within LA County: Using Cluster Analysis to Understand the Trends and Potential Policy Approaches GIS: UP206a Erin Coleman 3/14/2011

2
INTRODUCTION: Manufacturing as a whole has declined dramatically within the U.S., California, and LA County between 1998 and 2008. In 1998, manufacturing contributed about 18% of the total annual payroll within the U.S. By 2008, it contributed only 12 percent. Within California, in 1998, manufacturing also contributed about 18% of the annual payroll to the state. By 2008, it contributed about 11 percent. In terms of establishment counts, we see that the greatest number decline between 1998 and 2008 within California has occurred within LA County. What has this decline looked like in the county and how can cluster analysis provide insights into policies which can aid the local economy? Decline in Number of MNFN Establishments between 1998 and 2008 throughout California Counties By: Erin Coleman, Source: U.S. Census County Business Patterns

3
1998 Percentage Breakdown of Annual Payroll within LA County: 2008 Percentage Breakdown of Annual Payroll within LA County: 1998 Percentage Breakdown of Establishments within LA County: MANUFACTURING DECLINE WITHIN LA COUNTY

4
SELECTION OF APPAREL INDUSTRIES: 315232 and 315212 Within LA County, the apparel industries 315232, Women’s & Girls’ Apparel Manufacturing, and 315212, Cut and Sew Apparel Contractors ranked among the top 7 between 1998 and 2008 in terms of employee counts, establishment counts, and total annual payroll contributed to the county. 315232 In 1998, Los Angeles county had over 80 percent of the state's share of the 315232 industry. In 2008, this share increased to just under 90 percent. Due to this, Los Angeles County is used as the baseline for which to compare overall change. 315212 For the Industry 315212, this data shows that in 1998, 77% of all establishments within all counties in CA were located within La County. In 2008, this figure increased to 83 percent. Due to these findings, my baseline measure for comparing change in establishment counts, size, and employee counts is LA County as a whole, rather than the state at large or even the 5 county metropolitan area.

5
Location Quotient Analysis: Comparing LA County Zip codes to the County as Whole

6
Location Quotient Analysis: Comparing LA County Zip Codes to the County as a Whole

7
315212 Cross Year Analysis: Absolute Count Comparison of Employees and Establishments

8
1998-2008 Percentage Change Comparison of Employee and Establishment Counts

9
315232 Contraction in Establishment Range Between 1998 and 2008

10
SUNRISE BRANDS Employees: 100-249 801 S FIGUEROA ST # 2500, 90017 323-780-8250 Los Angeles ONE CLOTHING Employees: 100-249 2121 E 37TH ST, 90058 323-846-5700 JUST FOR WRAPS Employees: 100-249 5815 SMITHWAY ST, 90040 323-585-6878 CARESSE LINGERIE Employees: 100- 249 2313 S SANTA FE AVE. 90058 213-239-0503 WOW KNIT INC Employees: 100-249 1115 E 14TH ST 90021 213-688-0404 315232 Women & Girls Apparel Manufacturing Location of Largest Establishments by employee size according to EDD Employee Names and Contact information sourced from EDD

11
315232 Hotspot Analysis: Cluster Identification (LA County 1998-2008)
")
12
Hot Spot Analysis Cluster Index : Calculated with Raster Calculator Variables Included: 1.232empch: shows the percentage change in average employee counts between 1998 and 2008 – included because places with high levels of employee growth might indicate clustering 2.232essc: shows the percentage change in average establishment size (by employee) between 1998 and 2008 – included because places with increase in average establishment size might indicate clustering 3.232lsemp: shows the percentage change of average employee counts between 1998 and 2008 within each zip divided by the change in employee counts during this time span within LA County at large – included because zip codes with a lower level of decline than the county might show signs of agglomeration/ local resilience. 4.232lqest: shows the percentage change in number of establishments between 1998 and 2008 within each zip divided by the change in establishment counts during this time span within LA County at large- included because zip codes with a lower level of decline than the county might show signs of agglomeration/local resilience. The four variables at right were given equal weighting in this index

13
MODELING RasterReclassify

14
Original Data

15
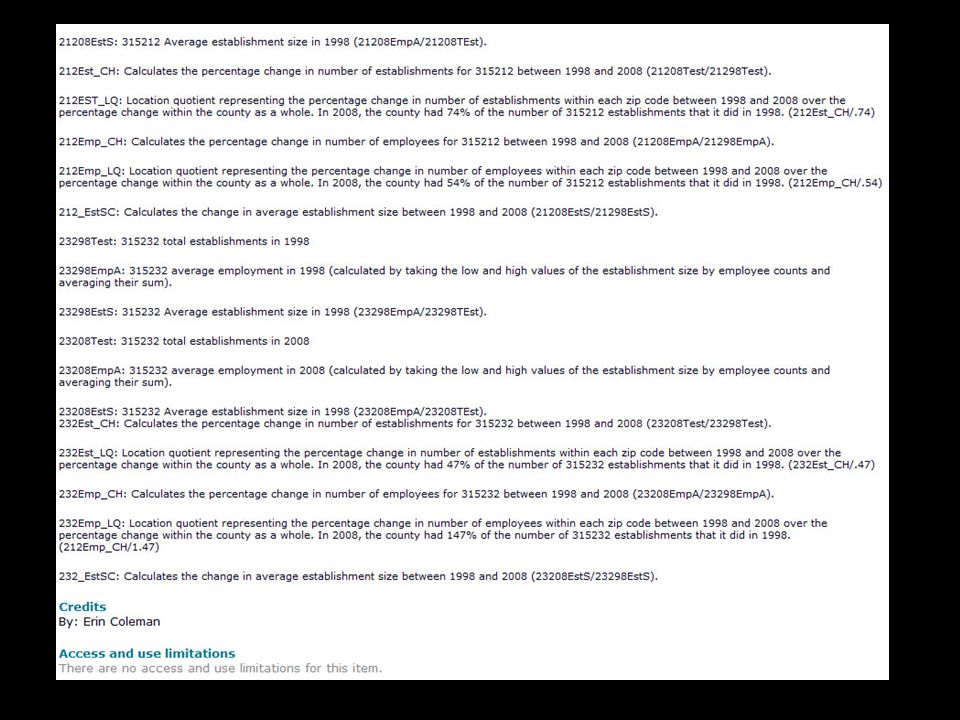
Metadata

17
Skills Modeling Metadata Measurement: Using graphics features to display distance Original data Hotspot analysis Inset Map Geoprocessing: Clipping, Dissolve: (zip code field) Select by attribute: (Location quotients) Radar charts Hotspot analysis index: using raster calculator Rasterizing and reclassifying layers Projecting data Point graduated symbols
 Select by attribute: (Location quotients) Radar charts Hotspot analysis index: using raster calculator Rasterizing and reclassifying layers Projecting data Point graduated symbols")
18
THE END Thank you!

Similar presentations
 Anna Rose Steiner Introduction to Geographic Information.>")


>")

