Download presentation
Presentation is loading. Please wait.

1
Course Title: Financial Statement Analysis Course Code: MGT-537 Course Instructor: Dr. Hafiz Muhammad Ishaq Total Lectures: 32

2
Previous Lecture Summary
Analysis of Profitability Return on Investment, Return on Total Equity, Return on Common Equity, The relationship between profitability rations, Gross Profit Margin, Trends in Profitability, Segment Reporting, Gains and Losses that Bypass the Income Statement, Interim Reports Practical Exercise

3
Analysis for the Investor
Today's Lecture Topics Analysis for the Investor Definition of Financial Leverage, Computation of Financial Leverage, Earnings per common share, Practical Exercises

4
Financial Leverage Any ratio used to calculate the financial leverage of a company to get an idea of the company's methods of financing or to measure its ability to meet financial obligations. There are several different ratios, but the main factors looked at include debt, equity, assets and interest expenses. A ratio used to measure a company's mix of operating costs, giving an idea of how changes in output will affect operating income. Fixed and variable costs are the two types of operating costs; depending on the company and the industry, the mix will differ.

5
Financial Leverage The use of debt is referred to as financial leverage Interest as related to debt financing A contractual obligation Must be paid regardless of entity’s current profits Contrast with dividends which are discretionary Interest is tax deductible Reduces taxable income Reduces income tax

6
Definition of Financial Leverage and Magnification Effects
Net income increase [A] is greater than change in EBIT [B] due to the fixed nature of interest expense

7
Computation of the Degree of Financial Leverage
A ratio that measures the sensitivity of a company’s earnings per share (EPS) to fluctuations in its operating income, as a result of changes in its capital structure. Degree of Financial Leverage (DFL) measures the percentage change in EPS for a unit change in earnings before interest and taxes (EBIT), and can be mathematically represented as follows:
 to fluctuations in its operating income, as a result of changes in its capital structure. Degree of Financial Leverage (DFL) measures the percentage change in EPS for a unit change in earnings before interest and taxes (EBIT), and can be mathematically represented as follows:")
8
Computation of the Degree of Financial Leverage
The degree of financial leverage is the multiplication factor by which the net income changes in respect to changes in EBIT A more simple formula for degree of financial leverage

9
Computation of the Degree of Financial Leverage (cont’d)
Degree of financial leverage calculations should exclude Minority share of earnings Equity income Nonrecurring items The all-inclusive formula for degree of financial leverage

10
Earnings Per Share The portion of a company's profit allocated to each outstanding share of common stock. Earnings per share serves as an indicator of a company's profitability. Required disclosure for corporate income statements Pertains only to common stock Per-share amounts are disclosed for Income from recurring items Discontinued operations Extraordinary items Net income

11
Basic Earnings per Share
Earnings pertain to an entire fiscal period Average common shares outstanding is used for parity of information

12
Weighted Average Common Outstanding
Stock dividends and stock splits Retroactive recognition to all comparative data

13
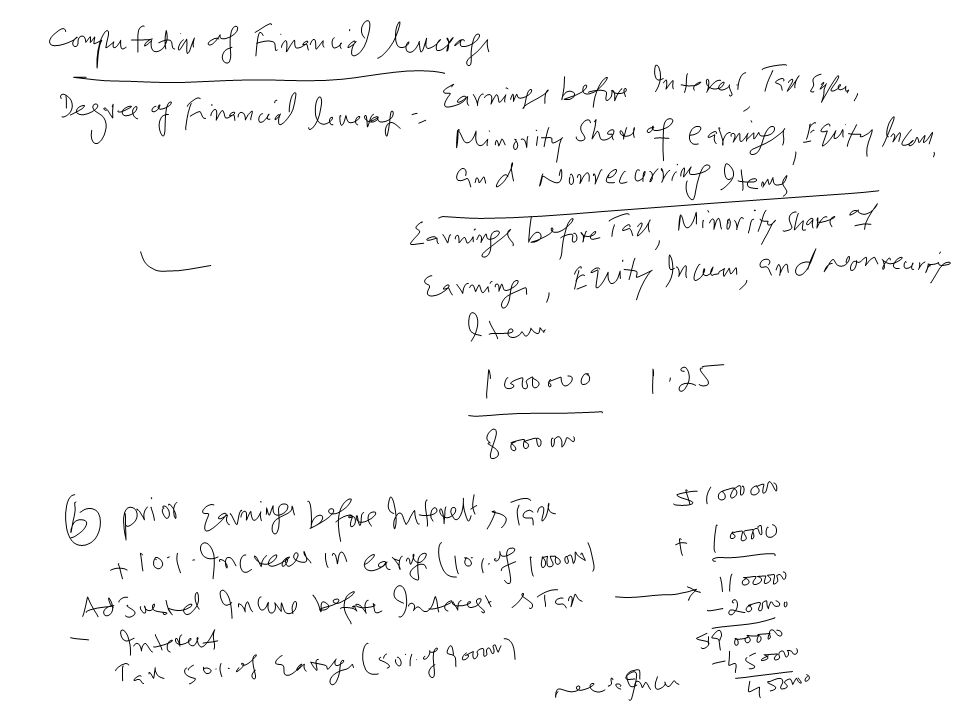
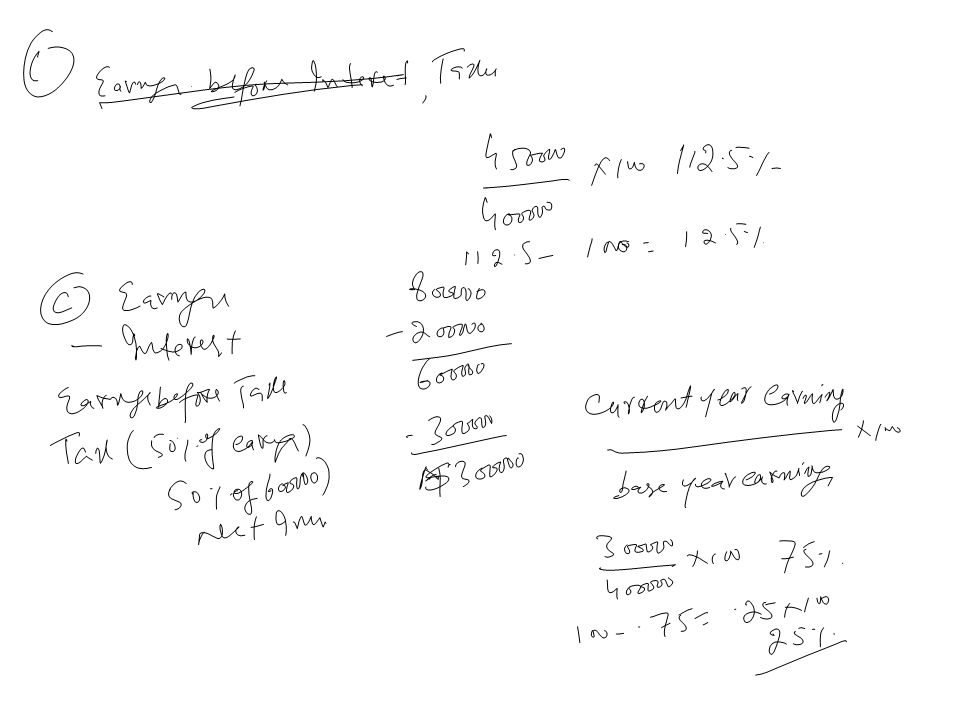
Practical Exercise A firm has earnings before interest and tax of $1,000,000, interest of $200,000 and net income of $400,000 in year 1. Tax rate 50%. Required Calculate the degree of financial leverage in base year 1. If earnings before interest and tax increase by 10% in year 2 what will be the new level of earnings , assuming the same tax rate as in year 1? 3. If earnings before interest and tax decrease to $ 800,000 in year 2, what will be the new level of earnings assuming the same tax rate as in year 1?

16
Practical Exercise Dicker Company has the following pattern of financial data for year 1 and 2: Year 1 Year 2 Net Income $ $ 42,000 Preferred stock (5%) $450,000 $550,000 Weighted average number of common share outstanding 38, ,500 Required Calculate earnings per share and comment on the trend
 $450,000 $550,000. Weighted average number of. common share outstanding 38,000 38,500. Required. Calculate earnings per share and comment on the trend.")
18
The decline in earnings per share is caused mainly by the issuance of preferred stock and partially by a rise in the common shares.

19
Practical Exercise Assume the following fact for the current year:
Common shares outstanding on January 1, 50,000 shares July 1, 2- for- 1 stock split. October 1, a stock issue of 10,000 shares Required Compute the denominator of the earnings per share computation for the current year.

21
Practical Exercise XYZ corporation reported earnings per share of $ 2.00 in 2002 in In XYZ Corporation reported earnings per share $ for 1 stock splits were declared on July 1, 2003 and December 31,2003. Required Present the earnings per share for a tow year comparative income statement that includes 2003 and 2002.

23
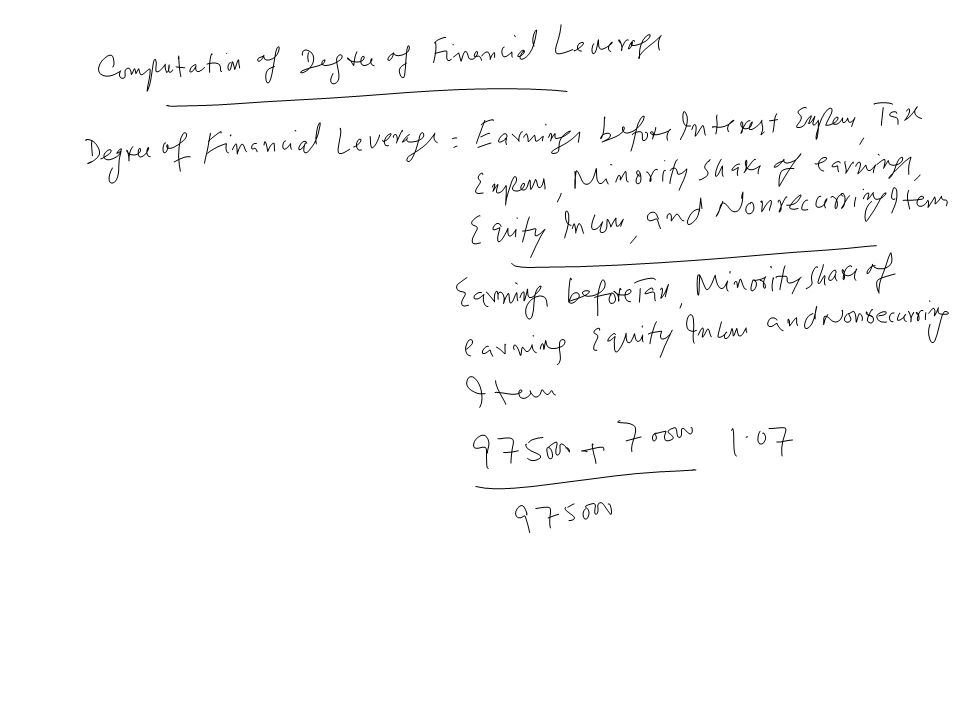
Practical Exercise ABC Company shows the following condensed Income statement information for the current year: Revenue from sales $3,500,000 Cost of production sold (1,700,000) Gross profit ,800,000 Operatinexpenses: Selling expenses $425,000 General expenses $350,000 (775,000) Operating income $1,025,000 Other income ,000 Interest (70,000) Operating income before taxes ,000 Taxes related to operations (335,000) Income from operations ,000 Extraordinary loss (less applicable income taxes of $ 40,000) (80,000) Income before minority interest ,000 Minority share of earnings (50,000) Net Income $ 510,000 Required: Calculate the degree of financial leverage.
 Gross profit 1,800,000. Operatinexpenses: Selling expenses $425,000. General expenses $350,000 (775,000) Operating income $1,025,000. Other income 20,000. Interest (70,000) Operating income before taxes 975,000. Taxes related to operations (335,000) Income from operations 640,000. Extraordinary loss (less applicable income. taxes of $ 40,000) (80,000) Income before minority interest 560,000. Minority share of earnings (50,000) Net Income $ 510,000. Required: Calculate the degree of financial leverage.")
25
Analysis for the Investor
Lecture Summary Analysis for the Investor Definition of Financial Leverage, Computation of Financial Leverage, Earnings per common share, Practical Exercise

Similar presentations