Download presentation
Presentation is loading. Please wait.

1
Coastal vulnerability assessments for England and Wales: the National Coastal Erosion Risk Mapping Project (NCERM) Coastal Groups
 Coastal Groups")
2
Key drivers for better assessment: Shoreline Management Plans and spatial planning (1995 ongoing): 100 year horizons ‘Making Space for Water’ Government Strategy (2005): adaptation and public awareness Environment Agency ‘strategic overview of all flood and coastal risk management (2008): gaps in national assessment
: 100 year horizons ‘Making Space for Water’ Government Strategy (2005): adaptation and public awareness Environment Agency ‘strategic overview of all flood and coastal risk management (2008): gaps in national assessment")
3
National Coastal Erosion Risk Mapping Web-based tool to complement Environment Agency Flood Map ‘Comparison Report’ to highlight differences with Shoreline Management Plans High level statistics for local authorities

4
A staged approach Stage 1 – FD2324 RACE R&D Project [April 2006] Stage 2 – Inception Phase [July 2006] Stage 3 – Create Baseline Position (Software and Data) [June 2007] Stage 4 – First National Runs [December 2007] Stage 5 – Local Validation [2009-2010] Stage 6 – Finalise Data [current] Stage 7 – National Coastal Erosion Risk Mapping tool [September 2011] Coastal Groups
![A staged approach Stage 1 – FD2324 RACE R&D Project [April 2006] Stage 2 – Inception Phase [July 2006] Stage 3 – Create Baseline Position (Software and Data) [June 2007] Stage 4 – First National Runs [December 2007] Stage 5 – Local Validation [ ] Stage 6 – Finalise Data [current] Stage 7 – National Coastal Erosion Risk Mapping tool [September 2011] Coastal Groups](http://images.slideplayer.com/21/6298171/slides/slide_4.jpg "A staged approach Stage 1 – FD2324 RACE R&D Project [April 2006] Stage 2 – Inception Phase [July 2006] Stage 3 – Create Baseline Position (Software and Data) [June 2007] Stage 4 – First National Runs [December 2007] Stage 5 – Local Validation [ ] Stage 6 – Finalise Data [current] Stage 7 – National Coastal Erosion Risk Mapping tool [September 2011] Coastal Groups")
5
Risk Assessment of Coastal Erosion (RACE) Defra project FD2324 Source: techniques for assessing unconstrained erosion and defence failure Pathway: brings these together to establish probability within confidence bands Receptor: analysis of socio- economic/ecological consequences
 Defra project FD2324 Source: techniques for assessing unconstrained erosion and defence failure Pathway: brings these together to establish probability within confidence bands Receptor: analysis of socio- economic/ecological consequences")
6
Risk Assessment of Coastal Erosion (RACE) Defra project FD2324 Variety of outputs, but these are only as good as the data validation and resolution
 Defra project FD2324 Variety of outputs, but these are only as good as the data validation and resolution")
7
Risk Assessment of Coastal Erosion (RACE) Defra project FD2324 Robust and consistent approach; Designed for high spatial resolution, but able to aggregate local results to inform high level assessments; Addresses 20, 50 and 100 year horizons; Limited to erosion but complements tools used for flood risk assessment in England and Wales; Assesses erosion of backshore landform but may be developed further to incorporate foreshore impacts Risk assessment combines hazard and impacts;
 Defra project FD2324 Robust and consistent approach; Designed for high spatial resolution, but able to aggregate local results to inform high level assessments; Addresses 20, 50 and 100 year horizons; Limited to erosion but complements tools used for flood risk assessment in England and Wales; Assesses erosion of backshore landform but may be developed further to incorporate foreshore impacts Risk assessment combines hazard and impacts;")
8
Risk Assessment of Coastal Erosion (RACE) Defra project FD2324 Can be reviewed in the context of SMPs to accommodate effects of adaptive responses; Inputs can range from qualitative assessments to probabilistic models and a range of assumptions/scenarios can be tested; Considers climate change through sensitivity testing Assesses uncertainties such as erosion ‘catch up’ after defence failure. Hierarchy of analytical methods allows proportionality of assessment according to risk, scale and data availability;

9
Stage 2: Inception and consultation End-User Consultation Initial best estimate of erosion rates Editing and review at local level Developing a web-based interface for testing Coastal Groups

10
Stage 3: Create baseline position Spatial Data OS MasterMap Aerial Photography (EA Twerton) Recession Data Futurecoast Defence Data National Flood & Coastal Defence Database Bespoke LA Data Key Statistics produced 6,256km of coastline (England and Wales) 2,900km (46%) at risk from erosion 2,354km undefended 546km defended Coastal Groups
 Recession Data Futurecoast Defence Data National Flood & Coastal Defence Database Bespoke LA Data Key Statistics produced 6,256km of coastline (England and Wales) 2,900km (46%) at risk from erosion 2,354km undefended 546km defended Coastal Groups")
11
Stage 4: First national runs First National Coastal Erosion ‘Maps’ using two scenarios No Defences No Active Intervention National Data Limitations Defence Data 39% defended coastline could not produce any results Recession Data Futurecoast was a high-level study Spatial Data National aerial photography dataset out of date Coastal Groups

12
Stage 5: local validation Local Validation #2 Validate initial coastline position Validate defence data Validate recession information Re-run RACE Model View indicative results Provide feedback Coastal Groups

13
Stage 5 cont’d: local validation tool

14
Stage 6: Final validation To ensure local authority officers are satisfied with the accuracy of final outputs Facilitated by local authority ‘champions’ and Environment Agency regional project leads Final outputs will be released from September 2011, starting with two ‘pilot Shoreline Management Plan areas in the NE and south. Coastal Groups

15
How do we show the risk from erosion? PROFESSIONAL PRODUCTS: 2 scenarios within the GIS No Active Intervention ‘baseline’ scenario SMP2 policies factored in Erosion predictions for 3 epochs: 0 – 20 years 20 – 50 years 50 – 100 years 3 confidence bands for each epoch 5% 50% 95% Coastal Groups PUBLIC-FACING INFORMATION: 1 scenario displayed SMP2 policies factored in Erosion predictions for 1 epoch: 0 – 20 years Upper and lower percentile confidence limits quoted as a range 5% 95%

16
Fundamental disagreement Zoomed out is more representative of the level of confidence in the data The professionals recommend.....What the public want..... Zoomed in the only thing they felt was useful. They’re not interested in regional abstractions, but want to know about their house. Coastal Groups

17
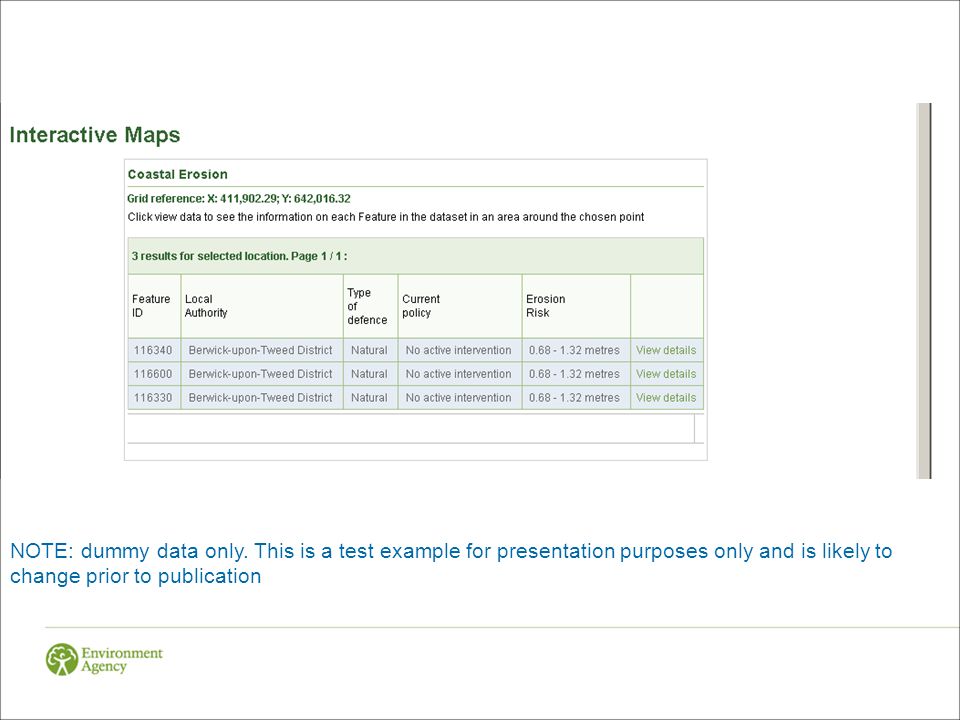
Complex information Epochs Range of erosion rates / confidence bands Scenarios Unrealistic impression of certainty Doesn’t reflect what really happens Interactive web tool chosen instead… Concerns about existing presentation

18
NOTE: dummy data only. This is a test example for presentation purposes only and is likely to change prior to publication

20
“We are improving our understanding of coastal erosion using local knowledge and the best available science, and raising awareness now, so that we can all adapt together to our changing coast…” Coastal Groups

Similar presentations