Download presentation
Presentation is loading. Please wait.

1
Population Change in the United States:
Implications for Refuge, Recreational and Socioeconomic Development Steve H. Murdock, Ph.D. Director, Hobby Center for the Study of Texas and Allyn and Gladys Cline Professor of Sociology Rice University U. S. Fish and Wildlife Service Urban Academy Morgantown, West Virginia September 23, 2013

2
Total Population and Percent Population Change in Texas and the United States, 1850-2010
Total Population Percent Change Year Texas U.S. 1850 212,592 23,191,876 --- 1860 604,215 31,443,321 184.2 35.6 1870 818,579 39,818,449 35.5 26.6 1880 1,591,749 50,155,783 94.5 26.0 1890 2,235,527 62,947,714 40.4 25.5 1900 3,048,710 75,994,575 36.4 20.7 1910 3,896,542 91,972,266 27.8 21.0 1920 4,663,228 105,710,620 19.7 14.9 1930 5,824,715 122,775,046 24.9 16.1 1940 6,414,824 131,669,275 10.1 7.2 1950 7,711,194 150,697,361 20.2 14.5 1960 9,579,677 179,323,175 24.2 19.0 1970 11,196,730 203,302,031 16.9 13.4 1980 14,229,191 226,545,805 27.1 11.4 1990 16,986,510 248,709,873 19.4 9.8 2000 20,851,820 281,421,906 22.8 13.2 2010 25,145,561 308,745,538 20.6 9.7 Source: Derived from the U.S. Census Bureau decennial census April 1 of reported year.

3
Estimates of the Unauthorized Population
in the United States,

4
Ten States in the United States with the
Largest Numeric Population Increase Change State 2000 Population 2010 Population Numeric Percent United States 281,421,906 308,745,538 27,323,632 9.7 Texas 20,851,820 25,145,561 4,293,741 20.6 California 33,871,648 37,253,956 3,382,308 10.0 Florida 15,982,378 18,801,310 2,818,932 17.6 Georgia 8,186,453 9,687,653 1,501,200 18.3 North Carolina 8,049,313 9,535,483 1,486,170 18.5 Arizona 5,130,632 6,392,017 1,261,385 24.6 Virginia 7,078,515 8,001,024 922,509 13.0 Washington 5,894,121 6,724,540 830,419 14.1 Colorado 4,301,261 5,029,196 727,935 16.9 Nevada 1,998,257 2,700,551 702,294 35.1 Population values as of April 1, 2000 and April 1, 2010. Source: U.S. Census Bureau

5
Ten States in the United States with the
Largest Percentage Population Increase Change State 2000 Population 2010 Population Numeric Percent United States 281,421,906 308,745,538 27,323,632 9.7 Nevada 1,998,257 2,700,551 702,294 35.1 Arizona 5,130,632 6,392,017 1,261,385 24.6 Utah 2,233,169 2,763,885 530,716 23.8 Idaho 1,293,953 1,567,582 273,629 21.1 Texas 20,851,820 25,145,561 4,293,741 20.6 North Carolina 8,049,313 9,535,483 1,486,170 18.5 Georgia 8,186,453 9,687,653 1,501,200 18.3 Florida 15,982,378 18,801,310 2,818,932 17.6 Colorado 4,301,261 5,029,196 727,935 16.9 South Carolina 4,012,012 4,625,364 613,352 15.3 Population values as of April 1, 2000 and April 1, 2010. Source: U.S. Census Bureau

6
Population 2000 and 2010 and Population Change for the Ten Most Populous Incorporated Places in the United States Place Population Change 2000 2010 Number Percent New York , NY 8,008,278 8,175,133 166,855 2.1 Los Angeles , CA 3,694,820 3,792,621 97,801 2.6 Chicago , IL 2,896,016 2,695,598 -200,418 -6.9 Houston , TX 1,953,631 2,099,451 145,820 7.5 Philadelphia , PA 1,517,550 1,526,006 8,456 0.6 Phoenix , AZ 1,321,045 1,445,632 124,587 9.4 San Antonio , TX 1,144,646 1,327,407 182,761 16.0 San Diego , CA 1,223,400 1,307,402 84,002 6.9 Dallas , TX 1,188,580 1,197,816 9,236 0.8 San Jose , CA 894,943 945,942 50,999 5.7 Source: U.S. Census 2000 & 2010, P.L.

8
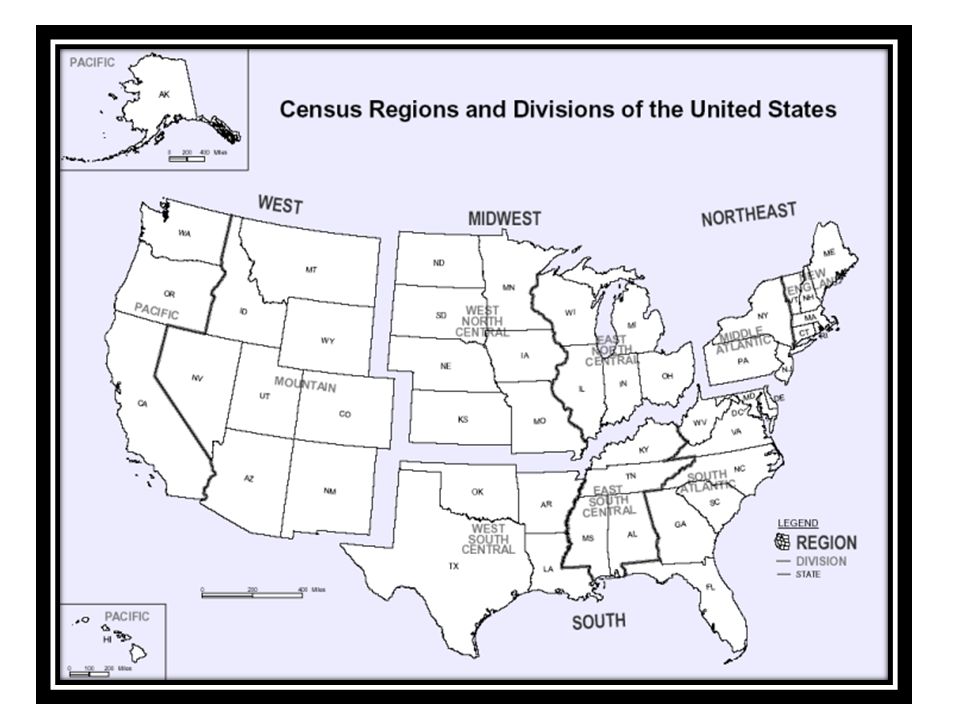
Population Change by Region, 2000-2010
Change State 2000 Population 2010 Population Numeric Percent United States 281,421,906 308,745,538 27,323,632 9.7 Northeast 53,594,378 55,317,240 1,722,862 3.2 Midwest 64,392,776 66,927,001 2,534,225 3.9 South 100,236,820 114,555,744 14,318,924 14.3 West 63,197,932 71,945,553 8,747,621 13.8 Population values as of April 1, 2000 and April 1, 2010. Source: U.S. Census Bureau Hobby Center for the Study of Texas at Rice University

9
Regional Population Change as a Proportion of U. S
Regional Population Change as a Proportion of U.S. Population Change,

10
Annual Estimates and Annualized Rates of Change for the Population
of the United States and Regions: April 1, 2010 to July 1, 2012 27-month Change Annualized Change 2010 2012 Region Population Numeric Percent United States 308,745,538 313,914,040 5,168,502 1.7 4,594,224 1.5 Northeast 55,317,240 55,761,091 443,851 0.8 394,534 0.7 Midwest 66,927,001 67,316,297 389,296 0.6 346,041 0.5 South 114,555,744 117,257,221 2,701,477 2.4 2,401,313 2.1 West 71,945,553 73,579,431 1,633,878 2.3 1,452,336 2.0 Population values as of April 1, 2010 and July 1, 2012. Source: U.S. Census Bureau

11
Ten States in the United States with the
Largest Numeric Population Increase 27-month Change Annualized Change 2010 2012 State Population Numeric Percent United States 308,745,538 313,914,040 5,168,502 1.7 4,594,224 1.5 Texas 25,145,561 26,059,203 913,642 3.6 812,126 3.2 California 37,253,956 38,041,430 787,474 2.1 699,977 1.9 Florida 18,801,310 19,317,568 516,258 2.7 458,896 2.4 Georgia 9,687,653 9,919,945 232,292 206,482 North Carolina 9,535,483 9,752,073 216,590 2.3 192,524 2.0 New York 19,378,102 19,570,261 192,159 1.0 170,808 0.9 Virginia 8,001,024 8,185,867 184,843 164,305 Washington 6,724,540 6,897,012 172,472 2.6 153,308 Arizona 6,392,017 6,553,255 161,238 2.5 143,323 2.2 Colorado 5,029,196 5,187,582 158,386 3.1 140,788 2.8 Population values as of April 1, 2010 and July 1, 2012. Source: U.S. Census Bureau

12
Ten States in the United States with the
Largest Percentage Population Increase 27-month Change Annualized Change 2010 2012 State Population Numeric Percent United States 308,745,538 313,914,040 5,168,502 1.7 4,594,224 1.5 North Dakota 672,591 699,628 27,037 4.0 24,033 3.6 Texas 25,145,561 26,059,203 913,642 812,126 3.2 Utah 2,763,885 2,855,287 91,402 3.3 81,246 2.9 Colorado 5,029,196 5,187,582 158,386 3.1 140,788 2.8 Alaska 710,231 731,449 21,218 3.0 18,860 2.7 Florida 18,801,310 19,317,568 516,258 458,896 2.4 Washington 6,724,540 6,897,012 172,472 2.6 153,308 2.3 Arizona 6,392,017 6,553,255 161,238 2.5 143,323 2.2 Georgia 9,687,653 9,919,945 232,292 206,482 2.1 South Dakota 814,180 833,354 19,174 17,044 Population values as of April 1, 2010 and July 1, 2012. Source: U.S. Census Bureau

13
Population, Population Change, and Proportion of the Total
Population by Race/Ethnicity for Texas, 2000 and 2010 Population Population Change Percent of Total Population Race/Ethnicity* 2000 2010 Numeric Percent Percent of Total Change NH White 10,933,313 11,397,345 464,032 4.2 10.8 52.4 45.3 Hispanic (All Races) 6,669,666 9,460,921 2,791,255 41.8 65.0 32.0 37.6 NH Black 2,364,255 2,886,825 522,570 22.1 12.2 11.3 11.5 NH Asian 554,445 948,426 393,981 71.1 9.2 2.7 3.8 NH Other 330,141 452,044 121,903 36.9 2.8 1.6 1.8 Total 20,851,820 25,145,561 4,293,741 20.6 100.0 *Hispanic includes persons of all races. All other race/ethnicity categories shown here are Non-Hispanic. Non-Hispanic Other includes persons identifying themselves as Non-Hispanic American Indian or Alaska Native, Non-Hispanic Native Hawaiian or Pacific Islander, Non-Hispanic Some Other Race, or Non-Hispanic and a combination of two or more races. Source: U.S. Census 2000 and 2010, P.L. Prepared by the Hobby Center for the Study of Texas at Rice University
 6,669,666. 9,460,921. 2,791, NH Black. 2,364,255. 2,886, , NH Asian. 554, , , NH Other. 330, , , Total. 20,851, ,145,561. 4,293, *Hispanic includes persons of all races. All other race/ethnicity categories shown here are Non-Hispanic. Non-Hispanic Other includes persons identifying themselves as Non-Hispanic American Indian or Alaska Native, Non-Hispanic Native Hawaiian or Pacific Islander, Non-Hispanic Some Other Race, or Non-Hispanic and a combination of two or more races. Source: U.S. Census 2000 and 2010, P.L Prepared by the Hobby Center for the Study of Texas at Rice University")
14
Population, Population Change, and Proportion of the Population
Under 18 Years by Race/Ethnicity for Texas, 2000 and 2010 Population Population Change Percent of Total Population Race/Ethnicity* 2000 2010 Numeric Percent Percent of Total Change NH White 2,507,147 2,322,661 -184,486 -7.4 -18.8 42.6 33.8 Hispanic (All Races) 2,386,765 3,317,777 931,012 39.0 95.1 40.5 48.3 NH Black 732,807 810,543 77,736 10.6 7.9 12.4 11.8 NH Asian 139,226 231,458 92,232 66.2 9.4 2.4 3.4 NH Other 120,814 183,385 62,571 51.8 6.4 2.1 2.7 Total 5,886,759 6,865,824 979,065 16.6 100.0 *Hispanic includes persons of all races. All other race/ethnicity categories shown here are Non-Hispanic. Non-Hispanic Other includes persons identifying themselves as Non-Hispanic American Indian or Alaska Native, Non-Hispanic Native Hawaiian or Pacific Islander, Non-Hispanic Some Other Race, or Non-Hispanic and a combination of two or more races. Source: U.S. Census 2000 and 2010, P.L. Prepared by the Hobby Center for the Study of Texas at Rice University
 2,386,765. 3,317, , NH Black. 732, , , NH Asian. 139, , , NH Other. 120, , , Total. 5,886,759. 6,865, , *Hispanic includes persons of all races. All other race/ethnicity categories shown here are Non-Hispanic. Non-Hispanic Other includes persons identifying themselves as Non-Hispanic American Indian or Alaska Native, Non-Hispanic Native Hawaiian or Pacific Islander, Non-Hispanic Some Other Race, or Non-Hispanic and a combination of two or more races. Source: U.S. Census 2000 and 2010, P.L Prepared by the Hobby Center for the Study of Texas at Rice University")
19
Percent of Total Population Percent of Total Change
Population, Population Change, and Proportion of the Total Population by Race/Ethnicity for the United States, 2000 and 2010 Population Population Change Percent of Total Population Race/Ethnicity* 2000 2010 Numeric Percent Percent of Total Change NH White 194,552,774 196,817,552 2,264,778 1.2 8.3 69.1 63.7 Hispanic (All Races) 35,305,818 50,477,594 15,171,776 43.0 55.5 12.5 16.3 NH Black 33,947,837 37,685,848 3,738,011 11.0 13.7 12.1 12.2 NH Asian 10,123,169 14,465,124 4,341,955 42.9 15.9 3.6 4.7 NH Other 7,492,308 9,299,420 1,807,112 24.1 6.6 2.7 3.0 Total 281,421,906 308,745,538 27,323,632 9.7 100.0 *Hispanic includes persons of all races. All other race/ethnicity categories shown here are Non-Hispanic. Non-Hispanic Other includes persons identifying themselves as Non-Hispanic American Indian or Alaska Native, Non-Hispanic Native Hawaiian or Pacific Islander, Non-Hispanic Some Other Race, or Non-Hispanic and a combination of two or more races. Source: U.S. Census 2000 and 2010, P.L. Prepared by the Hobby Center for the Study of Texas at Rice University
 35,305, ,477, ,171, NH Black. 33,947, ,685,848. 3,738, NH Asian. 10,123, ,465,124. 4,341, NH Other. 7,492,308. 9,299,420. 1,807, Total. 281,421, ,745, ,323, *Hispanic includes persons of all races. All other race/ethnicity categories shown here are Non-Hispanic. Non-Hispanic Other includes persons identifying themselves as Non-Hispanic American Indian or Alaska Native, Non-Hispanic Native Hawaiian or Pacific Islander, Non-Hispanic Some Other Race, or Non-Hispanic and a combination of two or more races. Source: U.S. Census 2000 and 2010, P.L Prepared by the Hobby Center for the Study of Texas at Rice University")
20
Population, Population Change, and Proportion of the Population
Under 18 Years by Race/Ethnicity for the United States, 2000 and 2010 Population Population Change Percent of Total Population Race/Ethnicity* 2000 2010 Numeric Percent Percent of Total Change NH White 44,027,087 39,716,562 -4,310,525 -9.8 -228.4 60.9 53.5 Hispanic (All Races) 12,342,259 17,130,891 4,788,632 38.8 253.7 17.1 23.1 NH Black 10,610,264 10,362,183 -248,081 -2.3 -13.1 14.7 14.0 NH Asian 2,420,274 3,176,129 755,855 31.2 40.0 3.3 4.3 NH Other 2,893,928 3,795,702 901,774 47.8 4.0 5.1 Total 72,293,812 74,181,467 1,887,655 2.6 100.0 *Hispanic includes persons of all races. All other race/ethnicity categories shown here are Non-Hispanic. Non-Hispanic Other includes persons identifying themselves as Non-Hispanic American Indian or Alaska Native, Non-Hispanic Native Hawaiian or Pacific Islander, Non-Hispanic Some Other Race, or Non-Hispanic and a combination of two or more races. Source: U.S. Census 2000 and 2010, P.L. Prepared by the Hobby Center for the Study of Texas at Rice University
 12,342, ,130,891. 4,788, NH Black. 10,610, ,362, , NH Asian. 2,420,274. 3,176, , NH Other. 2,893,928. 3,795, , Total. 72,293, ,181,467. 1,887, *Hispanic includes persons of all races. All other race/ethnicity categories shown here are Non-Hispanic. Non-Hispanic Other includes persons identifying themselves as Non-Hispanic American Indian or Alaska Native, Non-Hispanic Native Hawaiian or Pacific Islander, Non-Hispanic Some Other Race, or Non-Hispanic and a combination of two or more races. Source: U.S. Census 2000 and 2010, P.L Prepared by the Hobby Center for the Study of Texas at Rice University")
25
Percent of Total Population Percent of Total Change
Population, Population Change, and Proportion of the Total Population by Race/Ethnicity for Northeast Region, 2000 and 2010 Population Population Change Percent of Total Population Race/Ethnicity* 2000 2010 Numeric Percent Percent of Total Change NH White 39,327,262 38,008,094 -1,319,168 -3.4 -76.6 73.4 68.7 Hispanic (All Races) 5,254,087 6,991,969 1,737,882 33.1 100.9 9.8 12.6 NH Black 5,784,768 6,049,443 264,675 4.6 15.4 10.8 10.9 NH Asian 2,102,977 3,033,441 930,464 44.2 54.0 3.9 5.5 NH Other 1,125,284 1,234,293 109,009 9.7 6.3 2.1 2.2 Total 53,594,378 55,317,240 1,722,862 3.2 100.0 *Hispanic includes persons of all races. All other race/ethnicity categories shown here are Non-Hispanic. Non-Hispanic Other includes persons identifying themselves as Non-Hispanic American Indian or Alaska Native, Non-Hispanic Native Hawaiian or Pacific Islander, Non-Hispanic Some Other Race, or Non-Hispanic and a combination of two or more races. Source: U.S. Census 2000 and 2010, P.L. Prepared by the Hobby Center for the Study of Texas at Rice University
 5,254,087. 6,991,969. 1,737, NH Black. 5,784,768. 6,049, , NH Asian. 2,102,977. 3,033, , NH Other. 1,125,284. 1,234, , Total. 53,594, ,317,240. 1,722, *Hispanic includes persons of all races. All other race/ethnicity categories shown here are Non-Hispanic. Non-Hispanic Other includes persons identifying themselves as Non-Hispanic American Indian or Alaska Native, Non-Hispanic Native Hawaiian or Pacific Islander, Non-Hispanic Some Other Race, or Non-Hispanic and a combination of two or more races. Source: U.S. Census 2000 and 2010, P.L Prepared by the Hobby Center for the Study of Texas at Rice University")
26
Percent of Total Population Percent of Total Change
Population, Population Change, and Proportion of the Total Population Less Than Age 18 by Race/Ethnicity for Northeast Region, 2000 and 2010 Population Population Change Percent of Total Population Race/Ethnicity* 2000 2010 Numeric Percent Percent of Total Change NH White 8,697,548 7,469,614 -1,227,934 -14.1 171.8 66.7 60.6 Hispanic (All Races) 1,702,090 2,133,781 431,691 25.4 -60.4 13.0 17.3 NH Black 1,740,364 1,563,301 -177,063 -10.2 24.8 13.3 12.7 NH Asian 507,100 673,096 165,996 32.7 -23.2 3.9 5.5 NH Other 400,681 493,400 92,719 23.1 -13.0 3.1 4.0 Total 13,047,783 12,333,192 -714,591 -5.5 100.0 *Hispanic includes persons of all races. All other race/ethnicity categories shown here are Non-Hispanic. Non-Hispanic Other includes persons identifying themselves as Non-Hispanic American Indian or Alaska Native, Non-Hispanic Native Hawaiian or Pacific Islander, Non-Hispanic Some Other Race, or Non-Hispanic and a combination of two or more races. Source: U.S. Census 2000 and 2010, P.L. Prepared by the Hobby Center for the Study of Texas at Rice University
 1,702,090. 2,133, , NH Black. 1,740,364. 1,563, , NH Asian. 507, , , NH Other. 400, , , Total. 13,047, ,333, , *Hispanic includes persons of all races. All other race/ethnicity categories shown here are Non-Hispanic. Non-Hispanic Other includes persons identifying themselves as Non-Hispanic American Indian or Alaska Native, Non-Hispanic Native Hawaiian or Pacific Islander, Non-Hispanic Some Other Race, or Non-Hispanic and a combination of two or more races. Source: U.S. Census 2000 and 2010, P.L Prepared by the Hobby Center for the Study of Texas at Rice University")
27
Percent of Total Population Percent of Total Change
Population, Population Change, and Proportion of the Total Population by Race/Ethnicity for Midwest Region, 2000 and 2010 Population Population Change Percent of Total Population Race/Ethnicity* 2000 2010 Numeric Percent Percent of Total Change NH White 52,386,131 52,096,633 -289,498 -0.6 -11.4 81.4 77.8 Hispanic (All Races) 3,124,532 4,661,678 1,537,146 49.2 60.7 4.9 7.0 NH Black 6,437,060 6,843,367 406,307 6.3 16.0 10.0 10.2 NH Asian 1,187,645 1,713,429 525,784 44.3 20.7 1.8 2.6 NH Other 1,257,408 1,611,894 354,486 28.2 14.0 2.0 2.4 Total 64,392,776 66,927,001 2,534,225 3.9 100.0 *Hispanic includes persons of all races. All other race/ethnicity categories shown here are Non-Hispanic. Non-Hispanic Other includes persons identifying themselves as Non-Hispanic American Indian or Alaska Native, Non-Hispanic Native Hawaiian or Pacific Islander, Non-Hispanic Some Other Race, or Non-Hispanic and a combination of two or more races. Source: U.S. Census 2000 and 2010, P.L. Prepared by the Hobby Center for the Study of Texas at Rice University
 3,124,532. 4,661,678. 1,537, NH Black. 6,437,060. 6,843, , NH Asian. 1,187,645. 1,713, , NH Other. 1,257,408. 1,611, , Total. 64,392, ,927,001. 2,534, *Hispanic includes persons of all races. All other race/ethnicity categories shown here are Non-Hispanic. Non-Hispanic Other includes persons identifying themselves as Non-Hispanic American Indian or Alaska Native, Non-Hispanic Native Hawaiian or Pacific Islander, Non-Hispanic Some Other Race, or Non-Hispanic and a combination of two or more races. Source: U.S. Census 2000 and 2010, P.L Prepared by the Hobby Center for the Study of Texas at Rice University")
28
Percent of Total Population Percent of Total Change
Population, Population Change, and Proportion of the Total Population Less Than Age 18 by Race/Ethnicity for Midwest Region, 2000 and 2010 Population Population Change Percent of Total Population Race/Ethnicity* 2000 2010 Numeric Percent Percent of Total Change NH White 12,525,389 11,172,169 -1,353,220 -10.8 260.5 75.2 69.3 Hispanic (All Races) 1,157,274 1,772,526 615,252 53.2 -118.4 7.0 11.0 NH Black 2,097,634 1,989,272 -108,362 -5.2 20.9 12.6 12.3 NH Asian 322,798 433,818 111,020 34.4 -21.4 1.9 2.7 NH Other 544,571 760,323 215,752 39.6 -41.5 3.3 4.7 Total 16,647,666 16,128,108 -519,558 -3.1 100.0 *Hispanic includes persons of all races. All other race/ethnicity categories shown here are Non-Hispanic. Non-Hispanic Other includes persons identifying themselves as Non-Hispanic American Indian or Alaska Native, Non-Hispanic Native Hawaiian or Pacific Islander, Non-Hispanic Some Other Race, or Non-Hispanic and a combination of two or more races. Source: U.S. Census 2000 and 2010, P.L. Prepared by the Hobby Center for the Study of Texas at Rice University
 1,157,274. 1,772, , NH Black. 2,097,634. 1,989, , NH Asian. 322, , , NH Other. 544, , , Total. 16,647, ,128, , *Hispanic includes persons of all races. All other race/ethnicity categories shown here are Non-Hispanic. Non-Hispanic Other includes persons identifying themselves as Non-Hispanic American Indian or Alaska Native, Non-Hispanic Native Hawaiian or Pacific Islander, Non-Hispanic Some Other Race, or Non-Hispanic and a combination of two or more races. Source: U.S. Census 2000 and 2010, P.L Prepared by the Hobby Center for the Study of Texas at Rice University")
29
Population, Population Change, and Proportion of the Total
Population by Race/Ethnicity for South Region, 2000 and 2010 Population Population Change Percent of Total Population Race/Ethnicity* 2000 2010 Numeric Percent Percent of Total Change NH White 65,927,794 68,706,462 2,778,668 4.2 19.4 65.8 60.0 Hispanic (All Races) 11,586,696 18,227,508 6,640,812 57.3 46.4 11.6 15.9 NH Black 18,766,614 21,578,475 2,811,861 15.0 19.6 18.7 18.8 NH Asian 1,900,258 3,170,814 1,270,556 66.9 8.9 1.9 2.8 NH Other 2,055,458 2,872,485 817,027 39.7 5.7 2.1 2.5 Total 100,236,820 114,555,744 14,318,924 14.3 100.0 *Hispanic includes persons of all races. All other race/ethnicity categories shown here are Non-Hispanic. Non-Hispanic Other includes persons identifying themselves as Non-Hispanic American Indian or Alaska Native, Non-Hispanic Native Hawaiian or Pacific Islander, Non-Hispanic Some Other Race, or Non-Hispanic and a combination of two or more races. Source: U.S. Census 2000 and 2010, P.L. Metropolitan Areas Defined by Office of Management and Budget, 2008. Prepared by the Hobby Center for the Study of Texas at Rice University
 11,586, ,227,508. 6,640, NH Black. 18,766, ,578,475. 2,811, NH Asian. 1,900,258. 3,170,814. 1,270, NH Other. 2,055,458. 2,872, , Total. 100,236, ,555, ,318, *Hispanic includes persons of all races. All other race/ethnicity categories shown here are Non-Hispanic. Non-Hispanic Other includes persons identifying themselves as Non-Hispanic American Indian or Alaska Native, Non-Hispanic Native Hawaiian or Pacific Islander, Non-Hispanic Some Other Race, or Non-Hispanic and a combination of two or more races. Source: U.S. Census 2000 and 2010, P.L Metropolitan Areas Defined by Office of Management and Budget, Prepared by the Hobby Center for the Study of Texas at Rice University")
30
Percent of Total Population Percent of Total Change
Population, Population Change, and Proportion of the Total Population Less Than Age 18 by Race/Ethnicity for South Region, 2000 and 2010 Population Population Change Percent of Total Population Race/Ethnicity* 2000 2010 Numeric Percent Percent of Total Change NH White 14,645,128 13,795,299 -849,829 -5.8 -38.2 57.3 49.6 Hispanic (All Races) 3,804,446 6,040,053 2,235,607 58.8 100.6 14.9 21.7 NH Black 5,880,858 6,001,210 120,352 2.0 5.4 23.0 21.6 NH Asian 463,792 750,996 287,204 61.9 12.9 1.8 2.7 NH Other 772,679 1,201,199 428,520 55.5 19.3 3.0 4.3 Total 25,566,903 27,788,757 2,221,854 8.7 100.0 *Hispanic includes persons of all races. All other race/ethnicity categories shown here are Non-Hispanic. Non-Hispanic Other includes persons identifying themselves as Non-Hispanic American Indian or Alaska Native, Non-Hispanic Native Hawaiian or Pacific Islander, Non-Hispanic Some Other Race, or Non-Hispanic and a combination of two or more races. Source: U.S. Census 2000 and 2010, P.L. Metropolitan Areas Defined by Office of Management and Budget, 2008. Prepared by the Hobby Center for the Study of Texas at Rice University
 3,804,446. 6,040,053. 2,235, NH Black. 5,880,858. 6,001, , NH Asian. 463, , , NH Other. 772,679. 1,201, , Total. 25,566, ,788,757. 2,221, *Hispanic includes persons of all races. All other race/ethnicity categories shown here are Non-Hispanic. Non-Hispanic Other includes persons identifying themselves as Non-Hispanic American Indian or Alaska Native, Non-Hispanic Native Hawaiian or Pacific Islander, Non-Hispanic Some Other Race, or Non-Hispanic and a combination of two or more races. Source: U.S. Census 2000 and 2010, P.L Metropolitan Areas Defined by Office of Management and Budget, Prepared by the Hobby Center for the Study of Texas at Rice University")
31
Percent of Total Population Percent of Total Change
Population, Population Change, and Proportion of the Total Population by Race/Ethnicity for West Region, 2000 and 2010 Population Population Change Percent of Total Population Race/Ethnicity* 2000 2010 Numeric Percent Percent of Total Change NH White 36,911,587 38,006,363 1,094,776 3.0 12.5 58.4 52.8 Hispanic (All Races) 15,340,503 20,596,439 5,255,936 34.3 60.1 24.3 28.6 NH Black 2,959,395 3,214,563 255,168 8.6 2.9 4.7 4.5 NH Asian 4,932,289 6,547,440 1,615,151 32.7 18.5 7.8 9.1 NH Other 3,054,158 3,580,748 526,590 17.2 6.0 4.8 5.0 Total 63,197,932 71,945,553 8,747,621 13.8 100.0 *Hispanic includes persons of all races. All other race/ethnicity categories shown here are Non-Hispanic. Non-Hispanic Other includes persons identifying themselves as Non-Hispanic American Indian or Alaska Native, Non-Hispanic Native Hawaiian or Pacific Islander, Non-Hispanic Some Other Race, or Non-Hispanic and a combination of two or more races. Source: U.S. Census 2000 and 2010, P.L. Prepared by the Hobby Center for the Study of Texas at Rice University
 15,340, ,596,439. 5,255, NH Black. 2,959,395. 3,214, , NH Asian. 4,932,289. 6,547,440. 1,615, NH Other. 3,054,158. 3,580, , Total. 63,197, ,945,553. 8,747, *Hispanic includes persons of all races. All other race/ethnicity categories shown here are Non-Hispanic. Non-Hispanic Other includes persons identifying themselves as Non-Hispanic American Indian or Alaska Native, Non-Hispanic Native Hawaiian or Pacific Islander, Non-Hispanic Some Other Race, or Non-Hispanic and a combination of two or more races. Source: U.S. Census 2000 and 2010, P.L Prepared by the Hobby Center for the Study of Texas at Rice University")
32
Percent of Total Population Percent of Total Change
Population, Population Change, and Proportion of the Total Population Less Than Age 18 by Race/Ethnicity for West Region, 2000 and 2010 Population Population Change Percent of Total Population Race/Ethnicity* 2000 2010 Numeric Percent Percent of Total Change NH White 8,159,022 7,279,480 -879,542 -10.8 -97.7 47.9 40.6 Hispanic (All Races) 5,678,449 7,184,531 1,506,082 26.5 167.4 33.3 40.1 NH Black 891,408 808,400 -83,008 -9.3 -9.2 5.2 4.5 NH Asian 1,126,584 1,318,219 191,635 17.0 21.3 6.6 7.4 NH Other 1,175,997 1,340,780 164,783 14.0 18.3 6.9 7.5 Total 17,031,460 17,931,410 899,950 5.3 100.0 *Hispanic includes persons of all races. All other race/ethnicity categories shown here are Non-Hispanic. Non-Hispanic Other includes persons identifying themselves as Non-Hispanic American Indian or Alaska Native, Non-Hispanic Native Hawaiian or Pacific Islander, Non-Hispanic Some Other Race, or Non-Hispanic and a combination of two or more races. Source: U.S. Census 2000 and 2010, P.L. Prepared by the Hobby Center for the Study of Texas at Rice University
 5,678,449. 7,184,531. 1,506, NH Black. 891, , , NH Asian. 1,126,584. 1,318, , NH Other. 1,175,997. 1,340, , Total. 17,031, ,931, , *Hispanic includes persons of all races. All other race/ethnicity categories shown here are Non-Hispanic. Non-Hispanic Other includes persons identifying themselves as Non-Hispanic American Indian or Alaska Native, Non-Hispanic Native Hawaiian or Pacific Islander, Non-Hispanic Some Other Race, or Non-Hispanic and a combination of two or more races. Source: U.S. Census 2000 and 2010, P.L Prepared by the Hobby Center for the Study of Texas at Rice University")
33
Population, Population Change, and Proportion of the Total Population by Race/Ethnicity for Metropolitan Central City Counties in the United States, 2000 and 2010 Population Population Change Percent of Total Race/Ethnicity* 2000 2010 Numeric Percent Percent of Total Chg NH White 139,254,963 139,518,137 263,174 0.2 1.2 65.0 59.0 Hispanic (All Races) 31,556,176 44,653,790 13,097,614 41.5 59.4 14.7 18.9 NH Black 28,330,045 31,671,771 3,341,726 11.8 15.2 13.2 13.4 NH Asian 9,531,410 13,577,516 4,046,106 42.5 18.3 4.4 5.7 NH Other 5,563,357 6,855,391 1,292,034 23.2 5.9 2.6 2.9 Total 214,235,951 236,276,605 22,040,654 10.3 100.0 *Hispanic includes persons of all races. All other race/ethnicity categories shown here are Non-Hispanic. Non-Hispanic Other includes persons identifying themselves as Non-Hispanic American Indian or Alaska Native, Non-Hispanic Native Hawaiian or Pacific Islander, Non-Hispanic Some Other Race, or Non-Hispanic and a combination of two or more races. Source: U.S. Census 2000 & 2010, P.L Prepared by the Hobby Center for the Study of Texas at Rice University
 31,556, ,653, ,097, NH Black. 28,330, ,671,771. 3,341, NH Asian. 9,531, ,577,516. 4,046, NH Other. 5,563,357. 6,855,391. 1,292, Total. 214,235, ,276, ,040, *Hispanic includes persons of all races. All other race/ethnicity categories shown here are Non-Hispanic. Non-Hispanic Other includes persons identifying themselves as Non-Hispanic American Indian or Alaska Native, Non-Hispanic Native Hawaiian or Pacific Islander, Non-Hispanic Some Other Race, or Non-Hispanic and a combination of two or more races. Source: U.S. Census 2000 & 2010, P.L Prepared by the Hobby Center for the Study of Texas at Rice University")
34
Population, Population Change, and Proportion of the Population Under Age 18 by Race/Ethnicity for Metropolitan Central City Counties in the United States, 2000 and 2010 Population Population Change Percent of Total Race/Ethnicity* 2000 2010 Numeric Percent Percent of Total Chg NH White 30,849,683 27,506,006 -3,343,677 -10.8 -172.4 55.9 48.2 Hispanic (All Races) 10,972,723 15,001,612 4,028,889 36.7 207.7 19.9 26.3 NH Black 8,908,601 8,775,212 -133,389 -1.5 -6.9 16.2 15.4 NH Asian 2,275,874 2,973,879 698,005 30.7 36.0 4.1 5.2 NH Other 2,144,258 2,833,831 689,573 32.2 35.6 3.9 5.0 Total 55,151,139 57,090,540 1,939,401 3.5 100.0 *Hispanic includes persons of all races. All other race/ethnicity categories shown here are Non-Hispanic. Non-Hispanic Other includes persons identifying themselves as Non-Hispanic American Indian or Alaska Native, Non-Hispanic Native Hawaiian or Pacific Islander, Non-Hispanic Some Other Race, or Non-Hispanic and a combination of two or more races. Source: U.S. Census 2000 & 2010, P.L Prepared by the Hobby Center for the Study of Texas at Rice University
 10,972, ,001,612. 4,028, NH Black. 8,908,601. 8,775, , NH Asian. 2,275,874. 2,973, , NH Other. 2,144,258. 2,833, , Total. 55,151, ,090,540. 1,939, *Hispanic includes persons of all races. All other race/ethnicity categories shown here are Non-Hispanic. Non-Hispanic Other includes persons identifying themselves as Non-Hispanic American Indian or Alaska Native, Non-Hispanic Native Hawaiian or Pacific Islander, Non-Hispanic Some Other Race, or Non-Hispanic and a combination of two or more races. Source: U.S. Census 2000 & 2010, P.L Prepared by the Hobby Center for the Study of Texas at Rice University")
35
Population, Population Change, and Proportion of the Total Population by Race/Ethnicity for Metropolitan Suburban Counties in the United States, 2000 and 2010 Population Population Change Percent of Total Race/Ethnicity* 2000 2010 Numeric Percent Percent of Total Chg NH White 15,112,253 16,655,521 1,543,268 10.2 50.1 82.4 77.7 Hispanic (All Races) 1,117,114 2,003,979 886,865 79.4 28.8 6.1 9.4 NH Black 1,505,667 1,797,953 292,286 19.4 9.5 8.2 8.4 NH Asian 240,705 420,072 179,367 74.5 5.8 1.3 2.0 NH Other 368,250 547,655 179,405 48.7 2.6 Total 18,343,989 21,425,180 3,081,191 16.8 100.0 *Hispanic includes persons of all races. All other race/ethnicity categories shown here are Non-Hispanic. Non-Hispanic Other includes persons identifying themselves as Non-Hispanic American Indian or Alaska Native, Non-Hispanic Native Hawaiian or Pacific Islander, Non-Hispanic Some Other Race, or Non-Hispanic and a combination of two or more races. Source: U.S. Census 2000 & 2010, P.L Prepared by the Hobby Center for the Study of Texas at Rice University
 1,117,114. 2,003, , NH Black. 1,505,667. 1,797, , NH Asian. 240, , , NH Other. 368, , , Total. 18,343, ,425,180. 3,081, *Hispanic includes persons of all races. All other race/ethnicity categories shown here are Non-Hispanic. Non-Hispanic Other includes persons identifying themselves as Non-Hispanic American Indian or Alaska Native, Non-Hispanic Native Hawaiian or Pacific Islander, Non-Hispanic Some Other Race, or Non-Hispanic and a combination of two or more races. Source: U.S. Census 2000 & 2010, P.L Prepared by the Hobby Center for the Study of Texas at Rice University")
36
Population, Population Change, and Proportion of the Population Under Age 18 by Race/Ethnicity for Metropolitan Suburban Counties In the United States, 2000 and 2010 Population Population Change Percent of Total Race/Ethnicity* 2000 2010 Numeric Percent Percent of Total Chg NH White 3,777,831 3,750,909 -26,922 -0.7 -5.8 78.0 70.7 Hispanic (All Races) 406,567 731,989 325,422 80.0 70.5 8.4 13.8 NH Black 450,858 481,080 30,222 6.7 6.5 9.3 9.1 NH Asian 59,990 101,098 41,108 68.5 8.9 1.2 1.9 NH Other 145,255 237,254 91,999 63.3 19.9 3.0 4.5 Total 4,840,501 5,302,330 461,829 9.5 100.0 *Hispanic includes persons of all races. All other race/ethnicity categories shown here are Non-Hispanic. Non-Hispanic Other includes persons identifying themselves as Non-Hispanic American Indian or Alaska Native, Non-Hispanic Native Hawaiian or Pacific Islander, Non-Hispanic Some Other Race, or Non-Hispanic and a combination of two or more races. Source: U.S. Census 2000 & 2010, P.L Prepared by the Hobby Center for the Study of Texas at Rice University
 406, , , NH Black. 450, , , NH Asian. 59, , , NH Other. 145, , , Total. 4,840,501. 5,302, , *Hispanic includes persons of all races. All other race/ethnicity categories shown here are Non-Hispanic. Non-Hispanic Other includes persons identifying themselves as Non-Hispanic American Indian or Alaska Native, Non-Hispanic Native Hawaiian or Pacific Islander, Non-Hispanic Some Other Race, or Non-Hispanic and a combination of two or more races. Source: U.S. Census 2000 & 2010, P.L Prepared by the Hobby Center for the Study of Texas at Rice University")
37
in the United States, 2000 and 2010
Population, Population Change, and Proportion of the Total Population by Race/Ethnicity for Non-Metropolitan Counties in the United States, 2000 and 2010 Population Population Change Percent of Total Race/Ethnicity* 2000 2010 Numeric Percent Percent of Total Chg NH White 40,185,558 40,643,894 458,336 1.1 20.8 82.3 79.6 Hispanic (All Races) 2,632,528 3,819,825 1,187,297 45.1 53.9 5.4 7.5 NH Black 4,112,125 4,216,124 103,999 2.5 4.7 8.4 8.3 NH Asian 351,054 467,536 116,482 33.2 5.3 0.7 0.9 NH Other 1,560,701 1,896,374 335,673 21.5 15.3 3.2 3.7 Total 48,841,966 51,043,753 2,201,787 4.5 100.0 *Hispanic includes persons of all races. All other race/ethnicity categories shown here are Non-Hispanic. Non-Hispanic Other includes persons identifying themselves as Non-Hispanic American Indian or Alaska Native, Non-Hispanic Native Hawaiian or Pacific Islander, Non-Hispanic Some Other Race, or Non-Hispanic and a combination of two or more races. Source: U.S. Census 2000 & 2010, P.L Prepared by the Hobby Center for the Study of Texas at Rice University
 2,632,528. 3,819,825. 1,187, NH Black. 4,112,125. 4,216, , NH Asian. 351, , , NH Other. 1,560,701. 1,896, , Total. 48,841, ,043,753. 2,201, *Hispanic includes persons of all races. All other race/ethnicity categories shown here are Non-Hispanic. Non-Hispanic Other includes persons identifying themselves as Non-Hispanic American Indian or Alaska Native, Non-Hispanic Native Hawaiian or Pacific Islander, Non-Hispanic Some Other Race, or Non-Hispanic and a combination of two or more races. Source: U.S. Census 2000 & 2010, P.L Prepared by the Hobby Center for the Study of Texas at Rice University")
38
in the United States, 2000 and 2010
Population, Population Change, and Proportion of the Population Under Age 18 by Race/Ethnicity for Non-Metropolitan Counties in the United States, 2000 and 2010 Population Population Change Percent of Total Race/Ethnicity* 2000 2010 Numeric Percent Percent of Total Chg NH White 9,399,573 8,459,647 -939,926 -10.0 -183.1 76.4 71.8 Hispanic (All Races) 962,969 1,397,290 434,321 45.1 84.6 7.8 11.9 NH Black 1,250,805 1,105,891 -144,914 -11.6 28.2 10.2 9.4 NH Asian 84,410 101,152 16,742 19.8 3.3 0.7 0.9 NH Other 604,415 724,617 120,202 19.9 23.4 4.9 6.1 Total 12,302,172 11,788,597 -513,575 -4.2 100.0 *Hispanic includes persons of all races. All other race/ethnicity categories shown here are Non-Hispanic. Non-Hispanic Other includes persons identifying themselves as Non-Hispanic American Indian or Alaska Native, Non-Hispanic Native Hawaiian or Pacific Islander, Non-Hispanic Some Other Race, or Non-Hispanic and a combination of two or more races. Source: U.S. Census 2000 & 2010, P.L Prepared by the Hobby Center for the Study of Texas at Rice University
 962,969. 1,397, , NH Black. 1,250,805. 1,105, , NH Asian. 84, , , NH Other. 604, , , Total. 12,302, ,788, , *Hispanic includes persons of all races. All other race/ethnicity categories shown here are Non-Hispanic. Non-Hispanic Other includes persons identifying themselves as Non-Hispanic American Indian or Alaska Native, Non-Hispanic Native Hawaiian or Pacific Islander, Non-Hispanic Some Other Race, or Non-Hispanic and a combination of two or more races. Source: U.S. Census 2000 & 2010, P.L Prepared by the Hobby Center for the Study of Texas at Rice University")
39
Percent of Texas Population by Age Group and Ethnicity, 2000
39

40
Percent of Texas Population by Age Group and Ethnicity, 2010
40

41
Percent of United States Population by Age Group and Ethnicity, 2000
Non-anglo populations primarily in younger ages Largest proportion of anglos in oldest ages 41

42
Percent of United States Population by Age Group and Ethnicity, 2010
Non-anglo populations primarily in younger ages Largest proportion of anglos in oldest ages 42

43
Percent of United States Population by Age Group and Ethnicity, 2050
By 2040, all but oldest ages will be majority non-Anglo In fact, Half of the population will be non-Anglo by 2042 and ½ of Children will be non-Anglo by 2023! 43

44
POPULATION CHARACTERISTICS AND SOCIOECONOMIC CONDITIONS
Hobby Center for the Study of Texas at Rice University

45
Median Household Income* Median Household Income
Total and Percent of the United States Population in Poverty and Median Household Income by Race/Ethnicity, 1999 and 2009 1999 2009 Population in Poverty % Median Household Income* Median Household Income Anglo 15,414,119 8.1 $58,523 19,462,966 10.0 $54,671 Hispanic 7,797,874 22.6 $43,442 11,130,896 23.5 $39,923 Black 8,146,146 24.9 $37,956 9,407,955 25.8 $33,463 Asian 1,257,237 12.6 $66,961 1,539,226 11.4 $68,780 Other 1,284,436 18.5 NA 1,327,120 18.4 Total 33,899,812 12.4 $54,172 42,868,163 14.3 $50,221 *In 2009 Dollars Source: U.S. Census Bureau, Census 2000 and American Community Survey, 2009 Hobby Center for the Study of Texas at Rice University 45 45

46
Total and Percent of the Population in Poverty and Median Household Income by Race/Ethnicity for Northeast Region, 1999 and 2010 1999 Population in Poverty Percent in Poverty Median Household Income* NH White 2,804,359 7.3 $64,029 2,995,884 8.1 $62,539 Hispanic** 1,332,537 26.1 $41,463 1,555,129 24.0 $40,042 NH Black 1,269,496 23.3 $41,899 1,257,860 21.9 $40,305 NH Asian 293,978 14.4 $68,044 373,970 13.0 $70,598 Total 5,919,007 11.4 $59,530 6,362,696 11.9 $57,570 * In 2010 Dollars **Hispanic includes persons of all races. Not all race/ethnic groups are shown but are included in the Total. Source: U.S. Census Bureau, 2000 Census of Population and Housing, and American Community Survey. Prepared by the Hobby Center for the Study of Texas at Rice University

47
Total and Percent of the Population in Poverty and Median
Household Income by Race/Ethnicity for Metropolitan Counties in the Northeast Region, 1999 and 2010 1999 Population in Poverty Percent in Poverty Median Household Income* NH White 2,289,673 6.8 $67,276 2,423,384 7.5 $65,811 Hispanic** 1,314,701 26.2 $41,817 1,522,198 24.0 $40,086 NH Black 1,256,748 23.3 $42,432 1,240,060 21.8 $40,318 NH Asian 290,808 14.4 $69,256 368,341 13.0 $70,831 Total 5,354,535 11.4 $61,435 5,713,569 11.9 $59,490 * In 2010 Dollars **Hispanic includes persons of all races. Not all race/ethnic groups are shown but are included in the Total. Source: U.S. Census Bureau, 2000 Census of Population and Housing, and American Community Survey. Prepared by the Hobby Center for the Study of Texas at Rice University

48
Total and Percent of the Population in Poverty and Median
Household Income by Race/Ethnicity for Nonmetropolitan Counties in the Northeast Region, 1999 and 2010 1999 Population in Poverty Percent in Poverty Median Household Income* NH White 514,686 10.7 $47,920 572,500 11.9 $46,239 Hispanic** 17,836 24.4 $40,788 32,931 24.8 $37,700 NH Black 12,748 26.8 $39,674 17,800 24.1 $39,195 NH Asian 3,170 14.6 $57,031 5,629 $54,051 Total 564,472 11.2 $47,703 649,127 12.6 $45,931 * In 2010 Dollars **Hispanic includes persons of all races. Not all race/ethnic groups are shown but are included in the Total. Source: U.S. Census Bureau, 2000 Census of Population and Housing, and American Community Survey. Prepared by the Hobby Center for the Study of Texas at Rice University

49
Total and Percent of the Population in Poverty and Median Household Income by Race/Ethnicity for Midwest Region, 1999 and 2010 1999 Population in Poverty Percent in Poverty Median Household Income* NH White 3,811,427 7.5 $58,072 5,021,570 9.9 $53,109 Hispanic** 552,472 18.2 $49,281 943,342 21.9 $41,774 NH Black 1,577,098 25.9 $38,267 1,953,362 30.2 $31,001 NH Asian 148,194 13.0 $66,631 214,353 13.2 $64,347 Total 6,360,113 10.2 $55,516 8,494,732 13.1 $50,276 * In 2010 Dollars **Hispanic includes persons of all races. Not all race/ethnic groups are shown but are included in the Total. Source: U.S. Census Bureau, 2000 Census of Population and Housing, and American Community Survey. Prepared by the Hobby Center for the Study of Texas at Rice University

50
Total and Percent of the Population in Poverty and Median
Household Income by Race/Ethnicity for Metropolitan Counties in the Midwest Region, 1999 and 2010 1999 Population in Poverty Percent in Poverty Median Household Income* NH White 2,394,861 6.5 $63,331 3,320,551 8.9 $57,181 Hispanic** 471,820 17.7 $51,001 800,565 21.3 $42,603 NH Black 1,532,448 25.8 $38,603 1,887,805 30.0 $31,171 NH Asian 140,045 12.7 $68,265 200,083 13.0 $65,611 Total 4,709,702 9.9 $59,454 6,450,287 12.9 $52,743 * In 2010 Dollars **Hispanic includes persons of all races. Not all race/ethnic groups are shown but are included in the Total. Source: U.S. Census Bureau, 2000 Census of Population and Housing, and American Community Survey. Prepared by the Hobby Center for the Study of Texas at Rice University

51
Total and Percent of the Population in Poverty and Median
Household Income by Race/Ethnicity for Nonmetropolitan Counties in the Midwest Region, 1999 and 2010 1999 Population in Poverty Percent in Poverty Median Household Income* NH White 1,416,566 10.1 $47,442 1,701,019 12.5 $43,798 Hispanic** 80,652 21.8 $41,373 142,777 26.2 $36,481 NH Black 44,650 30.7 $30,914 65,557 36.8 $24,133 NH Asian 8,149 20.1 $48,624 14,270 16.3 $45,428 Total 1,650,411 11.0 $46,966 2,044,445 13.8 $43,142 * In 2010 Dollars **Hispanic includes persons of all races. Not all race/ethnic groups are shown but are included in the Total. Source: U.S. Census Bureau, 2000 Census of Population and Housing, and American Community Survey. Prepared by the Hobby Center for the Study of Texas at Rice University

52
Total and Percent of the Population in Poverty and Median Household Income by Race/Ethnicity for South Region, 1999 and 2010 1999 Population in Poverty Percent in Poverty Median Household Income* NH White 5,856,342 9.1 $55,478 6,949,544 10.4 $53,644 Hispanic** 2,580,593 22.8 $41,679 3,926,356 23.5 $39,138 NH Black 4,536,541 25.5 $36,386 5,109,013 25.2 $34,305 NH Asian 211,203 11.5 $65,323 321,256 10.8 $65,841 Total 13,569,265 13.9 $50,772 16,790,375 15.4 $47,934 * In 2010 Dollars **Hispanic includes persons of all races. Not all race/ethnic groups are shown but are included in the Total. Source: U.S. Census Bureau, 2000 Census of Population and Housing, and American Community Survey. Prepared by the Hobby Center for the Study of Texas at Rice University

53
Total and Percent of the Population in Poverty and Median
Household Income by Race/Ethnicity for Metropolitan Counties in the South Region, 1999 and 2010 1999 Population in Poverty Percent in Poverty Median Household Income* NH White 3,791,034 7.7 $60,500 4,630,529 9.1 $58,079 Hispanic** 2,213,846 21.9 $43,284 3,418,135 22.7 $40,057 NH Black 3,360,161 23.4 $39,517 3,884,591 23.2 $36,931 NH Asian 204,543 11.3 $66,015 300,179 10.6 $66,747 Total 9,827,321 12.8 $54,438 12,559,043 14.3 $51,025 * In 2010 Dollars **Hispanic includes persons of all races. Not all race/ethnic groups are shown but are included in the Total. Source: U.S. Census Bureau, 2000 Census of Population and Housing, and American Community Survey. Prepared by the Hobby Center for the Study of Texas at Rice University

54
Total and Percent of the Population in Poverty and Median
Household Income by Race/Ethnicity for Nonmetropolitan Counties in the South Region, 1999 and 2010 1999 Population in Poverty Percent in Poverty Median Household Income* NH White 2,065,308 13.5 $43,334 2,319,015 14.9 $41,228 Hispanic** 366,747 30.8 $32,730 508,221 31.1 $31,399 NH Black 1,176,380 34.2 $26,140 1,224,422 35.2 $23,517 NH Asian 6,660 17.8 $52,787 21,077 17.1 $44,360 Total 3,741,944 18.2 $39,791 4,231,332 19.7 $37,246 * In 2010 Dollars **Hispanic includes persons of all races. Not all race/ethnic groups are shown but are included in the Total. Source: U.S. Census Bureau, 2000 Census of Population and Housing, and American Community Survey. Prepared by the Hobby Center for the Study of Texas at Rice University

55
Total and Percent of the Population in Poverty and Median Household Income by Race/Ethnicity for West Region, 1999 and 2010 1999 2010 Population in Poverty Percent in Poverty Median Household Income* NH White 2,941,991 8.2 $63,613 3,367,839 10.4 $53,644 Hispanic** 3,332,272 22.2 $46,133 4,046,163 23.5 $39,138 NH Black 587,030 21.4 $45,822 634,576 25.2 $34,305 NH Asian 587,916 12.1 $69,955 648,983 10.8 $65,841 Total 8,051,427 13.0 $59,010 9,269,710 15.4 $47,934 * In 2010 Dollars **Hispanic includes persons of all races. Not all race/ethnic groups are shown but are included in the Total. Source: U.S. Census Bureau, 2000 Census of Population and Housing, and American Community Survey. Prepared by the Hobby Center for the Study of Texas at Rice University

56
Total and Percent of the Population in Poverty and Median
Household Income by Race/Ethnicity for Metropolitan Counties in the West Region, 1999 and 2010 1999 Population in Poverty Percent in Poverty Median Household Income* NH White 2,371,714 7.6 $66,127 2,770,259 8.6 $64,107 Hispanic** 3,116,812 22.0 $47,072 3,794,213 20.8 $45,023 NH Black 581,610 21.4 $45,922 624,911 21.0 $42,919 NH Asian 575,353 12.2 $71,302 632,496 10.3 $71,864 Total 7,053,292 12.8 $61,167 8,213,349 13.2 $58,316 * In 2010 Dollars **Hispanic includes persons of all races. Not all race/ethnic groups are shown but are included in the Total. Source: U.S. Census Bureau, 2000 Census of Population and Housing, and American Community Survey. Prepared by the Hobby Center for the Study of Texas at Rice University

57
Total and Percent of the Population in Poverty and Median
Household Income by Race/Ethnicity for Nonmetropolitan Counties in the West Region, 1999 and 2010 1999 Population in Poverty Percent in Poverty Median Household Income* NH White 570,277 11.8 $48,044 597,580 12.1 $47,400 Hispanic** 215,460 25.8 $35,478 251,950 24.4 $35,665 NH Black 5,420 24.0 $37,206 9,665 22.6 $39,788 NH Asian 12,563 9.4 $60,499 16,487 9.6 $56,982 Total 998,135 15.3 $45,769 1,056,361 15.4 $45,189 * In 2010 Dollars **Hispanic includes persons of all races. Not all race/ethnic groups are shown but are included in the Total. Source: U.S. Census Bureau, 2000 Census of Population and Housing, and American Community Survey. Prepared by the Hobby Center for the Study of Texas at Rice University

58
Median Household Income* Median Household Income
Total and Percent of the Asheville, NC MSA Population in Poverty and Median Household Income for Major Race/Ethnic Groups, 1999 and 2009 1999 2009 Population % Median Household Income* Median Household Income in Poverty Anglo 19,467 10.0 $48,032 44,118 12.6 $42,648 Hispanic^ 1,134 20.3 $41,742 6,450 30.4 $33,056 Black 4,142 29.3 $27,578 7,985 41.3 $31,630 Asian 214 11.1 $52,406 NA $55,320 Total Population 25,800 11.8 $46,671 60,611 15.1 $41,078 *In 2009 Dollars ^Includes Hispanic Persons of Any Race. Source: U.S. Census Bureau, Census 2000 and American Community Survey, 2009 58 58

59
Median Household Income* Median Household Income
Total and Percent of the Atlanta-Sandy Spring-Marietta MSA Population in Poverty and Median Household Income for Major Race/Ethnic Groups, 1999 and 2009 1999 2009 Population in Poverty % Median Household Income* Median Household Income Anglo 122,091 5.0 $77,025 198,253 7.0 $67,745 Hispanic^ 48,803 18.7 $57,116 173,494 32.4 $36,194 Black 188,292 16.3 $50,404 316,068 $41,047 Asian 12,344 9.5 $68,345 30,394 13.1 $61,169 Total Population 379,924 9.4 $67,013 723,322 13.4 $55,464 *In 2009 Dollars ^Includes Hispanic Persons of Any Race. Source: U.S. Census Bureau, Census 2000 and American Community Survey, 2009 59 59

60
Total and Percent of the Population in Poverty and Median Household
Income by Race/Ethnicity for Austin, Texas, 1999 and 2010 Race/ Ethnicity 1999 2010 Population in Poverty % Median Household Income* NH White 32,446 9.4 $63,623 46,472 12.1 $60,009 Hispanic (All Races) 41,203 20.9 $46,639 87,592 30.4 $35,982 Black 11,689 19.3 $41,965 19,350 31.8 $31,808 Asian 5,688 19.7 $54,753 8,294 18.3 $47,448 Total 92,011 14.4 $55,876 165,468 20.8 $47,434 *In 2010 Dollars Source: U.S. Census Bureau, Census 2000 Summary File 4, American Community Survey Prepared by the Hobby Center for the Study of Texas at Rice University
 41, $46, , $35,982. Black. 11, $41, , $31,808. Asian. 5, $54,753. 8, $47,448. Total. 92, $55, , $47,434. *In 2010 Dollars. Source: U.S. Census Bureau, Census 2000 Summary File 4, American Community Survey. Prepared by the Hobby Center for the Study of Texas at Rice University")
61
Total and Percent of the Population in Poverty and Median Household
Income by Race/Ethnicity for Dallas, Texas, 1999 and 2010 Race/ Ethnicity 1999 2010 Population in Poverty % Median Household Income* NH White 27,827 6.8 $65,266 30,376 8.9 $62,330 Hispanic (All Races) 101,705 24.3 $41,329 141,818 27.7 $35,516 NH Black 71,731 24.1 $35,846 98,843 33.6 $28,564 Asian 4,343 13.8 $57,831 8,119 23.8 $45,013 Total 207,493 17.8 $49,251 283,860 23.6 $40,650 *In 2010 Dollars Source: U.S. Census Bureau, Census 2000 Summary File 4, American Community Survey Prepared by the Hobby Center for the Study of Texas at Rice University
 101, $41, , $35,516. NH Black. 71, $35, , $28,564. Asian. 4, $57,831. 8, $45,013. Total. 207, $49, , $40,650. *In 2010 Dollars. Source: U.S. Census Bureau, Census 2000 Summary File 4, American Community Survey. Prepared by the Hobby Center for the Study of Texas at Rice University")
62
Total and Percent of the Population in Poverty and Median Household
Income by Race/Ethnicity for Houston, Texas, 1999 and 2010 Race/ Ethnicity 1999 2010 Population in Poverty % Median Household Income* NH White 44,570 7.3 $67,365 44,947 8.3 $68,135 Hispanic (All Races) 185,326 25.6 $38,809 268,054 29.2 $35,340 NH Black 120,345 25.2 $36,082 136,219 27.7 $31,127 Asian 15,657 15.6 $53,260 26,698 20.5 $45,939 Total 369,045 19.2 $47,927 480,443 22.8 $42,355 *In 2010 Dollars Source: U.S. Census Bureau, Census 2000 Summary File 4, American Community Survey Prepared by the Hobby Center for the Study of Texas at Rice University
 185, $38, , $35,340. NH Black. 120, $36, , $31,127. Asian. 15, $53, , $45,939. Total. 369, $47, , $42,355. *In 2010 Dollars. Source: U.S. Census Bureau, Census 2000 Summary File 4, American Community Survey. Prepared by the Hobby Center for the Study of Texas at Rice University")
63
Median Household Income* Median Household Income
Total and Percent of the Miami-Ft. Lauderdale-Pompano Beach MSA Population in Poverty and Median Household Income for Major Race/Ethnic Groups, 1999 and 2009 1999 2009 Population % Median Household Income* Median Household Income in Poverty Anglo 110,222 8.0 $58,999 179,850 9.0 $55,543 Hispanic^ 258,999 16.8 $45,383 378,873 17.2 $40,616 Black 192,723 25.3 $39,778 316,068 18.7 $35,067 Asian 8,049 12.1 $58,010 30,394 13.1 $59,021 Total Population 581,584 15.3 $49,835 838,735 15.4 $45,946 *In 2009 Dollars ^Includes Hispanic Persons of Any Race. Source: U.S. Census Bureau, Census 2000 and American Community Survey, 2009 63 63

64
Total and Percent of the Population in Poverty and Median Household
Income by Race/Ethnicity for San Antonio, Texas, 1999 and 2010 Race/ Ethnicity 1999 2010 Population in Poverty % Median Household Income* NH White 27,023 7.4 $60,927 29,871 8.5 $58,083 Hispanic (All Races) 148,477 22.4 $39,880 199,755 23.4 $38,973 NH Black 15,237 21.6 $38,903 17,448 22.0 $33,637 Asian 1,900 11.0 $50,632 4,277 14.6 $52,107 Total 193,731 17.3 $47,401 254,863 19.1 $43,758 *In 2010 Dollars Source: U.S. Census Bureau, Census 2000 Summary File 4, American Community Survey Prepared by the Hobby Center for the Study of Texas at Rice University
 148, $39, , $38,973. NH Black. 15, $38, , $33,637. Asian. 1, $50,632. 4, $52,107. Total. 193, $47, , $43,758. *In 2010 Dollars. Source: U.S. Census Bureau, Census 2000 Summary File 4, American Community Survey. Prepared by the Hobby Center for the Study of Texas at Rice University")
65
Educational Attainment for the Population
Age 25 and over, United States, 2010 Race/ Ethnicity Population Age 25 and Older Less than High School High School Diploma Some College or Associates Degree Bachelor Degree or More Non-Hispanic White 141,698,750 9.3 29.2 30.1 31.4 Hispanic* 27,313,996 37.8 26.5 22.7 13.0 Black 23,049,274 17.9 31.8 32.4 Asian 9,879,433 14.5 16.0 19.5 50.0 Other 2,347,480 15.2 29.7 33.8 21.3 Total 204,288,933 14.4 28.5 28.9 28.2 *Hispanic includes persons of all races. All other race/ethnicity categories shown here are Non-Hispanic. Non-Hispanic Other includes persons identifying themselves as Non-Hispanic American Indian or Alaska Native, Non-Hispanic Native Hawaiian or Pacific Islander, Non-Hispanic Some Other Race, or Non-Hispanic and a combination of two or more races. Source: U.S. Census Bureau 2010 American Community Survey Prepared by the Hobby Center for the Study of Texas at Rice University

66
Educational Attainment for the Population Age 25 and Older
by Major Race/Ethnic Groups in 2010, Northeast Region, United States Population Age 25 and Older Less than high school High school diploma Some college or associates degree Bachelor or more Race/Ethnicity (%) Non-Hispanic White 27,172,724 8.6 31.1 24.9 35.4 Non-Hispanic Black 3,793,782 17.5 33.9 29.3 19.3 Hispanic* 3,999,473 33.4 29.4 21.9 15.4 Non-Hispanic Asian 2,058,645 17.3 16.2 13.2 53.2 Total Population 37,594,652 12.7 30.4 24.4 32.5 Source: U.S. Census, American Community Survey, 2010. Not all race/ethnic groups are shown here but are included in the total. *Includes Hispanic persons of all races.
 Non-Hispanic White. 27,172, Non-Hispanic Black. 3,793, Hispanic* 3,999, Non-Hispanic Asian. 2,058, Total Population. 37,594, Source: U.S. Census, American Community Survey, Not all race/ethnic groups are shown here but are included in the total. *Includes Hispanic persons of all races.")
67
Educational Attainment for the Population Age 25 and Older
by Major Race/Ethnic Groups in 2010, Midwest Region, United States Population Age 25 and Older Less than high school High school diploma Some college or associates degree Bachelor or more Race/Ethnicity (%) Non-Hispanic White 36,172,924 9.1 32.3 30.5 28.2 Non-Hispanic Black 4,060,153 17.4 31.1 35.4 16.0 Hispanic* 2,334,222 38.0 27.7 21.2 13.0 Non-Hispanic Asian 1,066,509 12.8 13.7 16.1 57.5 Total Population 44,318,620 11.5 31.4 30.2 26.9 Source: U.S. Census, American Community Survey, 2010. Not all race/ethnic groups are shown here but are included in the total. *Includes Hispanic persons of all races.
 Non-Hispanic White. 36,172, Non-Hispanic Black. 4,060, Hispanic* 2,334, Non-Hispanic Asian. 1,066, Total Population. 44,318, Source: U.S. Census, American Community Survey, Not all race/ethnic groups are shown here but are included in the total. *Includes Hispanic persons of all races.")
68
Educational Attainment for the Population Age 25 and Older
by Major Race/Ethnic Groups in 2010, Southern Region, United States Population Age 25 and Older Less than high school High school diploma Some college or associates degree Bachelor or more Race/Ethnicity (%) Non-Hispanic White 48,911,319 11.4 29.7 29.5 Non-Hispanic Black 13,163,375 19.1 32.4 31.0 17.6 Hispanic* 10,059,128 36.7 26.3 22.3 14.6 Non-Hispanic Asian 2,110,388 13.8 15.7 18.5 52.0 Total Population 75,558,195 16.2 29.3 28.5 26.0 Source: U.S. Census, American Community Survey, 2010. Not all race/ethnic groups are shown here but are included in the total. *Includes Hispanic persons of all races.
 Non-Hispanic White. 48,911, Non-Hispanic Black. 13,163, Hispanic* 10,059, Non-Hispanic Asian. 2,110, Total Population. 75,558, Source: U.S. Census, American Community Survey, Not all race/ethnic groups are shown here but are included in the total. *Includes Hispanic persons of all races.")
69
Educational Attainment for the Population Age 25 and Older
by Major Race/Ethnic Groups in 2010, Western Region, United States Population Age 25 and Older Less than high school High school diploma Some college or associates degree Bachelor or more Race/Ethnicity (%) Non-Hispanic White 27,438,391 6.5 22.8 35.4 35.3 Non-Hispanic Black 2,031,964 12.0 25.6 41.2 21.2 Hispanic* 10,921,173 40.3 25.2 23.7 10.7 Non-Hispanic Asian 4,643,891 14.1 16.5 23.4 46.0 Total Population 46,817,466 15.6 23.0 31.8 29.5 Source: U.S. Census, American Community Survey, 2010. Not all race/ethnic groups are shown here but are included in the total. *Includes Hispanic persons of all races.
 Non-Hispanic White. 27,438, Non-Hispanic Black. 2,031, Hispanic* 10,921, Non-Hispanic Asian. 4,643, Total Population. 46,817, Source: U.S. Census, American Community Survey, Not all race/ethnic groups are shown here but are included in the total. *Includes Hispanic persons of all races.")
70
Educational Attainment for the Population Age 25 and over, Texas, 2010
Race/ Ethnicity Population Age 25 and Older Less than High School High School Diploma Some College or Associates Degree Bachelor Degree or More Non-Hispanic White 8,212,303 8.0 25.3 32.6 34.1 Hispanic* 5,063,779 40.4 25.8 22.2 11.6 Black 1,762,154 13.7 30.3 36.3 19.7 Asian 632,826 14.3 15.2 18.5 52.0 Other 101,060 9.3 23.1 46.9 20.8 Total 15,772,122 19.3 25.6 29.2 25.9 *Hispanic includes persons of all races. All other race/ethnicity categories shown here are Non-Hispanic. Non-Hispanic Other includes persons identifying themselves as Non-Hispanic American Indian or Alaska Native, Non-Hispanic Native Hawaiian or Pacific Islander, Non-Hispanic Some Other Race, or Non-Hispanic and a combination of two or more races. Source: U.S. Census Bureau 2010 American Community Survey Prepared by the Hobby Center for the Study of Texas at Rice University

71
PROJECTIONS Hobby Center for the Study of Texas at Rice University

72
(Resident population as of July 1, Number in thousands)
U.S. Population by Race and Hispanic Origin: Census 2010 and Projected for 2020 to 2060 Year (Resident population as of July 1, Number in thousands) Non-Hispanic Hispanic (any race) Total White alone Black alone Asian alone All other races 2010 196,818 37,686 14,465 9,299 50,478 308,746 2020 199,312 41,776 18,246 10,778 63,784 333,896 2030 198,818 45,452 22,044 13,502 78,655 358,471 2040 193,887 48,769 25,881 16,603 94,876 380,016 2050 186,334 51,988 29,583 20,166 111,732 399,803 2060 178,952 55,302 33,106 24,128 128,780 420,268 Source: U.S. Census Bureau, 2010 Census and 2012 National Projections Hobby Center for the Study of Texas at Rice University
 Non-Hispanic. Hispanic (any race) Total. White alone. Black alone. Asian alone. All other races , , ,465. 9, , , , , , , , , , , , , , , , , , , , , , , , , , , , , , , , ,268. Source: U.S. Census Bureau, 2010 Census and 2012 National Projections. Hobby Center for the Study of Texas at Rice University.")
73
Numeric Change in U.S. Population by Race and Hispanic Origin: Census 2010 and Projected to 2060 (in millions) Hobby Center for the Study of Texas at Rice University

74
Change in the U.S. Population by Race and Hispanic Origin: Census 2010 and Projected to 2060

75
(Percent of total resident population as of July 1)
Age Distribution of the U.S. Population: Census 2010 and Projected 2020 to 2060 Age Group (Percent of total resident population as of July 1) 2010 2020 2030 2040 2050 2060 Under 5 years 6.5 6.2 6.1 6.0 5.9 5 to 19 years 20.4 18.8 18.6 18.1 17.8 17.7 20 to 44 years 33.6 33.0 32.3 31.5 31.6 31.3 45 to 64 years 26.4 24.9 22.6 23.3 23.7 23.2 65 years and over 13.1 16.8 20.3 21.0 20.9 21.9 Source: U.S. Census Bureau, 2010 Census and 2012 National Projections
 Under 5 years to 19 years to 44 years to 64 years years and over Source: U.S. Census Bureau, 2010 Census and 2012 National Projections.")
76
(Percent of total resident population as of July 1)
Age Distribution of the U.S. Population: Census 2010 and Projected 2020 to 2060 Age Group (Percent of total resident population as of July 1) 2010 2020 2030 2040 2050 2060 Under 5 years 6.5 6.2 6.1 6.0 5.9 5 to 19 years 20.4 18.8 18.6 18.1 17.8 17.7 20 to 44 years 33.6 33.0 32.3 31.5 31.6 31.3 45 to 64 years 26.4 24.9 22.6 23.3 23.7 23.2 65 to 84 years 11.3 14.8 17.3 16.4 17.6 85 years and over 1.8 2.0 2.5 3.7 4.5 4.3 Source: U.S. Census Bureau, 2010 Census and 2012 National Projections Hobby Center for the Study of Texas at Rice University
 Under 5 years to 19 years to 44 years to 64 years to 84 years years and over Source: U.S. Census Bureau, 2010 Census and 2012 National Projections. Hobby Center for the Study of Texas at Rice University.")
77
Percent of each group's resident population as of April 1
Percent By Race and Hispanic Origin by Selected Age Groups for the U.S. Population : 2010 Age Group Percent of each group's resident population as of April 1 Non-Hispanic Hispanic (any race) Total White alone Black alone Asian alone All other races 63.8 12.2 4.7 3.0 16.3 100.0 Under 5 years 50.8 13.6 4.3 6.0 25.3 5 to 17 years 54.5 14.1 4.8 22.3 18 to 24 years 57.1 14.3 4.9 3.6 20.1 25 to 44 years 59.6 12.6 5.9 2.7 19.2 45 to 64 years 71.7 11.3 4.4 2.0 10.6 65 years and over 80.0 8.4 3.4 1.3 6.9 Elderly Age Groups 65 to 74 years 78.0 9.1 3.8 1.5 7.6 75 to 84 years 81.2 7.8 3.2 1.2 6.6 85 years and over 84.9 6.8 2.5 0.9 Source: U.S. Census Bureau, 2010 Census Hobby Center for the Study of Texas at Rice University
 Total. White alone. Black alone. Asian alone. All other races Under 5 years to 17 years to 24 years to 44 years to 64 years years and over Elderly Age Groups. 65 to 74 years to 84 years years and over Source: U.S. Census Bureau, 2010 Census. Hobby Center for the Study of Texas at Rice University.")
78
Percent of each group's resident population as of April 1
Projected Percent By Race and Hispanic Origin by Selected Age Groups for the U.S. Population: 2060 Age Group Percent of each group's resident population as of April 1 Non-Hispanic Hispanic (any race) Total White alone Black alone Asian alone All other races 42.6 13.2 7.9 5.7 30.6 100.0 Under 5 years 30.9 13.0 6.6 9.9 39.6 5 to 17 years 33.6 6.8 9.0 37.4 18 to 24 years 35.8 7.2 7.7 36.1 25 to 44 years 39.0 13.5 8.5 6.0 33.0 45 to 64 years 45.3 13.4 8.7 4.4 28.2 65 years and over 55.8 12.5 2.7 21.3 Elderly Age Groups 65 to 74 years 52.5 13.6 8.0 3.1 22.8 75 to 84 years 56.7 11.7 2.5 21.2 85 years and over 62.7 10.9 6.7 2.1 17.6 Source: U.S. Census Bureau, 2012 National Projections Hobby Center for the Study of Texas at Rice University
 Total. White alone. Black alone. Asian alone. All other races Under 5 years to 17 years to 24 years to 44 years to 64 years years and over Elderly Age Groups. 65 to 74 years to 84 years years and over Source: U.S. Census Bureau, 2012 National Projections. Hobby Center for the Study of Texas at Rice University.")
79
Population in Texas by Race/Ethnicity in 2010 and Projections of the Population in Texas by Race/Ethnicity from 2020 to 2050 Under Alternative Assumptions of Age and Race/Ethnicity-Specific Rates of Net Migration Year NH1 White NH Black Hispanic NH Asian & Other2 Total Assuming Zero Net Migration 2010 11,397,345 2,886,825 9,460,921 1,400,470 25,145,561 2020 11,576,595 3,122,637 11,137,672 1,536,693 27,373,597 2030 11,501,020 3,280,941 12,869,753 1,638,249 29,289,963 2040 11,182,576 3,355,500 14,570,851 1,714,232 30,823,159 2050 10,766,622 3,366,528 16,191,150 1,728,206 32,052,506 Assuming Net Migration Equal to One-Half of 11,752,530 3,295,198 12,031,059 1,825,130 28,903,917 11,850,180 3,658,997 15,082,058 2,309,763 32,900,998 11,676,157 3,951,909 18,489,803 2,881,525 36,999,394 11,376,576 4,182,155 22,268,390 3,483,178 41,310,299 Assuming Net Migration Equal to 11,931,815 3,477,928 13,003,159 2,170,409 30,583,311 12,211,664 4,080,453 17,702,132 3,288,536 37,282,785 12,194,151 4,653,725 23,514,974 4,953,861 45,316,711 12,024,913 5,195,861 30,701,208 7,283,548 55,205,530 1NH refers to Non-Hispanic; values shown are only for the non-Hispanic persons in each race category. Hispanic includes Hispanics of all races. 2NH Asian & Other category includes non-Hispanic persons who identify themselves as belonging to two or more race groups.

80
Percent of the Population by Race/Ethnicity in 2010 and Projected Through 2050 Under Alternative Assumptions of Age and Race/Ethnicity-Specific Rates of Net Migration for the State of Texas Year NH1 White NH Black Hispanic NH Asian & Other2 Total Assuming Zero Net Migration (Scenario 0.0) 2010 45.3 11.5 37.6 5.6 100.0 2020 42.3 11.4 40.7 2030 39.3 11.2 43.9 2040 36.3 10.9 47.2 2050 33.6 10.5 50.5 5.4 Assuming Net Migration Equal to One-Half of (Scenario 0.5) 41.6 6.3 36.0 11.1 45.8 7.1 31.6 10.7 50.0 7.7 27.5 10.2 53.9 8.4 Assuming Net Migration Equal to (Scenario 1.0) 39.0 42.5 32.8 47.5 8.8 26.9 10.3 51.9 21.8 9.4 55.6 13.2 1NH refers to Non-Hispanic; values shown are only for the non-Hispanic persons in each race category. Hispanic includes Hispanics of all races. 2NH Asian & Other category includes non-Hispanic persons who identify themselves as belonging to two or more race groups.
 Assuming Net Migration Equal to One-Half of (Scenario 0.5) Assuming Net Migration Equal to (Scenario 1.0) NH refers to Non-Hispanic; values shown are only for the non-Hispanic persons in each race category. Hispanic includes Hispanics of all races. 2NH Asian & Other category includes non-Hispanic persons who identify themselves as belonging to two or more race groups.")
81
Percent of Net Change in Population from 2010 to 2050 Due to Each Race/Ethnicity Group Under Alternative Scenarios of Age and Race/Ethnicity-Specific Net Migration for State of Texas Race/Ethnicity Number Percent Assuming Zero Net Migration (Scenario 0.0) NH1 White -630,723 -9.1 NH Black 479,703 6.9 Hispanic 6,730,229 97.4 NH Asian & Other2 327,736 4.8 Total 6,906,945 100.0 Assuming Net Migration Equal to One-Half of (Scenario 0.5) NH White -20,769 -0.1 1,295,330 8.0 12,807,469 79.2 NH Asian & Other 2,082,708 12.9 16,164,738 Assuming Net Migration Equal to (Scenario 1.0) 627,568 2.1 2,309,036 7.7 21,240,287 70.7 5,883,078 19.5 30,059,969 1NH refers to Non-Hispanic; values shown are only for the non-Hispanic persons in each race category. Hispanic includes Hispanics of all races. 2NH Asian & Other category includes non-Hispanic persons who identify themselves as belonging to two or more race groups.
 NH1 White. -630, NH Black. 479, Hispanic. 6,730, NH Asian & Other2. 327, Total. 6,906, Assuming Net Migration Equal to One-Half of (Scenario 0.5) NH White. -20, ,295, ,807, NH Asian & Other. 2,082, ,164,738. Assuming Net Migration Equal to (Scenario 1.0) 627, ,309, ,240, ,883, ,059,969. 1NH refers to Non-Hispanic; values shown are only for the non-Hispanic persons in each race category. Hispanic includes Hispanics of all races. 2NH Asian & Other category includes non-Hispanic persons who identify themselves as belonging to two or more race groups.")
82
Percent of the Population by Age Group and Race/Ethnicity in 2010 and Projected Percent of the Population by Age Group and Race/Ethnicity from 2030 to 2050 Assuming Age and Race/Ethnicity-Specific Net Migration Equal to for the State of Texas (Scenario 1.0) Age NH1 White NH Black Hispanic NH Asian & Other2 Total 2010 <18 20.4 28.1 35.1 29.6 27.3 18-24 8.7 11.2 11.7 10.2 25-44 25.7 29.1 30.1 32.3 28.2 45-64 29.8 24.0 17.5 21.4 65+ 15.4 7.6 5.6 6.5 10.3 2030 19.3 23.4 29.7 21.7 24.9 7.5 9.6 10.8 11.5 23.0 27.2 29.9 31.6 27.5 24.3 24.2 19.8 24.1 22.2 25.9 15.6 9.8 11.1 15.8 2050 18.2 20.7 21.9 7.4 8.9 10.6 8.6 9.4 25.5 27.8 30.5 26.9 23.7 25.6 22.8 27.7 12.9 14.1 16.9 1NH refers to Non-Hispanic; values shown are only for the non-Hispanic persons in each race category. Hispanic includes Hispanics of all races. 2NH Asian & Other category includes non-Hispanic persons who identify themselves as belonging to two or more race groups.

83
Percent of Age Group by Race/Ethnicity in 2010 and Projected Percent of Age Group by Race/Ethnicity from 2030 to 2050 Assuming Age and Race/Ethnicity-Specific Net Migration Equal to for the State of Texas (Scenario 1.0) Age NH1 White NH Black Hispanic NH Asian & Other2 Total 2010 <18 33.8 11.8 48.3 6.0 100.0 18-24 38.7 12.6 43.2 5.5 25-44 41.5 11.9 40.2 6.4 45-64 56.1 11.5 27.4 5.0 65+ 67.6 8.4 20.5 3.5 2030 25.4 10.3 56.6 7.7 25.5 10.9 53.0 10.6 27.3 10.8 51.7 10.1 36.0 12.0 42.4 9.6 53.6 29.4 6.2 2050 16.5 8.1 63.4 17.1 8.9 62.0 18.6 57.5 15.0 22.7 10.5 52.4 14.4 35.7 42.5 11.0 do about 5 groupings by median age from youngest 50 to oldest 50; old title: Percent of the Population by Age Group and Race/Ethnicity in 2010 and Projected Percent of the Population by Age Group and Race/Ethnicity from 2030 to 2050 Assuming Age and Race/Ethnicity-Specific Net Migration Equal to for the State of Texas (Scenario 1.0) 1NH refers to Non-Hispanic; values shown are only for the non-Hispanic persons in each race category. Hispanic includes Hispanics of all races. 2NH Asian & Other category includes non-Hispanic persons who identify themselves as belonging to two or more race groups.
 1NH refers to Non-Hispanic; values shown are only for the non-Hispanic persons in each race category. Hispanic includes Hispanics of all races. 2NH Asian & Other category includes non-Hispanic persons who identify themselves as belonging to two or more race groups.")
84
Implications for Refuge Use

85
Characteristics of Visitors to National Wildlife Refuges, 2010/2011
Source: USGS National Wildlife Refuge Visitor Survey, 2010/2011.

86
Percent of the Population Age 16 and Older Participating in Hunting and Fishing Activities by Race/Ethnicity, 2011 Source: U.S. Fish & Wildlife Service, 2011 National Survey of Fishing, Hunting, and Wildlife-Associated Recreation

87
Percent of the Population Age 16 and Older Participating in Wildlife Watching At Least 1 Mile Away from Home by Race/Ethnicity, 2011 Source: U.S. Fish & Wildlife Service, 2011 National Survey of Fishing, Hunting, and Wildlife-Associated Recreation

88
Projected Participants in Outdoor Recreation Activities by Activity Type and Race/Ethnicity of Participants Assuming Moderate Rates of International Migration (Main Series), Activity NH White NH Black Hispanic NH Asian & Other Total 2012 Hunting 12,704,502 419,920 290,399 320,021 13,734,842 Fishing 27,773,769 2,313,058 1,769,679 1,525,067 33,381,573 Wildlife Watching (Away from Home) 19,805,955 597,081 1,533,173 712,700 22,648,909 On Pubic Land 16,103,424 511,833 1,333,825 617,941 18,567,023 2020 12,645,392 453,669 362,753 379,356 13,841,170 27,791,002 2,538,629 2,147,800 1,815,930 34,293,361 19,899,581 633,570 1,902,030 853,628 23,288,809 16,173,301 563,300 1,655,100 742,128 19,133,829 2040 12,143,536 567,927 565,690 559,596 13,836,749 26,836,843 3,141,544 3,227,997 2,693,129 35,899,513 19,474,152 740,165 2,924,899 1,265,705 24,404,921 15,820,217 702,661 2,555,274 1,103,494 20,181,646 2060 11,303,497 661,233 790,349 761,660 13,516,739 24,972,078 3,642,061 4,402,450 3,683,898 36,700,487 18,169,722 832,361 4,060,938 1,729,641 24,792,662 14,759,066 812,264 3,556,538 1,511,110 20,638,978 Source: The Hobby Center for the Study of Texas. Derived from the U.S. Census Bureau, Projections of the Population, Vintage 2012 and The U.S. Fish & Wildlife Service, 2011 National Survey of Fishing, Hunting, and Wildlife Recreation.
 19,805, ,081. 1,533, , ,648,909. On Pubic Land. 16,103, ,833. 1,333, , ,567, ,645, , , , ,841, ,791,002. 2,538,629. 2,147,800. 1,815, ,293, ,899, ,570. 1,902, , ,288, ,173, ,300. 1,655, , ,133, ,143, , , , ,836, ,836,843. 3,141,544. 3,227,997. 2,693, ,899, ,474, ,165. 2,924,899. 1,265, ,404, ,820, ,661. 2,555,274. 1,103, ,181, ,303, , , , ,516, ,972,078. 3,642,061. 4,402,450. 3,683, ,700, ,169, ,361. 4,060,938. 1,729, ,792, ,759, ,264. 3,556,538. 1,511, ,638,978. Source: The Hobby Center for the Study of Texas. Derived from the U.S. Census Bureau, Projections of the Population, Vintage 2012 and The U.S. Fish & Wildlife Service, 2011 National Survey of Fishing, Hunting, and Wildlife Recreation.")
89
Projected Participants in Outdoor Recreation Activities by Activity Type and Race/Ethnicity of Participants (in Percents) Assuming Moderate Rates of International Migration (Main Series), Activity NH White NH Black Hispanic NH Asian & Other 2012 Hunting 93.5 2.1 2.3 Fishing 84.8 5.3 4.6 Wildlife Watching (Away from Home) 83.3 6.8 3.1 On Pubic Land 82.3 7.2 3.3 2020 92.1 2.6 2.7 82.1 6.3 79.9 8.2 3.7 78.7 8.7 3.9 2040 87.8 4.1 4.0 74.5 9.0 7.5 70.8 12.0 5.2 69.1 12.7 5.5 2060 82.8 5.8 5.6 66.0 10.0 60.2 16.4 7.0 58.3 17.2 7.3 Source: The Hobby Center for the Study of Texas. Derived from the U.S. Census Bureau, Projections of the Population, Vintage 2012 and The U.S. Fish & Wildlife Service, 2011 National Survey of Fishing, Hunting, and Wildlife Recreation.
 On Pubic Land Source: The Hobby Center for the Study of Texas. Derived from the U.S. Census Bureau, Projections of the Population, Vintage 2012 and The U.S. Fish & Wildlife Service, 2011 National Survey of Fishing, Hunting, and Wildlife Recreation.")
90
Projected Numeric Change in Outdoor Recreation Participants by Activity Type and Race/Ethnicity of Participants Assuming Moderate Rates of International Migration (Main Series), Activity NH White NH Black Hispanic NH Asian & Other Total Hunting -59,110 33,749 72,354 59,335 106,328 Fishing 17,233 225,571 378,121 290,863 911,788 Wildlife Watching (Away from Home) 93,626 36,489 368,857 140,928 639,900 On Pubic Land 69,877 51,467 321,275 124,187 566,806 -501,856 114,258 202,937 180,240 -4,421 -954,159 602,915 1,080,197 877,199 1,606,152 -425,429 106,595 1,022,869 412,077 1,116,112 -353,084 139,361 900,174 361,366 1,047,817 -840,039 93,306 224,659 202,064 -320,010 -1,864,765 500,517 1,174,453 990,769 800,974 -1,304,430 92,196 1,136,039 463,936 387,741 -1,061,151 109,603 1,001,264 407,616 457,332 -1,401,005 241,313 499,950 441,639 -218,103 -2,801,691 1,329,003 2,632,771 2,158,831 3,318,914 -1,636,233 235,280 2,527,765 1,016,941 2,143,753 -1,344,358 300,431 2,222,713 893,169 2,071,955 Source: The Hobby Center for the Study of Texas. Derived from the U.S. Census Bureau, Projections of the Population, Vintage 2012 and The U.S. Fish & Wildlife Service, 2011 National Survey of Fishing, Hunting, and Wildlife Recreation.
 93, , , , ,900. On Pubic Land. 69, , , , , , , , , , , ,915. 1,080, ,199. 1,606, , ,595. 1,022, ,077. 1,116, , , , ,366. 1,047, , , , , , ,864, ,517. 1,174, , , ,304, ,196. 1,136, , , ,061, ,603. 1,001, , , ,401, , , , , ,801,691. 1,329,003. 2,632,771. 2,158,831. 3,318, ,636, ,280. 2,527,765. 1,016,941. 2,143, ,344, ,431. 2,222, ,169. 2,071,955. Source: The Hobby Center for the Study of Texas. Derived from the U.S. Census Bureau, Projections of the Population, Vintage 2012 and The U.S. Fish & Wildlife Service, 2011 National Survey of Fishing, Hunting, and Wildlife Recreation.")
91
Projected Percentage Change in Outdoor Recreation Participants by Activity Type and Race/Ethnicity of Participants Assuming Moderate Rates of International Migration (Main Series), Activity NH White NH Black Hispanic NH Asian & Other Total Hunting -0.5 8.0 24.9 18.5 0.8 Fishing 0.1 9.8 21.4 19.1 2.7 Wildlife Watching (Away from Home) 0.5 6.1 24.1 19.8 2.8 On Pubic Land 0.4 10.1 20.1 3.1 -4.0 25.2 55.9 47.5 0.0 -3.4 23.7 50.3 48.3 4.7 -2.1 16.8 53.8 4.8 -2.2 24.7 54.4 48.7 5.5 -6.9 16.4 39.7 36.1 -2.3 15.9 36.4 36.8 2.2 -6.7 12.5 38.8 36.7 1.6 15.6 39.2 36.9 2.3 -11.0 57.5 172.2 138.0 -1.6 -10.1 148.8 141.6 9.9 -8.3 39.4 164.9 142.7 9.5 58.7 166.6 144.5 11.2 Source: The Hobby Center for the Study of Texas. Derived from the U.S. Census Bureau, Projections of the Population, Vintage 2012 and The U.S. Fish & Wildlife Service, 2011 National Survey of Fishing, Hunting, and Wildlife Recreation.
 On Pubic Land Source: The Hobby Center for the Study of Texas. Derived from the U.S. Census Bureau, Projections of the Population, Vintage 2012 and The U.S. Fish & Wildlife Service, 2011 National Survey of Fishing, Hunting, and Wildlife Recreation.")
92
Hunting Participants by Race/Ethnicity of Participant, 2012 and Projected for 2060
Source: The Hobby Center for the Study of Texas. Derived from the U.S. Census Bureau, Projections of the Population, Vintage 2012 and The U.S. Fish & Wildlife Service, 2011 National Survey of Fishing, Hunting, and Wildlife Recreation.

93
Fishing Participants by Race/Ethnicity of Participant, 2012 and Projected for 2060
Source: The Hobby Center for the Study of Texas. Derived from the U.S. Census Bureau, Projections of the Population, Vintage 2012 and The U.S. Fish & Wildlife Service, 2011 National Survey of Fishing, Hunting, and Wildlife Recreation.

94
Wildlife Watchers by Race/Ethnicity of Participant, 2012 and Projected for 2060
Source: The Hobby Center for the Study of Texas. Derived from the U.S. Census Bureau, Projections of the Population, Vintage 2012 and The U.S. Fish & Wildlife Service, 2011 National Survey of Fishing, Hunting, and Wildlife Recreation.

95
Wildlife Watchers in Public Lands by Race/Ethnicity of Participant, 2012 and Projected for 2060
Source: The Hobby Center for the Study of Texas. Derived from the U.S. Census Bureau, Projections of the Population, Vintage 2012 and The U.S. Fish & Wildlife Service, 2011 National Survey of Fishing, Hunting, and Wildlife Recreation.

96
Number and Percent of Net Change in Projected Recreational Fishing Participants in the United States Due to Each Race/Ethnic Group and Assuming Current (2011) Participation Rates, Race/Ethnicity Number Percent NH White -2,801,691 -84.3 NH Black 1,329,003 40.0 Hispanic 2,632,771 79.3 NH Asian & Other 2,158,831 65.0 Total 3,318,914 100.0 Individuals age 16 years and older who fished at least once in a given year.

97
Number and Percent of Net Change in Projected Hunting Participants in the United States Due to Each Race/Ethnic Group and Assuming Current (2011) Participation Rates, Race/Ethnicity Number Percent NH White -1,401,005 642.3 NH Black 241,313 -110.6 Hispanic 499,950 -229.2 NH Asian & Other 441,639 -202.5 Total -218,103 100.0 Individuals age 16 years and older who hunted at least once in a given year.

98
Number and Percent of Net Change in Projected Wildlife Watching Participants (Away from Home) in the United States Due to Each Race/Ethnic Group and Assuming Current (2011) Participation Rates, Race/Ethnicity Number Percent NH White -1,636,233 -76.3 NH Black 235,280 11.0 Hispanic 2,527,765 117.9 NH Asian & Other 1,016,941 47.4 Total 2,143,753 100.0 Individuals age 16 years and older who observed wildlife at least one mile away from home once in a given year.

99
Percent of the Population Age 16 Years and Older in the United States Who Fished and Projected for 2015 – 2060 Assuming Current Participation Rates by Age, Sex, and Race/Ethnicity Individuals who fished at least once in a given year. Source: Derived from U.S. Census Projections of the Population, Vintage 2012; and 2011 National Survey of Fishing, Hunting, and Wildlife-Associated

100
Percent of the Population Age 16 Years and Older in the United States Who Hunted and Projected for 2015 – 2060 Assuming Current Participation Rates by Age, Sex, and Race/Ethnicity Individuals who hunted at least once in a given year. Source: Derived from U.S. Census Projections of the Population, Vintage 2012; and 2011 National Survey of Fishing, Hunting, and Wildlife-Associated

101
Percent of the Population Age 16 Years and Older in the United States Who Observed Wildlife Away from Home and Projected for 2015 – 2060 Assuming Current Participation Rates by Age, Sex, and Race/Ethnicity Individuals who observed wildlife at least one mile away from home at least once in a given year. Source: Derived from U.S. Census Projections of the Population, Vintage 2012; and 2011 National Survey of Fishing, Hunting, and Wildlife-Associated Recreation

102
NH White Participation Additional Participants Assuming NH White Rates
Projected Number of Participants in Selected Recreational Activities in the United States in 2060 Under the Middle Projections Scenario and Two Alternative Scenarios of Rates of Use Activity Current Participation Rates NH White Participation Additional Participants Assuming NH White Rates Number Percent Hunting 13,516,739 25,984,432 12,467,693 92.2 Fishing 36,700,487 56,963,037 20,262,550 55.2 Freshwater 29,448,551 47,194,521 17,745,970 60.3 Saltwater 10,585,400 14,418,095 3,832,695 36.2 Wildlife Watching 24,792,662 40,250,436 15,457,774 62.3 On Public Land 20,638,978 32,680,664 12,041,686 58.3

103
Projected Numeric Change in Outdoor Recreation Participants by Activity Type and Race/Ethnicity of Participants Assuming Moderate Rates of International Migration (Main Series), Activity NH White NH Black Hispanic NH Asian & Other Total Hunting -59,110 33,749 72,354 59,335 106,328 Fishing 17,233 225,571 378,121 290,863 911,788 Wildlife Watching (Away from Home) 93,626 36,489 368,857 140,928 639,900 On Pubic Land 69,877 51,467 321,275 124,187 566,806 -501,856 114,258 202,937 180,240 -4,421 -954,159 602,915 1,080,197 877,199 1,606,152 -425,429 106,595 1,022,869 412,077 1,116,112 -353,084 139,361 900,174 361,366 1,047,817 -840,039 93,306 224,659 202,064 -320,010 -1,864,765 500,517 1,174,453 990,769 800,974 -1,304,430 92,196 1,136,039 463,936 387,741 -1,061,151 109,603 1,001,264 407,616 457,332 -1,401,005 241,313 499,950 441,639 -218,103 -2,801,691 1,329,003 2,632,771 2,158,831 3,318,914 -1,636,233 235,280 2,527,765 1,016,941 2,143,753 -1,344,358 300,431 2,222,713 893,169 2,071,955 Source: The Hobby Center for the Study of Texas. Derived from the U.S. Census Bureau, Projections of the Population, Vintage 2012 and The U.S. Fish & Wildlife Service, 2011 National Survey of Fishing, Hunting, and Wildlife Recreation.
 93, , , , ,900. On Pubic Land. 69, , , , , , , , , , , ,915. 1,080, ,199. 1,606, , ,595. 1,022, ,077. 1,116, , , , ,366. 1,047, , , , , , ,864, ,517. 1,174, , , ,304, ,196. 1,136, , , ,061, ,603. 1,001, , , ,401, , , , , ,801,691. 1,329,003. 2,632,771. 2,158,831. 3,318, ,636, ,280. 2,527,765. 1,016,941. 2,143, ,344, ,431. 2,222, ,169. 2,071,955. Source: The Hobby Center for the Study of Texas. Derived from the U.S. Census Bureau, Projections of the Population, Vintage 2012 and The U.S. Fish & Wildlife Service, 2011 National Survey of Fishing, Hunting, and Wildlife Recreation.")
104
Projected Participants in Outdoor Recreation Activities by Activity Type and Race/Ethnicity of Participants Assuming Moderate Rates of International Migration (Main Series), Activity NH White NH Black Hispanic NH Asian & Other Total 2012 Hunting 12,704,502 419,920 290,399 320,021 13,734,842 Fishing 27,773,769 2,313,058 1,769,679 1,525,067 33,381,573 Wildlife Watching (Away from Home) 19,805,955 597,081 1,533,173 712,700 22,648,909 On Pubic Land 16,103,424 511,833 1,333,825 617,941 18,567,023 2020 12,645,392 453,669 362,753 379,356 13,841,170 27,791,002 2,538,629 2,147,800 1,815,930 34,293,361 19,899,581 633,570 1,902,030 853,628 23,288,809 16,173,301 563,300 1,655,100 742,128 19,133,829 2040 12,143,536 567,927 565,690 559,596 13,836,749 26,836,843 3,141,544 3,227,997 2,693,129 35,899,513 19,474,152 740,165 2,924,899 1,265,705 24,404,921 15,820,217 702,661 2,555,274 1,103,494 20,181,646 2060 11,303,497 661,233 790,349 761,660 13,516,739 24,972,078 3,642,061 4,402,450 3,683,898 36,700,487 18,169,722 832,361 4,060,938 1,729,641 24,792,662 14,759,066 812,264 3,556,538 1,511,110 20,638,978 Source: The Hobby Center for the Study of Texas. Derived from the U.S. Census Bureau, Projections of the Population, Vintage 2012 and The U.S. Fish & Wildlife Service, 2011 National Survey of Fishing, Hunting, and Wildlife Recreation.
 19,805, ,081. 1,533, , ,648,909. On Pubic Land. 16,103, ,833. 1,333, , ,567, ,645, , , , ,841, ,791,002. 2,538,629. 2,147,800. 1,815, ,293, ,899, ,570. 1,902, , ,288, ,173, ,300. 1,655, , ,133, ,143, , , , ,836, ,836,843. 3,141,544. 3,227,997. 2,693, ,899, ,474, ,165. 2,924,899. 1,265, ,404, ,820, ,661. 2,555,274. 1,103, ,181, ,303, , , , ,516, ,972,078. 3,642,061. 4,402,450. 3,683, ,700, ,169, ,361. 4,060,938. 1,729, ,792, ,759, ,264. 3,556,538. 1,511, ,638,978. Source: The Hobby Center for the Study of Texas. Derived from the U.S. Census Bureau, Projections of the Population, Vintage 2012 and The U.S. Fish & Wildlife Service, 2011 National Survey of Fishing, Hunting, and Wildlife Recreation.")
105
U.S. Boat Owners

106
Adult Recreational Boat Ownership Rates in the United States by Sex and Age, 2010
Adults who owned at least one recreational boat. Source: Derived from 2010 U.S. Census; and 2010 Recreational Boating Statistical Abstract

107
Adult Recreational Boat Ownership Rates in the United States by Race/Ethnicity, 2010
Adults who owned at least one recreational boat. Source: Derived from 2010 U.S. Census; and 2010 Recreational Boating Statistical Abstract

108
Adult Population (in Millions) in the United States by Race/Ethnicity in 2010 and Projected to and Numeric and Percent Change, Year/ Time Period NH White Black Hispanic NH Asian & Other Total 2010 157,101 27,324 33,347 16,793 234,564 2020 163,705 32,835 44,413 18,754 259,707 2030 166,463 36,672 58,663 23,913 285,711 2040 166,789 40,480 74,917 29,455 311,641 2050 164,732 43,953 93,360 35,393 337,438 Numeric Change 6,604 5,511 11,066 1,961 25,143 2,758 3,837 14,250 5,159 26,004 326 3,808 16,254 5,542 25,930 -2,057 3,473 18,443 5,938 25,797 7,631 16,629 60,013 18,600 102,874 Percent Change 4.2 20.2 33.2 11.7 10.7 1.7 32.1 27.5 10.0 0.2 10.4 27.7 23.2 9.1 -1.2 8.6 24.6 8.3 4.9 60.9 180.0 110.8 43.9 Adults who participated in recreational boating at least once during a given year. Source: U.S. Census Projections of the Population, 2008 and 2010 U.S. Census

109
Adult Recreational Boat Owners (in millions) in the United States by Race/Ethnicity in 2010 and Projected to Assuming Current (2010) Ownership Rates and Numeric and Percent Change, Year NH White Black Hispanic NH Asian & Other Total 2010 27,962 1,284 1,478 1,412 32,135 2020 28,895 1,573 2,161 1,676 34,305 2030 28,606 1,782 2,994 2,203 35,585 2040 28,746 2,012 3,882 2,764 37,404 2050 28,426 2,222 4,906 3,350 38,904 Numeric Change 933 289 683 264 2,170 -289 209 833 527 1,280 140 230 888 561 1,819 -320 210 1,024 586 1,500 464 938 3,428 1,938 6,769 Percent Change 3.3 22.5 46.2 18.7 6.8 -1.0 13.3 38.5 31.4 3.7 0.5 12.9 29.7 25.5 5.1 -1.1 10.4 26.4 21.2 4.0 1.7 73.1 231.9 137.3 21.1 Adults who owned at least one recreational boat. Source: Derived from U.S. Census Projections of the Population, 2008; 2010 U.S. Census; and 2010 Recreational Boating Statistical Abstract

110
Percent of Total Adult Recreational Boat Owners in the United States by Race/Ethnicity in 2010 and Projected to 2050 Assuming Current (2010) Ownership Rates by Age and Race/Ethnicity, Year NH White Black Hispanic NH Asian & Other Total 2010 87.0 4.0 4.6 4.4 100.0 2020 84.2 6.3 4.9 2030 80.4 5.0 8.4 6.2 2040 76.9 5.4 10.4 7.4 2050 73.1 5.7 12.6 8.6 Adults who owned at least one recreational boat. Source: Derived from U.S. Census Projections of the Population, 2008; 2010 U.S. Census; and 2010 Recreational Boating Statistical Abstract

111
Percent of Total Adult Recreational Boat Owners in the United States by Race/Ethnicity in 2010 and Projected to 2050 Assuming Current (2010) Ownership Rates 2010 2050 Source: Derived from U.S. Census Projections of the Population, 2008; 2010 U.S. Census; and 2010 Recreational Boating Statistical Abstract

112
Number (in thousands) and Percent of Net Change in Projected Adult Recreational Boat Owners in the United States Due to Each Race/Ethnic Group and Assuming Current (2010) Ownership Rates, Race/Ethnicity Number Percent NH White 464 6.9 NH Black 938 13.9 Hispanic 3,428 50.6 NH Asian & Other 1,938 28.6 Total 6,769 100.0 Adults who owned at least one recreational boat. Source: Derived from U.S. Census Projections of the Population, 2008; 2010 U.S. Census; and 2010 Recreational Boating Statistical Abstract

113
Adult Recreational Boat Ownership in the United
States (in millions) in 2010 and Projected Under Alternative Assumptions for Adults who owned at least one recreational boat. Source: Derived from U.S. Census Projections of the Population, 2008; 2010 U.S. Census; and 2010 Recreational Boating Statistical Abstract
 in 2010 and Projected Under. Alternative Assumptions for Adults who owned at least one recreational boat. Source: Derived from U.S. Census Projections of the Population, 2008; 2010 U.S. Census; and 2010 Recreational Boating Statistical Abstract.")
114
EDUCATION

116
Mean Household Income by Race/Ethnicity,
Educational Attainment, and Occupation In Texas in 2010 Occupations Less Than High School /GED Bachelor's Degree Graduate/ Prof Degree NH White Managerial & Professional $ 72,446 $ 84,504 $ 120,792 $ 149,819 Technical, Sales, & Admin. 52,930 64,179 112,843 130,471 Precision Prod., Craft, & Repairers 55,079 68,247 94,875 119,057 Operatives and Laborers 48,819 61,211 77,581 89,720 Total 50,533 64,975 114,698 144,714 NH Black $ 47,483 $ 52,186 $ 84,758 $ 99,073 33,980 43,933 75,416 80,852 42,767 53,192 82,885 69,805 37,811 46,296 66,181 63,707 31,072 42,465 78,933 94,490 Hispanic $ 52,178 $ 61,992 $ 88,036 $ 116,400 40,131 50,127 81,005 91,155 42,302 51,527 63,695 63,345 41,273 47,455 54,282 57,806 38,221 47,760 81,548 108,473 NH Asian & Other $ 84,172 $ 73,016 $ 103,737 $ 130,603 52,764 60,719 86,039 105,469 54,594 63,451 70,778 92,041 47,939 49,015 60,895 65,074 50,815 55,496 93,474 123,035 Source: Ruggles et al. 2010; U.S. Census Bureau, American Community Survey 2010 Public Use Microdata Sample, 2011.

117
U.S. EDUCATION

118
Projected Elementary and Secondary School, Community College and Public University Enrollment in the United States by Race/Ethnicity,

119
Percent of Projected Elementary and Secondary School, Community College and Public University Enrollment in the United States by Race/Ethnicity,

120
Percent of Net Change in Elementary and Secondary School, Community College and Public University Enrollment in the United States Due to Each Race/Ethnicity,

121
TEXAS EDUCATION Hobby Center for the Study of Texas at Rice University

122
Total Public Education (All Levels)* 2010 2,137,393 832,202 2,805,785
Total Public Education (All Levels) and Public Elementary and Secondary School Enrollment in Texas by Race/Ethnicity in 2010 and Projected to 2050 Using the Projections That Assume 2000–2010 Rates of Net Migration for Texas Year NHa White NH Black Hispanic NH Asian & Other Total Total Public Education (All Levels)* 2010 2,137,393 832,202 2,805,785 348,791 6,124,171 2020 2,109,148 874,294 3,490,796 533,046 7,007,284 2030 2,128,376 955,194 4,428,574 682,196 8,194,340 2040 2,037,804 1,028,997 5,778,539 973,986 9,819,326 2050 1,979,109 1,095,342 7,207,206 1,469,755 11,751,412 Public Elementary and Secondary Schools 1,547,693 632,401 2,398,684 269,066 4,847,844 1,548,792 646,756 2,917,449 406,755 5,519,752 1,577,470 706,263 3,715,984 480,533 6,480,250 1,479,111 754,173 4,865,439 726,452 7,825,175 1,446,198 798,125 6,012,677 1,109,443 9,366,443 Source: Projections by the authors and 2010 data and rates derived from Texas Education Agency, Enrollment in Texas Public Schools , 2011; Texas Higher Education Coordinating Board, Demographic Data for Public Community College and University Students for , 2011. *Excludes public health related educational institutions.
 and Public Elementary and Secondary School Enrollment in Texas by Race/Ethnicity in 2010 and Projected to 2050 Using the Projections That Assume 2000–2010 Rates of Net Migration for Texas. Year. NHa White. NH Black. Hispanic. NH Asian. & Other. Total. Total Public Education (All Levels)* ,137, ,202. 2,805, ,791. 6,124, ,109, ,294. 3,490, ,046. 7,007, ,128, ,194. 4,428, ,196. 8,194, ,037,804. 1,028,997. 5,778, ,986. 9,819, ,979,109. 1,095,342. 7,207,206. 1,469, ,751,412. Public Elementary and Secondary Schools. 1,547, ,401. 2,398, ,066. 4,847,844. 1,548, ,756. 2,917, ,755. 5,519,752. 1,577, ,263. 3,715, ,533. 6,480,250. 1,479, ,173. 4,865, ,452. 7,825,175. 1,446, ,125. 6,012,677. 1,109,443. 9,366,443. Source: Projections by the authors and 2010 data and rates derived from Texas Education Agency, Enrollment in Texas Public Schools , 2011; Texas Higher Education Coordinating Board, Demographic Data for Public Community College and University Students for , *Excludes public health related educational institutions.")
123
Total Public Education (All Levels)* 2010 34.9 13.6 45.8 5.7 2020 30.1
Percent of Total Public Education (All Levels), Public Elementary and Secondary School Enrollment in Texas by Race/Ethnicity in 2010 and Projected to 2050 Using the Projections That Assume 2000– 2010 Rates of Net Migration for Texas Year NH White NH Black Hispanic NH Asian & Other Total Public Education (All Levels)* 2010 34.9 13.6 45.8 5.7 2020 30.1 12.5 49.8 7.6 2030 26.0 11.7 54.0 8.3 2040 20.8 10.5 58.8 9.9 2050 16.8 9.3 61.3 12.6 Public Elementary and Secondary Schools 31.9 13.0 49.5 5.6 28.1 52.9 7.3 24.3 10.9 57.3 7.5 18.9 9.6 62.2 15.4 8.5 64.2 11.9 Source: Projections by the authors and 2010 data and rates derived from Texas Education Agency, Demographic Data for Public School Students for , 2011;Texas Education Agency, Enrollment in Texas Public Schools , 2011; Texas Higher Education Coordinating Board 2011, Demographic Data for Public Community College and University Students for , 2011. *Excludes public health related educational institutions. Note: Enrollment data based on school years.
, Public Elementary and Secondary School Enrollment in Texas by Race/Ethnicity in 2010 and Projected to 2050 Using the Projections That Assume 2000– 2010 Rates of Net Migration for Texas. Year. NH White. NH Black. Hispanic. NH Asian. & Other. Total Public Education (All Levels)* Public Elementary and Secondary Schools Source: Projections by the authors and 2010 data and rates derived from Texas Education Agency, Demographic Data for Public School Students for , 2011;Texas Education Agency, Enrollment in Texas Public Schools , 2011; Texas Higher Education Coordinating Board 2011, Demographic Data for Public Community College and University Students for , *Excludes public health related educational institutions. Note: Enrollment data based on school years.")
124
Public Community Colleges Total Public Colleges and Universities*
Public Community College, Public University, and Total Public College and University Enrollment in Texas by Race/Ethnicity in 2010 and Projected to 2050 Using the Projections That Assume 2000– 2010 Rates of Net Migration for Texas Year NHa White NH Black Hispanic NH Asian & Other Total Public Community Colleges 2010 314,976 130,786 263,600 37,261 746,623 2020 299,721 149,167 370,868 58,999 878,755 2030 296,231 163,939 459,618 92,693 1,012,481 2040 297,987 181,123 590,855 117,643 1,187,608 2050 285,152 196,248 771,788 170,627 1,423,815 Public Universities* 274,724 69,015 143,501 42,464 529,704 260,635 78,371 202,479 67,292 608,777 254,675 84,992 252,972 108,970 701,609 260,706 93,701 322,245 129,891 806,543 247,759 100,969 422,741 189,685 961,154 Total Public Colleges and Universities* 589,700 199,801 407,101 79,725 1,276,327 560,356 227,538 573,347 126,291 1,487,532 550,906 248,931 712,590 201,663 1,714,090 558,693 274,824 913,100 247,534 1,994,151 532,911 297,217 1,194,529 360,312 2,384,969 Source: Projections by the authors and 2010 data and rates derived from Texas Higher Education Coordinating Board, Demographic Data for Public Community College and University Students for , 2011. *Excludes public health related educational institutions.

125
Public Community Colleges Total Public Colleges and Universities*
Public Community College, Public University, and Total Public College and University Enrollment in Texas by Race/Ethnicity in 2010 and Projected to 2050 Using the Projections That Assume 2000–2010 Rates of Net Migration for Texas Year NH White NH Black Hispanic NH Asian & Other Public Community Colleges 2010 42.2 17.5 35.3 5.0 2020 34.1 17.0 6.7 2030 29.3 16.2 45.4 9.1 2040 25.1 15.3 49.8 9.8 2050 20.0 13.8 54.2 12.0 Public Universities* 51.9 13.0 27.1 8.0 42.8 12.9 33.3 11.0 36.3 12.1 36.1 15.5 32.3 11.6 40.0 16.1 25.8 10.5 44.0 19.7 Total Public Colleges and Universities* 46.2 15.7 31.9 6.2 37.7 38.5 8.5 32.1 14.5 41.6 11.8 28.0 45.8 12.4 22.3 12.5 50.1 15.1 Source: Projections by the authors and 2010 data and rates derived from Texas Higher Education Coordinating Board 2011, Demographic Data for Public Community College and University Students for , 2011. *Excludes public health related educational institutions. Note: Enrollment data based on school years.

128
Mean Annual Income and Consumer Expenditures in Texas in 2010 and Projected Under Alternative Assumptions for Race/Ethnicity Income and Expenditures in 2050 (in 2010 Dollars)
")
129
Aggregate Annual State Tax Revenues in 2010 and Projected Under Alternative Assumptions for 2050 (in Billions of 2010 Dollars)
")
132
The mark of a truly educated man is to be moved deeply by statistics.
George Bernard Shaw

133
Website: http://hobbycenter.rice.edu
Steve Murdock Phone: Website:

Similar presentations