Download presentation
Presentation is loading. Please wait.

1
II. Operations Strategy and Process Choice
Operations Management and Competitive Advantages “An Efficiency Drive” “Case Study: Burger Time” Process Types and The Product-Process Matrix Case Discussion: Kristen’s Cookies Process Flow Diagram and Gantt Chart Articles: Can Marketing and Manufacturing Coexist? – HBR Competing on Capabilities: The New Rules of Corporate Strategy – HBR

2
An Efficiency Drive How critical is time for drive-through?
Is drive-through a good deal for the restaurants? What are the efforts to save time? Implications

3
Case Discussion: Burger Time
What are the major operational differences between McDonald’s and Burger King? How do these differences relate to each company’s competitive strategies? What implications do these differences have for the management of operations?

5
Competitive Advantages and Operations Management
Price Cost Quality Customer service Consistent quality Time Rapid, reliable delivery Variety Operations Management Match supply with demand Quantitative methods and qualitative strategies to ensure efficient use of resources find the right balance between competing objectives improve performance along multiple dimensions simultaneously What drives a customers to buy a product? What do you pay attention to when you buy? Pizza, paint, pc; Competitive edge: fast, cheap and good. Product and process attributes. Cost – efficiency and lean Fast – inventory or capacity Variety – flexibility Quality – precision equipment, highly trained people. -Would you expect the structure of Sam’s club and a boutique (say Chanel’s) to be similar in terms of production and distribution? -Would you expect FedEx and UPS to be structured the same way? FedEx: 8:00pm-12:00am, everything goes to Memphis; 12:00am-morning, everything goes to its destination by plan. Not cheap and efficient, but fast. UPS: uses trucks (low cost) -Recall Sears tried to cast itself in the Wal-Mart mode with every day low pricing. Did Sears have the appropriate capabilities to do this? Sears (specialty and variety) vs. Wal-Mart: Sears tried to match Wal-Mart’s price - War-Mart: Corporate strategy (providing customers access to quality goods, when and where needed, at competitive price), Key operational capabilities (short cycle times, low inventory), margin 1-3%, 1% cost reduction you double your margin. The most significant cost is markdown. Operational Structure (focused location, cross docking, EDI, fast transportation system, communication btw retail stores). In retail, only 30% of clothing is sold at full price. 80% of K-Mart stores are within 7 minute drive of a Wal-Mart location. For those stores closed, “I can not think of any discounter who would be insane enough to want to compete with Wal-Mart” said an A.G. Edwards retail analyst, according to a WSJ article on 1/24/2002. SW Airlines: the only consistently profitable airline. Similar strategy. Carefully chosen routes, no hub, fewest employees. Best on time and baggage handling record. The service outputs that customers desire can be represented in terms of these capabilities that help Operations win orders. 1. Ask for examples of companies and what is the key factor that allows them to make a sale or gain a customer. Try to group the examples under the broad categories above. 2. While visiting a company or consulting a company, look for their capabilities and ask what you can do. Article: Competing on Capabilities: The New Rules of Corporate Strategy
 to be similar in terms of production and distribution -Would you expect FedEx and UPS to be structured the same way FedEx: 8:00pm-12:00am, everything goes to Memphis; 12:00am-morning, everything goes to its destination by plan. Not cheap and efficient, but fast. UPS: uses trucks (low cost) -Recall Sears tried to cast itself in the Wal-Mart mode with every day low pricing. Did Sears have the appropriate capabilities to do this Sears (specialty and variety) vs. Wal-Mart: Sears tried to match Wal-Mart’s price. - War-Mart: Corporate strategy (providing customers access to quality goods, when and where needed, at competitive price), Key operational capabilities (short cycle times, low inventory), margin 1-3%, 1% cost reduction you double your margin. The most significant cost is markdown. Operational Structure (focused location, cross docking, EDI, fast transportation system, communication btw retail stores). In retail, only 30% of clothing is sold at full price. 80% of K-Mart stores are within 7 minute drive of a Wal-Mart location. For those stores closed, I can not think of any discounter who would be insane enough to want to compete with Wal-Mart said an A.G. Edwards retail analyst, according to a WSJ article on 1/24/2002. SW Airlines: the only consistently profitable airline. Similar strategy. Carefully chosen routes, no hub, fewest employees. Best on time and baggage handling record. The service outputs that customers desire can be represented in terms of these capabilities that help Operations win orders. 1. Ask for examples of companies and what is the key factor that allows them to make a sale or gain a customer. Try to group the examples under the broad categories above. 2. While visiting a company or consulting a company, look for their capabilities and ask what you can do. Article: Competing on Capabilities: The New Rules of Corporate Strategy.")
6
Performance Dimensions in Retail Banking
Quality: courteous services, consistency (reliability), accurate information (credibility), empathy, timely information (customer responsiveness), conformance, employee skill and knowledge Time: delivery speed (waiting time), convenient services (access), on time delivery (account statements), handling customer complaints Flexibility: a broad line of financial products, system responsiveness, new product introduction speed, rapid staff changes, customizations Cost: cost effective back and front-office labor productivity, cost effective back-office technology innovations, transaction processing costs Setting priorities. If short lines have a higher priority to the bank’s target customers than extended hours, then labor use must be adjusted accordingly. The tradeoff is between flexibility (of access to the service) and speed. Focusing operations: Lens Crafters’ priority is speed, so it targets all of its equipment and procedures toward fast turnaround; H&R Block’s priority is low cost, so its operating system is geared to volume; First Wachovia Bank and Trust of North Carolina emphasizes relationship banking, so its operating system excels at database management; and Accenture, which prides itself on being able to provide consulting anywhere in the world at the drop of a hat, focuses its operating organization on getting its consulting staff quickly into the field. KFC got into trouble a few years ago when it introduced spareribs. Its technology and operating system were designed around frying and pressure cooking, not barbecuing. The result: soggy ribs served by frustrated workers. Unique problem with focused units for service: customers don’t like to be treated as high-volume products, even when the cost is low; typical direct service worker is often ill prepared in skills and policy knowledge to effectively customize a service. Sometimes, overly ambitious marketing programs have made promises that ops can’s keep. An airline billboard ad several years ago showed flight attendants lavishing personal service on passengers flying coach in a 747.
, accurate information (credibility), empathy, timely information (customer responsiveness), conformance, employee skill and knowledge. Time: delivery speed (waiting time), convenient services (access), on time delivery (account statements), handling customer complaints. Flexibility: a broad line of financial products, system responsiveness, new product introduction speed, rapid staff changes, customizations. Cost: cost effective back and front-office labor productivity, cost effective back-office technology innovations, transaction processing costs. Setting priorities. If short lines have a higher priority to the bank’s target customers than extended hours, then labor use must be adjusted accordingly. The tradeoff is between flexibility (of access to the service) and speed. Focusing operations: Lens Crafters’ priority is speed, so it targets all of its equipment and procedures toward fast turnaround; H&R Block’s priority is low cost, so its operating system is geared to volume; First Wachovia Bank and Trust of North Carolina emphasizes relationship banking, so its operating system excels at database management; and Accenture, which prides itself on being able to provide consulting anywhere in the world at the drop of a hat, focuses its operating organization on getting its consulting staff quickly into the field. KFC got into trouble a few years ago when it introduced spareribs. Its technology and operating system were designed around frying and pressure cooking, not barbecuing. The result: soggy ribs served by frustrated workers. Unique problem with focused units for service: customers don’t like to be treated as high-volume products, even when the cost is low; typical direct service worker is often ill prepared in skills and policy knowledge to effectively customize a service. Sometimes, overly ambitious marketing programs have made promises that ops can’s keep. An airline billboard ad several years ago showed flight attendants lavishing personal service on passengers flying coach in a 747.")
7
The changing sources of competitive advantage
Low Cost & Scale Economies (< 1960s) Focused Factories (mid 1960s) Flexible Factories and Product variety (1970s) Quality (1980s) Time (late 1980s-1990s--> ) How can operations help a company compete? low cost and Scale Economies (<1960s) --> You can have any color car you want as long as it is black . Make it simple and efficient, low cost. But you can only sell so many black cars. Focused Factories (mid 60s) --> complexity begins to dominate economies of scale. Focused factories emerge as an effort to reduce complexity while achieve efficiency. Flexible --> As customers demand more variety, you need a car for every taste and purse size Quality --> is quality free? Almost, since it pays for itself in a hurry Time --> - We love your product, but where is it? - Don’t sell what you produce, produce what sells? TBC. The internet - infinite flexibility with immediate response times. Premium on agility to go after the right market. A few of these measures show very often Time, Rate, and cost (Inventory). How can these translate into operations measures? Managers can control only internal measures of processes performance, whether financial or operational. If operational measures are chosen properly, they can serve as indicators not only of customer satisfaction, but also of financial financial performance.
 Focused Factories (mid 1960s) Flexible Factories and Product variety (1970s) Quality (1980s) Time (late 1980s-1990s--> ) How can operations help a company compete low cost and Scale Economies (<1960s) --> You can have any color car you want as long as it is black . Make it simple and efficient, low cost. But you can only sell so many black cars. Focused Factories (mid 60s) --> complexity begins to dominate economies of scale. Focused factories emerge as an effort to reduce complexity while achieve efficiency. Flexible --> As customers demand more variety, you need a car for every taste and purse size. Quality --> is quality free Almost, since it pays for itself in a hurry. Time --> - We love your product, but where is it - Don’t sell what you produce, produce what sells TBC. The internet - infinite flexibility with immediate response times. Premium on agility to go after the right market. A few of these measures show very often Time, Rate, and cost (Inventory). How can these translate into operations measures Managers can control only internal measures of processes performance, whether financial or operational. If operational measures are chosen properly, they can serve as indicators not only of customer satisfaction, but also of financial financial performance.")
8
Process types: Match Supply with Demand
Economics Two options Make supply after demand: Make to order (MTO) Make supply before demand: Make to stock (MTS) Matching supply with demand means
 Make supply before demand: Make to stock (MTS) Matching supply with demand means.")
9
Process Types: Resource Types and Layout
Job Shop process General purposed/flexible resources Process focused layout: Jobs have flexible routing, go from one resource to another as needed Wide variety of products, customized products Batch process Similar to JS, but with larger lot sizes, some EOS, more commonality in the resources required, still not cost effective to build a dedicated assembly line. Discrete flow process Product focused layout: Fixed (possibly automated) flow of products, tightly connected stages (WIP is automatically managed), specialized tasks Heavily capitalized High volume Continuous flow process Product focused layout heavily capitalized Product is a commodity – no discrete units, minimal variety, high volume
 flow of products, tightly connected stages (WIP is automatically managed), specialized tasks. Heavily capitalized. High volume. Continuous flow process. Product focused layout. heavily capitalized. Product is a commodity – no discrete units, minimal variety, high volume.")
10
Matching Products and Processes
Low volume Low Standardization One of a kind Low volume Many Products Higher volume Few Major Products High volume High Standardization Commodity Products Process Opportunity Costs JOB SHOP Scheduling, Materials Handling, Shifting Bottlenecks Jumbled Flow. Process segments loosely linked. (Commercial Printer, Ph.D program) Disconnected Line Flow/Jumbled Flow but a dominant flow exists. BATCH Worker Motivation, Balance, Maintaining Flexibility (Heavy Equipment, MBA program) Out-of-pocket Costs DISCRETE FLOWS Connected Line Flow (assembly line) Diagonal. What made you choose a job shop, batch process …? What kind of product volume (one unit, so on) makes you choose a job shop? Low. Naturally lead to High volume at a flow shop. The controversial one is whether a job shop should be equipped with specialized machines or general purpose ones? You need machine can do lot of jobs. A welding machine at assembly line, repeats many times on the same product. Bottle manufacturer, it takes a long time to cool it down, clear it up, and get it going again. Setup. Consulting firms like people can switch between projects quickly. If you are in batch process mood, they don’t like it. So job shop is kind of a jumbled flow. If you walk around a job shop, you see jobs wonder around, back and forth. If a dominant flow exists and the product is relatively low volume. If there is a big setup, we are likely to produce a red one before producing a blue one. In an assembly line, we make a few major products, say Dodge Carivans and Chrysler Voyagers. How are those different, BTY? Name plates. The profits are very different. There are managerial and costs challenges in each case. (inv. mgmt at higher flexibility, utilization at CFS, worker motivation at DFS, scheduling at Batch). Cost challenges: Two things (corners). If you have a job shop and end up producing one or two major products, you may not be as efficient. Too much waiting and moving. General purpose equipment is not used as it is designed for. Ex: Volvo. If you end up producing a lot of different products, but have a product layout (high investment on equipment), then the manufacturing cost will be a lot more than it should be. Ex: Webvan. It is investment cost vs. the marginal cost. Matrix: concentrate on variety dimension of the product and process. Match products with processes. Mass customization: Levi, GE (dishwasher), TV digital ads during games for different markets. Most systems are mixed processes. Front end, back end. Product life cycle vs. process types. (Auto Assembly) Continuous, automated, rigid line flow. Process segments tightly linked. CONTINUOUS FLOW Capital Investment for big chunk capacity, Technological Change, Vertical Integration (Oil Refinery) Managerial Challenges Bidding, delivery, product design flexibility Quality & Product Differentiation, output volume flexibility Price
 Disconnected Line. Flow/Jumbled Flow. but a dominant flow. exists. BATCH. Worker Motivation, Balance, Maintaining Flexibility. (Heavy Equipment, MBA program) Out-of-pocket Costs. DISCRETE FLOWS. Connected Line. Flow (assembly line) Diagonal. What made you choose a job shop, batch process … What kind of product volume (one unit, so on) makes you choose a job shop Low. Naturally lead to High volume at a flow shop. The controversial one is whether a job shop should be equipped with specialized machines or general purpose ones You need machine can do lot of jobs. A welding machine at assembly line, repeats many times on the same product. Bottle manufacturer, it takes a long time to cool it down, clear it up, and get it going again. Setup. Consulting firms like people can switch between projects quickly. If you are in batch process mood, they don’t like it. So job shop is kind of a jumbled flow. If you walk around a job shop, you see jobs wonder around, back and forth. If a dominant flow exists and the product is relatively low volume. If there is a big setup, we are likely to produce a red one before producing a blue one. In an assembly line, we make a few major products, say Dodge Carivans and Chrysler Voyagers. How are those different, BTY Name plates. The profits are very different. There are managerial and costs challenges in each case. (inv. mgmt at higher flexibility, utilization at CFS, worker motivation at DFS, scheduling at Batch). Cost challenges: Two things (corners). If you have a job shop and end up producing one or two major products, you may not be as efficient. Too much waiting and moving. General purpose equipment is not used as it is designed for. Ex: Volvo. If you end up producing a lot of different products, but have a product layout (high investment on equipment), then the manufacturing cost will be a lot more than it should be. Ex: Webvan. It is investment cost vs. the marginal cost. Matrix: concentrate on variety dimension of the product and process. Match products with processes. Mass customization: Levi, GE (dishwasher), TV digital ads during games for different markets. Most systems are mixed processes. Front end, back end. Product life cycle vs. process types. (Auto Assembly) Continuous, automated, rigid line flow. Process segments tightly. linked. CONTINUOUS FLOW. Capital Investment for big. chunk capacity, Technological Change, Vertical Integration. (Oil Refinery) Managerial. Challenges. Bidding, delivery, product design flexibility. Quality & Product Differentiation, output volume flexibility. Price.")
12
Process Flow Diagram: Kristen’s Cookies
Mix Spoon Set oven Bake Cool Pack Pay Time (minutes/dozen) Capacity (dozen/minute, for orders of 1 dozen) Blank this slide and show the Corning process for improving processes. An crucial step is to identify the process and process owner. If things go wrong, you know who is responsible. Mathew owns this process. Flow through quickly. Kristen’s Cookies Do you think it is a good business? Depends: :-) How long does it take to make a dozen cookies? 26 minutes if nothing else is in process. An important notion getting out of any process analysis is to what extend the resources get in the way or limiting and the products getting in each other’s way. So it could take longer than 26 minutes. How many cookies can Kristen and her roommate get done for a night? Student: 23. Joe: Why is that? Different answer? Student: 22. You lose time at the beginning and the end. (4 hours*60minutes/hr-8 lost at the beginning for mixing and and spooning - 8 lost at the end for cooling, packing, and payment)/10= One batch comes out every 10 minutes. It probably doesn’t matter because they would more likely to continue until they finish the last batch. That is a real person would do, although it denies the assumption. Student: do we have to assume there are more than one tray? It does make a difference. One of the other issues is what is the bottleneck. It can be a manufacturing (product service in this case) step or one of the resources. I want you to get out here is the interplay between the process time and the resources. How many trays would you buy? At least two. Would buy several. I would never want to let a try to slow me down. Trays are cheap. A paper making making costs $1b, but a paper slitter is cheaper $10,000. I think we need three. How much labor time per order? $8 for Kristen and $6 for roommate. Depends on batches of one dozen, or two dozens or three dozens. You save time by mixing several dozen. You probably won’t want more than four dozens. How many would buy four dozen of cookies? Laugh. Should you give a discount? Maybe for two dozen or three dozen, but not four dozen, because you lose the advantage as we talked. 60 cents for $6 labor cost. Labor is an interesting issue. How much does the labor cost? Kristen is the owner and she gets to decide how much her time is worth and sees if the business pays her time. She and her roommate have some contractual arrangement. The question is do you pay her only for the time she is working or for the whole four hours? You get different answers. If you assume that the resource (in this case, labor) is totally flexible and can go between jobs with little setup, then you can afford to pay a fair amount. If you are only going to pay the time she is actually working, that is not a typical way of arrangement. Pay by the cookie? A standard pay. A repair shop charge based on the job not time. They standard labor hours for different jobs. A two hour repair may cost you six hours labor charge. What about another oven? Too expensive. Look at demand, which can become a bottleneck, currently the oven is. If they do have another oven and the demand is there, there is another bottleneck waiting there to bite you. Student: We can not make all the decisions just based on the info in the case. Joe: agree. I just want to get you through the process analysis. There are lot of business processes that are not captured by the process chart. We may be able to spit the work better between the two. Student: I can rent my oven. Joe: so there is some flexible resource, but there is transportation cost. MTO is what they promise to their customers. But you don’t have to make the whole thing MTO. Start some processes ahead of time and put them in the refrigerator. Use Joe’s notes!! Slide. Max batch 3d d d d Resources K K R, Oven Oven R R
 Capacity. (dozen/minute, for orders of 1 dozen) Blank this slide and show the Corning process for improving processes. An crucial step is to identify the process and process owner. If things go wrong, you know who is responsible. Mathew owns this process. Flow through quickly. Kristen’s Cookies. Do you think it is a good business Depends: :-) How long does it take to make a dozen cookies 26 minutes if nothing else is in process. An important notion getting out of any process analysis is to what extend the resources get in the way or limiting and the products getting in each other’s way. So it could take longer than 26 minutes. How many cookies can Kristen and her roommate get done for a night Student: 23. Joe: Why is that Different answer Student: 22. You lose time at the beginning and the end. (4 hours*60minutes/hr-8 lost at the beginning for mixing and and spooning - 8 lost at the end for cooling, packing, and payment)/10= One batch comes out every 10 minutes. It probably doesn’t matter because they would more likely to continue until they finish the last batch. That is a real person would do, although it denies the assumption. Student: do we have to assume there are more than one tray It does make a difference. One of the other issues is what is the bottleneck. It can be a manufacturing (product service in this case) step or one of the resources. I want you to get out here is the interplay between the process time and the resources. How many trays would you buy At least two. Would buy several. I would never want to let a try to slow me down. Trays are cheap. A paper making making costs $1b, but a paper slitter is cheaper $10,000. I think we need three. How much labor time per order $8 for Kristen and $6 for roommate. Depends on batches of one dozen, or two dozens or three dozens. You save time by mixing several dozen. You probably won’t want more than four dozens. How many would buy four dozen of cookies Laugh. Should you give a discount Maybe for two dozen or three dozen, but not four dozen, because you lose the advantage as we talked. 60 cents for $6 labor cost. Labor is an interesting issue. How much does the labor cost Kristen is the owner and she gets to decide how much her time is worth and sees if the business pays her time. She and her roommate have some contractual arrangement. The question is do you pay her only for the time she is working or for the whole four hours You get different answers. If you assume that the resource (in this case, labor) is totally flexible and can go between jobs with little setup, then you can afford to pay a fair amount. If you are only going to pay the time she is actually working, that is not a typical way of arrangement. Pay by the cookie A standard pay. A repair shop charge based on the job not time. They standard labor hours for different jobs. A two hour repair may cost you six hours labor charge. What about another oven Too expensive. Look at demand, which can become a bottleneck, currently the oven is. If they do have another oven and the demand is there, there is another bottleneck waiting there to bite you. Student: We can not make all the decisions just based on the info in the case. Joe: agree. I just want to get you through the process analysis. There are lot of business processes that are not captured by the process chart. We may be able to spit the work better between the two. Student: I can rent my oven. Joe: so there is some flexible resource, but there is transportation cost. MTO is what they promise to their customers. But you don’t have to make the whole thing MTO. Start some processes ahead of time and put them in the refrigerator. Use Joe’s notes!! Slide. Max batch 3d d d d. Resources K K R, Oven Oven R R.")
14
Gantt Chart

16
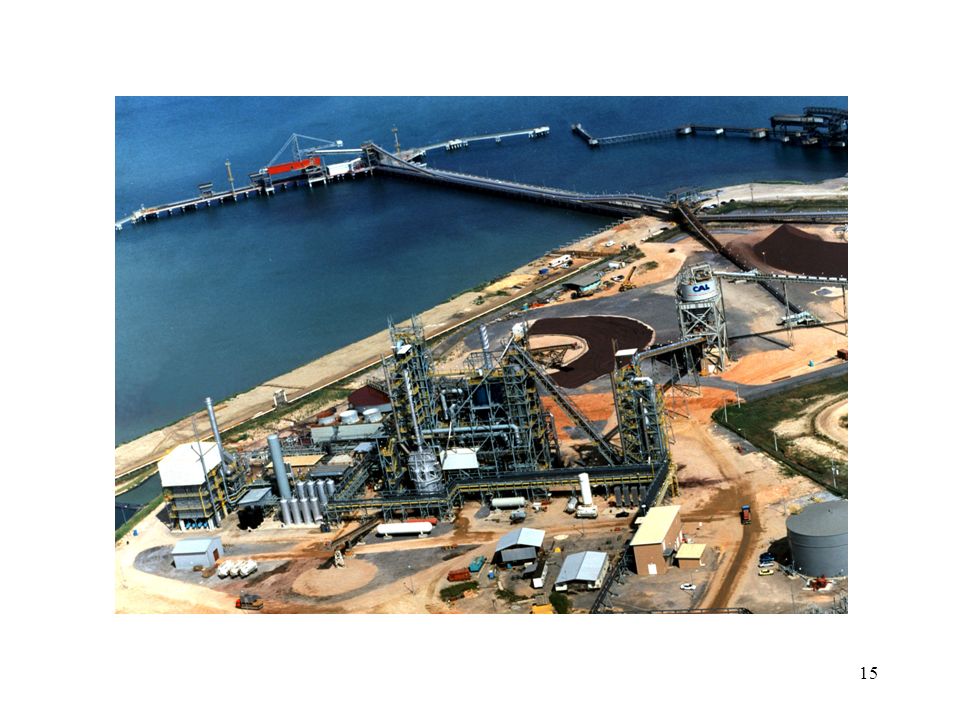
~ 160 m Iron Ore Fines CFB Preheater Inclined Bucket Elevator 1st Stage CFB Reactor 2nd Stage FB Reactor Briquetting Plant HBI Product Process Gas Heat Exchanger Process Gas Compressor Fired Gas Heaters ~ 110 m Electrical Substation& Control Room

17
Pile of Iron ore fines Pre-Heater Briquet- ting Flash heater Dis- charge Finished goods Lock Hoppers 1st Reactor 2nd

18
Process Flow Diagram and Gantt Chart
Process Flow Diagram: Illustrates the flow of product or service from input to final output (stages). Software (Visio et al.) Gantt Chart: Illustrates the interplay between resources at all time Important for scheduling and coordinating production Software (Microsoft Project) How many people have done process analysis? What is the most difficult part? - The detective work to find out what is going on. - Finding out the bottlenecks. - Deciding the level of detail (purchase, manufacture, ship it: not detailed enough. Or turn the handle 1/3 quarter of an inch and turn another handle 2/3 quarter of an inch: too detailed). Appropriate level would allow me to combine, simplify and eliminate steps. Have enough details, but not waste time on unnecessary details. Once we have the process flow, how are we going to go forward (identify room for improvement). Process: network of activities performed by resources Elements of the process activities material and information flows resources and allocation Structured analysis using flow diagrams and internal performance measures Links between operational decisions and performance of the system (in multiple dimensions) Two different charts: Gantt (Henry) chart and process flow chart. Gantt chart allows you to see the interplay between all the resources. Process flow chart doesn’t do that. It only says here are the steps and making improvement. Gantt chart allows us to do capacity analysis. It shows when each of the resources are busy and resource conflicts. One is horizontal (from beginning to end) and the other is vertical indicating what each resource is doing at any time. It also shows time and sequence of activities.
. Software (Visio et al.) Gantt Chart: Illustrates the interplay between resources at all time. Important for scheduling and coordinating production. Software (Microsoft Project) How many people have done process analysis What is the most difficult part - The detective work to find out what is going on. - Finding out the bottlenecks. - Deciding the level of detail (purchase, manufacture, ship it: not detailed enough. Or turn the handle 1/3 quarter of an inch and turn another handle 2/3 quarter of an inch: too detailed). Appropriate level would allow me to combine, simplify and eliminate steps. Have enough details, but not waste time on unnecessary details. Once we have the process flow, how are we going to go forward (identify room for improvement). Process: network of activities performed by resources. Elements of the process. activities. material and information flows. resources and allocation. Structured analysis using flow diagrams and internal performance measures. Links between operational decisions and performance of the system (in multiple dimensions) Two different charts: Gantt (Henry) chart and process flow chart. Gantt chart allows you to see the interplay between all the resources. Process flow chart doesn’t do that. It only says here are the steps and making improvement. Gantt chart allows us to do capacity analysis. It shows when each of the resources are busy and resource conflicts. One is horizontal (from beginning to end) and the other is vertical indicating what each resource is doing at any time. It also shows time and sequence of activities.")
19
Today’s Takeaways Operations management and competitive advantages
Process Types and The Product-Process Matrix Process Types Matching supply with demand: MTO vs. MTS Resource types and layout: job shop, batch, discrete flow, continuous flow The Product-Process Matrix: Diagonal Case discussion: Kristen’s Cookies Process Flow Diagram and Gantt Chart Flow Diagram: stages products flow through Gantt Chart: interplay of resources Operational Measures Articles: Can Marketing and Manufacturing Coexist? – HBR Competing on Capabilities: The New Rules of Corporate Strategy – HBR

Similar presentations


 Service operations vs. goods production Current Challenges in Operations.>")


