Download presentation
Presentation is loading. Please wait.

1
Nuclear Medicine Systems: PET Instrumentation
BMME 560 & BME 590I Medical Imaging: X-ray, CT, and Nuclear Methods Nuclear Medicine Systems: PET Instrumentation Guest Lecturer: Marijana Ivanovic Office: Radiology, 2112 Old Clinic Tel:

2
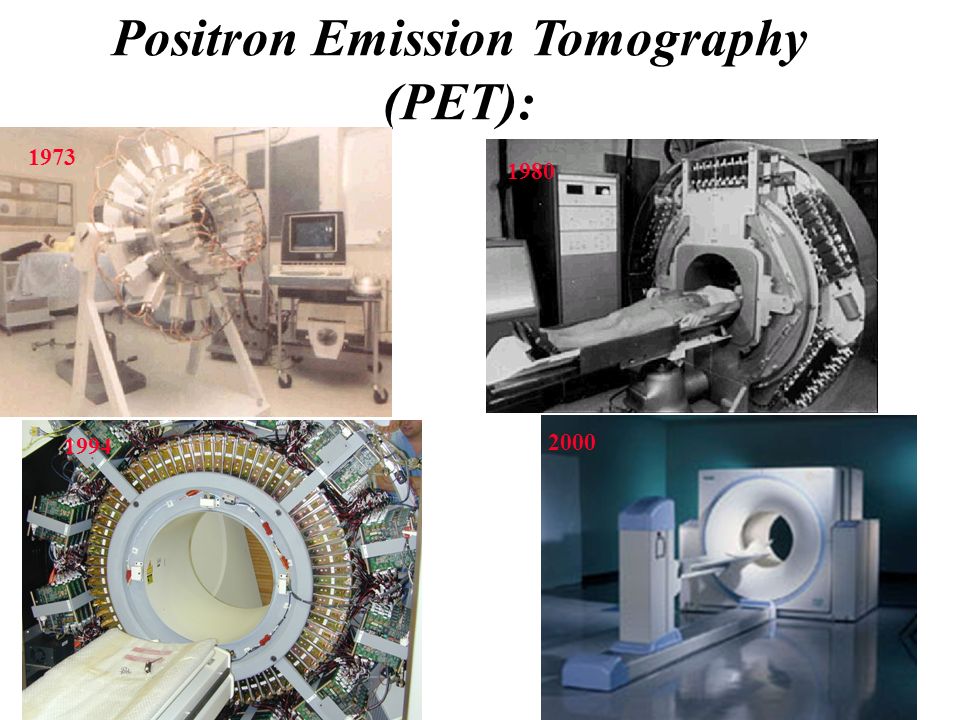
Positron Emission Tomography (PET):
1973 1980 1994 2000
3
Positron combines with Electron and annihilates
Positron ( ß+) emission 511 keV X Z A Y Z-1 A + b+ + n Two anti-parallel 511 keV Photons produced g P N 180 o - e + + + _ _ + + _ _ g e + P N Unstable parent nucleus Positron combines with Electron and annihilates 511 keV Proton decays to Neutron positron and neutrino emitted n
 emission. 511 keV. X. Z. A. Y. Z-1. A. + b+ + n. Two anti-parallel 511 keV. Photons produced. g. P. N o. - e _. _. + + _. _. g. e. + P. N. Unstable parent. nucleus. Positron combines with. Electron and annihilates. 511 keV. Proton decays to. Neutron positron and. neutrino emitted. n.")
4
PET SPECT Electronic collimation (x1,y1) (x2,y2) Collimated detector
Only photons emitted perpendicularly to the detector plane can pass through collimator (x1,y1) (x2,y2) Coordinates of a two simultaneously detected photons determine the line of photon emission (line of response – LOR) Collimator hole determines the line of photon emission Collimated detector Electronic collimation
 (x2,y2) Coordinates of a two simultaneously detected photons determine the line of photon emission (line of response – LOR) Collimator hole determines. the line of photon emission. Collimated detector. Electronic collimation.")
5
Why positron emitters for tracers?
Many of the positron emitters occur naturally in biological molecules (C, N, O, etc.) Many have small molecular weights relative to the biological molecules they may be used to label (e.g., 18F) even if they aren’t found there naturally. Consequently, radioactive isotopes can be attached to biologically interesting molecules with no or minimal impact on the behavior of those molecules in the body.
 Many have small molecular weights relative to the biological molecules they may be used to label (e.g., 18F) even if they aren’t found there naturally. Consequently, radioactive isotopes can be attached to biologically interesting molecules with no or minimal impact on the behavior of those molecules in the body.")
6
Why Use 18F Labeled FDG? Free space Cell Blood
18FDG competes with glucose for transport and phosphorylation 18FDG is not further metabolized but is trapped with high efficiency within cell since dephosphorylation of fluorodeoxyglucose-6-phosphate is slow and only FDG may be transported across membranes Free space Cell Blood Hexokinase Glucogen CO2 + H2O Glucose Glucose Hexokinase FDG-6-PO4 FDG FDG

7
Selected PET tracer compounds
USE 18F-2-deoxyglucose metabolic imaging 13NH3 (ammonia) blood flow 11C-palmitate myocardial metabolism 11C labeled amino acids protein synthesis, pancreatic imaging, tumor metabolism 11C-butanol myocardial flow/perfusion 15O2 , H2 15O blood flow C 15O2 blood volume 82Rb-chloride myocardial perfusion
 blood flow. 11C-palmitate. myocardial metabolism. 11C labeled amino acids. protein synthesis, pancreatic. imaging, tumor metabolism. 11C-butanol. myocardial flow/perfusion. 15O2 , H2 15O. blood flow. C 15O2. blood volume. 82Rb-chloride. myocardial perfusion.")
8
Positron range Positron loses its kinetic energy in collisions with atom of the surrounding matter and comes to the rest within few mm from origin in the body tissue ( in ~ 10-9 sec). g annihilation photon The average distance a positron travels before annihilation is determined by the energy with which it leaves the nucleus. electron/positron annihilation e- e+ b+ energy dependent range annihilation photon g P N F emits positrons which can travel up to 3 mm (1/10 inch) max.
. g. annihilation. photon. The average distance a positron travels before annihilation is determined by the energy with which it leaves the nucleus. electron/positron. annihilation. e- e+ b+ energy dependent. range. annihilation. photon. g. P. N. - 18F emits positrons which can travel up to 3 mm (1/10 inch) max.")
9
Non-colinearity of the annihilation photons
Two photons are not quite 180° apart. Angular deviation is about ± 0.25° due to positron motion If a positron annihilates with an electron before it loses all kinetic energy (not at rest) Positron annihilation + + + + + + + + + + _ - e + e e e + _ _ _ _ _ _ _ _ _ _ b + 180º ± 0.25º
 Positron. annihilation _. - e. + e. e. e. + _. _. _. _. _. _. _. _. _. _. b º ± 0.25º.")
10
Ideal PET Real PET True LOR LOR Detected LOR 180º ± 0.25º 180º
Finite Positron range 180º ± 0.25º Non-collinearity Detected LOR The finite positron range and the non-colinearity of the annihilation photons give rise to an inherent positional inaccuracy not present in SPECT. However, other characteristics of PET more than offset this disadvantage.

11
Three basic types of coincidence imaging systems…
Dual camera Coincidence “Low” cost Dedicated PET “High” end Dedicated PET Lower cost Higher sensitivity and count rate

12
Types of Coincident Events
True Coincidence Scattered Coincidence Random Coincidence

13
True Coincidence Event
Line of response (LOR)
")
14
Scattered Coincidence Event
Scattered events recorded simultaneously True LOR if unscattered Recorded LOR

15
Random Coincidence Event
Unrelated events recorded simultaneously Incorrect LOR The random rate for the a particular LOR, Rij, corresponding to a crystal pair is: Rij = ri x rj x 2t where ri and rj are the event rates of crystal i and crystal j, and t is the coincidence window width. As the activity in the subject increases, the event rate in each detector increases, but the random event rate will increase as the square of the activity.

16
Scatter correction – Model based Attenuation Correction
Uncorrected emission image Transmission image This technique allows scatter correction to be adapted to the morphology and size of each patient Scatter estimation Attenuation Correction Reconstruction - = Uncorrected Scatter Corrected

17
Random Estimation Background subtraction Singles Rate Calculation R = 2 t N1N2 Delayed Window method

18
Noise Equivalent Count or NEC
The scanner sees Prompt coincidences: P=T+S+R But, we want True coincidences: T=P-S-R (adds noise) = T2 T + S + r • f • R Activity Concentration (MBq/mL) 50000 100000 150000 200000 250000 300000 0.005 0.01 0.015 0.02 0.025 0.03 0.035 0.04 TRUES RANDOMS NEC Counts/s SNR2 NEC where T - Trues, S - Scatter, R - Randoms, r - factor to account for the randoms correction method f - is the fraction of randoms in the center 24 cm of the field of view [NEMA] NEC is the number of counts detected as a function of the activity, after correcting for the effects of random and scattered events and taking into account deadtime losses. NEC is determined partly by detector type, detector and scanner geometry, acquisition mode, and front-end electronic. NEC comparison is major arguing point for some vendors.
 = T2. T + S + r. • f • R. Activity Concentration (MBq/mL) TRUES. RANDOMS. NEC. Counts/s. SNR2 NEC. where. T - Trues, S - Scatter, R - Randoms, r - factor to account for the randoms correction method. f - is the fraction of randoms in the center 24 cm of the field of view [NEMA] NEC is the number of counts detected as a function of the activity, after correcting for the effects of random and scattered events and taking into account deadtime losses. NEC is determined partly by detector type, detector and scanner geometry, acquisition mode, and front-end electronic. NEC comparison is major arguing point for some vendors.")
19
Scintillator block cut into crystals Crystal cuts form light guide
Detector design : Block 4 PMTs Scintillator block cut into crystals Crystal cuts form light guide Blocks are stacked to form a ring detector. PET systems have more than one ring.

20
CTI – HR+

21
Event positioning A C B D x = y = PMTs A + B - C - D A + B + C+D
The multiple crystals are formed by making a series of cuts into crystal at varying depths, none of which will extend through the entire crystal. If the event occurs in crystal #1, approximately 100% of the light produced in the crystal will be received by PMT A while approximately 0% is received by PMT B. If the event occurs in crystal #2, PMT A will receive approximately 93% of the light and B, 7% of the light. If the event occurs in crystal #3, PMT A receives approximately 78% of the light and B, 22%. Light produced in crystal #4 results in PMT A receiving approximately 59% and B, 41 %. Etc.. 2 3 1 4 5 PMTs A C Event locations are determined taking by weighting the amplitudes of the signals from the four photomultiplier tubes: A + B - C - D B D x = y A + B + C+D A + C - B - D y = A + B + C + D x

22
Phillips uses an Optically Continuous Lightpipe
39 mm PMT Lightguide 1.9 cm .5 cm 2 cm GSO crystal array Light from one crystal reaches 7 nearest PMTs 4 x 4 x 20mm3 GSO crystals 7 PMT local cluster 39-mm PMTs

23
Timing Coincidence Record event Dt < 10 ns ?
In a PET camera, each detector generates a timed pulse when it registers an incident photon. These pulses are then combined in coincidence circuitry, and if pulses fall within a short time-window, they are deemed to be coincident.

24
Scintillators used in PET scanners
NaI BaF2 BGO LSO GSO Effective atomic no. (Z) 51 54 74 66 59 Lin. atten. coef. (cm-1) 0.34 0.44 0.92 0.87 0.62 Index of refraction 1.85 2.15 1.82 1.85 Light yield [%NaI:Tl] 100 5 15 75 41 Peak Wavelength (nm) 410 220 480 420 430 Decay const. (nS) 230 0.8 300 40 56 Fragile Yes Slight No No No Hygroscopic Yes No No No No
 Lin. atten. coef. (cm-1) Index of refraction Light yield [%NaI:Tl] Peak Wavelength (nm) Decay const. (nS) Fragile. Yes. Slight. No No. No. Hygroscopic. Yes. No. No. No. No.")
25
PET imaging : Projection images are not available during acquisition.
"List mode"Acquisition [S0, f0, E1,E2, recorded for each detected coincidence event (LOR)] Sinograms "Rebbining" Reconstruction
] Sinograms. Rebbining Reconstruction.")
26
Events along a particular row in the sinogram represent those associated with parallel LORs. However, due to the curve nature of the detector ring, LORs become closer together towards the edge of the FOV. 0[deg] 0[det] 144[det] S (xr,f) p(xr,f) 180[deg] To correct for this, the data must be re-sampled (arc corrected) prior to reconstruction. Arc correction is typically applied before reconstruction.
 p(xr,f) 180[deg] To correct for this, the data must be re-sampled (arc corrected) prior to reconstruction. Arc correction is typically applied before reconstruction.")
27
Depth of Interaction: When a photon strikes a crystal, it travels a certain distance before its energy is converted into light. If the photon comes from the center of the field of view (FOV), the line of response (LOR) is likely to be correctly localized in the crystal in which the photon entered. The further away from the center of the FOV, the less likely the LOR will be calculated correctly because the photon will hit the crystal on an angle and continue traveling to another crystal before it lights up. From
, the line of response (LOR) is likely to be correctly localized in the crystal in which the photon entered. The further away from the center of the FOV, the less likely the LOR will be calculated correctly because the photon will hit the crystal on an angle and continue traveling to another crystal before it lights up. From")
30
What is the difference between “2D” and “3D” modes of operation?
Scatter stopped by septa 3D mode Scatter assigned to wrong LOR From "Aspects of Optimisation and Quantification in Three-Dimensional Positron Emission Tomography", by RD Badawi.

31
The number of possible LORs increases when the septa are removed
2D – coincidences between detectors in the same or neighboring rings permitted. 3D – coincidences between any pair of rings permitted. From "Aspects of Optimisation and Quantification in Three-Dimensional Positron Emission Tomography", by RD Badawi.

32
Sensitivity 2D 3D Sensitivity : 0.5 % SF: 12%
From "Aspects of Optimisation and Quantification in Three-Dimensional Positron Emission Tomography", by RD Badawi.

34
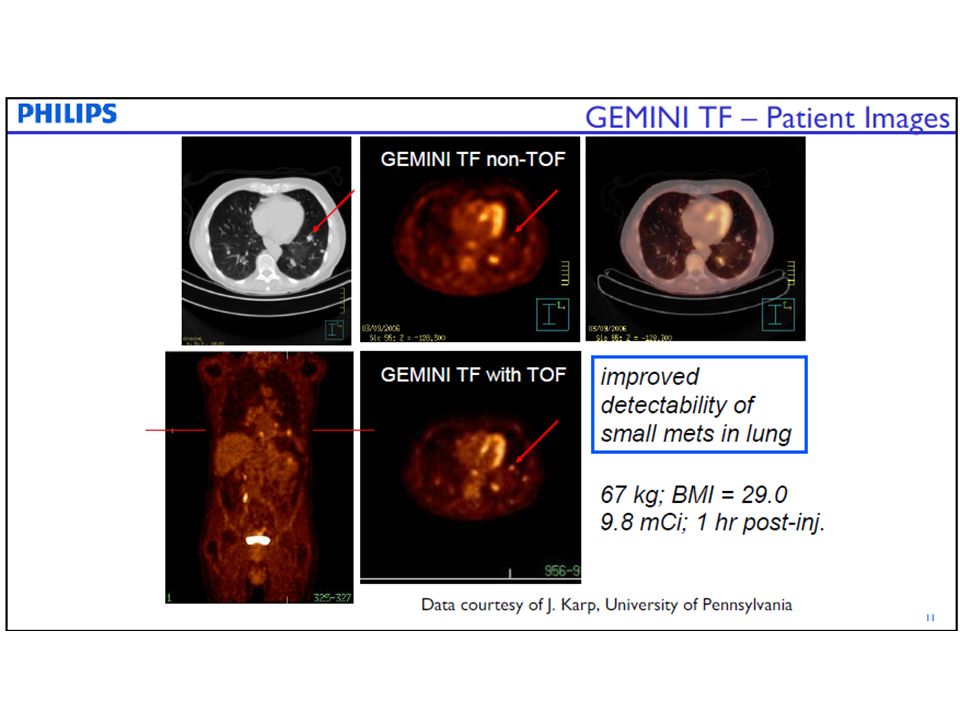
Time of Flight (TOF) PET
 PET")
35
PET -Time of Flight (TOF)
Uses difference in photon detection times to guess at tracer emission point • without timing info, emission point could be anywhere along line • c = 3x1010cm/s, so Dt = 600 ps ~ Dd = 10 cm in resolution t1 t2 Time-of-Flight Reconstruction. With conventional reconstruction (shown on the left), all pixels along the chord are incremented by the same amount. With time-of-flight reconstruction (shown on the right), each pixel on the chord is incremented by the probability (as determined by the time-of-flight measurement) that the source is located at that pixel. amount. From: W. W. Moses, IEE, TNS
, all pixels along the chord are incremented by the same amount. With time-of-flight reconstruction (shown on the right), each pixel on the chord is incremented by the probability (as determined by the time-of-flight measurement) that the source is located at that pixel. amount. From: W. W. Moses, IEE, TNS.")
38
The factors affecting quantitation:
Attenuation Scatter Randoms (PET only) Normalization Dead Time (more in PET than SPECT) Partial volume Noise
 Normalization. Dead Time (more in PET than SPECT) Partial volume. Noise.")
39
Is attenuation effect more pronounced in PET or SPECT ?

40
SPECT PET N = N0 e –m x1 N = N0 e –m x1 e –m x2 N = N0 e –m (x1 + x2)
Attenuation changes depending on emission site. Attenuation of all photons traveling along LOR is the same for position along the LOR.

41
No Attenuation correction Attenuation correction
Example 3 Example 2 No Attenuation correction Attenuation correction

42
Options in collecting and processing transmission scan data
PET Attenuation: Options in collecting and processing transmission scan data Transmission scanning with an external photon source Combined PET/CT scanners

43
Attenuation correction - Transmission scanning with an external source
The fraction absorbed in a transmission scan, along the same line of response (LOR) can be used to correct the emission scan data PET transmission (TX) scans are done at or near 511 keV Transmission scans are noisy and slow (~ 3 min bed addition min for whole body PET scan)
 can be used to correct the emission scan data. PET transmission (TX) scans are done at or near 511 keV. Transmission scans are noisy and slow (~ 3 min bed addition min for whole body PET scan)")
44
CT based attenuation correction

45
CT based attenuation correction – converting CT numbers to attenuation values
Bi-linear scaling methods apply different scale factors for bone and non—bone materials Should be calibrated for every kVp

46
D. Townsend , SNM'04

47
PET/CT scanners PET CT PET CT Siemens “Biograph” Philips “Gemini”

49
Example : Good quality scan
Imaging time 3 min/bed on PET/CT LSO system

50
Extremely Large Patient – poor scan quality
Imaging time was increased to 5min/bed – probably needs min

51
Potential problems for CT-based attenuation correction
Artifacts in the CT image propagate into PET image Difference in CT and PET respiratory patterns can lead to artifacts near the dome of the liver Use of contrast agents or implants can cause incorrect PET values Bias in Ct image due to beam hardening and scatter from the arms in the field of view Truncation of CT image due to keeping arms in down in the field of view to match the PET scan

52
Attenuation Artifacts :
Hip-implant overcorrection: Same artifacts with any metal object (Pacemaker, dental fillings, clips, …) Solution : Look at Non-attenuation corrected PET
 Solution : Look at Non-attenuation corrected PET.")
53
Attenuation Artifact:
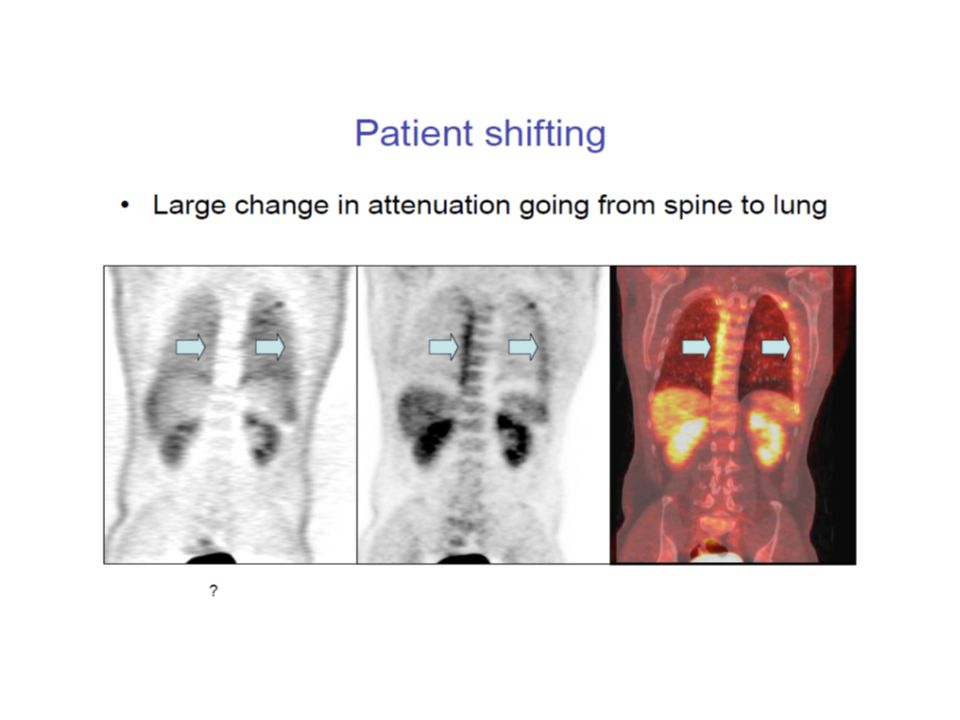
Breathing

54
Attenuation Artifact:
Dental Artifact

57
Requirements for TOF Fast Scintillator (currently LSO)
Fast, Stable PMT Fast, Stable electronics Image reconstruction algorithms for TOF data

58
Brain PET-MRI Comparative brain images with diffusion echoplanar imaging sequence applied during PET acquisition. Images courtesy of Bernd Pichler, Ph.D., and colleagues at the University of Tübingen and David Townsend, Ph.D., and colleagues at the University of Tennessee. The prototype dedicated brain PET scanner uses next-generation avalanche photodiode detector (APD) technology to render the PET scanner impervious to magnetic fields and, in turn, not interfere with the imaging capabilities of MRI. The PET scanner is integrated into a standard Siemens 3-tesla Magnetom Trio MRI unit. The combined system has a spatial resolution of 3 mm, axial field-of-view of 19 cm, and transaxial field-of-view of 30 cm.
 technology to render the PET scanner impervious to magnetic fields and, in turn, not interfere with the imaging capabilities of MRI. The PET scanner is integrated into a standard Siemens 3-tesla Magnetom Trio MRI unit. The combined system has a spatial resolution of 3 mm, axial field-of-view of 19 cm, and transaxial field-of-view of 30 cm. sec=ser&sub=def&pag=dis&ItemID=")
59
Whole-Body PET-MRI MRI PET
The Philips PET-MRI scanner layout, showing the separation of the two scanner types by a revolving bed. This layout prevents interference of the PET imaging by the strong magnetic field of the MRI scanner and the bed enables easy transfer of the patient from one scanner to the other and accurate positioning of the patient in each scanner. MRI PET Some of the first clinical images from Philips' PET/MR system.

60
Standard Uptake Value (SUV):
Counts *Weight SUV = *1000 Dose Where: Counts (Bq/cc) = Pixel value calibrated to Bq/cc and decay corrected to scan start time Weight (kg) = Patient weight in kg Dose (Bq) = Dose in Bq at injection time (This value is decay corrected to scan start time. ) 1000 = Number of cc/kg for water (an approximate conversion of patient weight to distribution volume) Tissue Typical FDG SUV Lung Bone marrow Breast Liver Tumor >3-4
 = Pixel value calibrated to Bq/cc and decay corrected to scan start time. Weight (kg) = Patient weight in kg. Dose (Bq) = Dose in Bq at injection time (This value is decay corrected to scan start time. ) 1000 = Number of cc/kg for water (an approximate conversion of patient weight to distribution volume) Tissue Typical FDG SUV. Lung 0.7. Bone marrow 1.0. Breast 0.5. Liver 2.5. Tumor >3-4.")
61
SUV Variability: Effect of Object Size (Partial Volume Effect)
Problem: Finite Spatial Resolution Blurs Object of Size Close to Spatial Resolution True Max Measured Max Activity Profile Smaller objects (< 2 FWHM) will decrease SUV value due to partial volume effect. This is system dependent and varies with filter and slice thickness. Correction: Using phantom with different sphere sizes to determine partial volume effect (and recovery coefficients) for different sizes on each system.
 will decrease SUV value due to partial volume effect. This is system dependent and varies with filter and slice thickness. Correction: Using phantom with different sphere sizes to determine partial volume effect (and recovery coefficients) for different sizes on each system.")
62
SUV Variability: Effect of Object Size
1 2 3 8 41 51 43 42 52 61 63 62 9 7 16.0 12.0 Sphere # Diameter Sphere/Bkg (mm) Activity 5 14.2 SUV-max 8.0 4.0 1 2 3 41 42 43 51 52 61 62 63 7 Bkg Sphere #
 Activity SUV-max Bkg. Sphere #")
63
Change in SUV due to change in Imaging parameters:
WB protocol Imaging: 7 beds; 3 min bed Reconstruction: OSEM (2i,8s), Zoom 1(5.15mm/pixel), Filter- 5mm Head& neck protocol Imaging: 2 beds; 10 min bed Reconstruction: OSEM (6i,16s), Zoom 1.5(3.43 mm/pixel), Filter- 5mm Head Protocol: Imaging: 1 beds; 10 min bed Reconstruction: OSEM (6i,16s), Zoom 2.5(2.15 mm/pixel), Filter- 2mm
, Zoom 1(5.15mm/pixel), Filter- 5mm. Head& neck protocol. Imaging: 2 beds; 10 min bed. Reconstruction: OSEM (6i,16s), Zoom 1.5(3.43 mm/pixel), Filter- 5mm. Head Protocol: Imaging: 1 beds; 10 min bed. Reconstruction: OSEM (6i,16s), Zoom 2.5(2.15 mm/pixel), Filter- 2mm.")
Similar presentations


 Computer tomography (CT) Proton therapy Electrical impedance.>")


 The characteristic lines are a result of electrons ejecting orbital.>")

