Download presentation
Presentation is loading. Please wait.

1
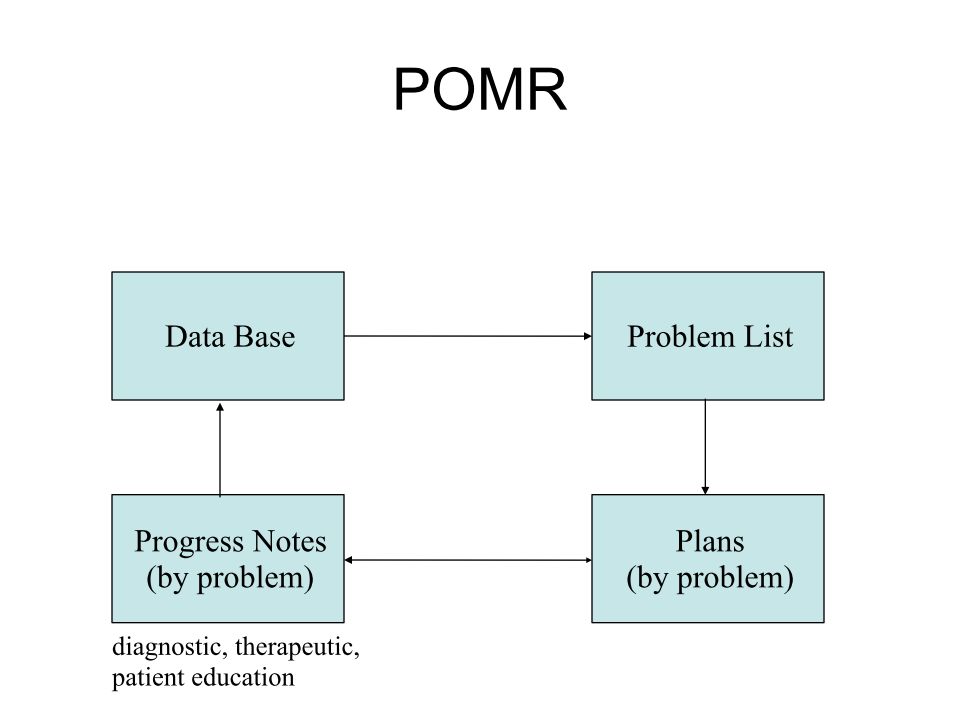
Bio-Medical Informatics
Instructor : Hanif Yaghoobi Website: site webydo.com My personal Mail:

2
About this Course Activities during the semester 5 score: 1)Home Works
2) MATLAB exercises Your Final Projects 3 score Final Exam 12 score
 MATLAB exercises. Your Final Projects 3 score. Final Exam 12 score.")
4
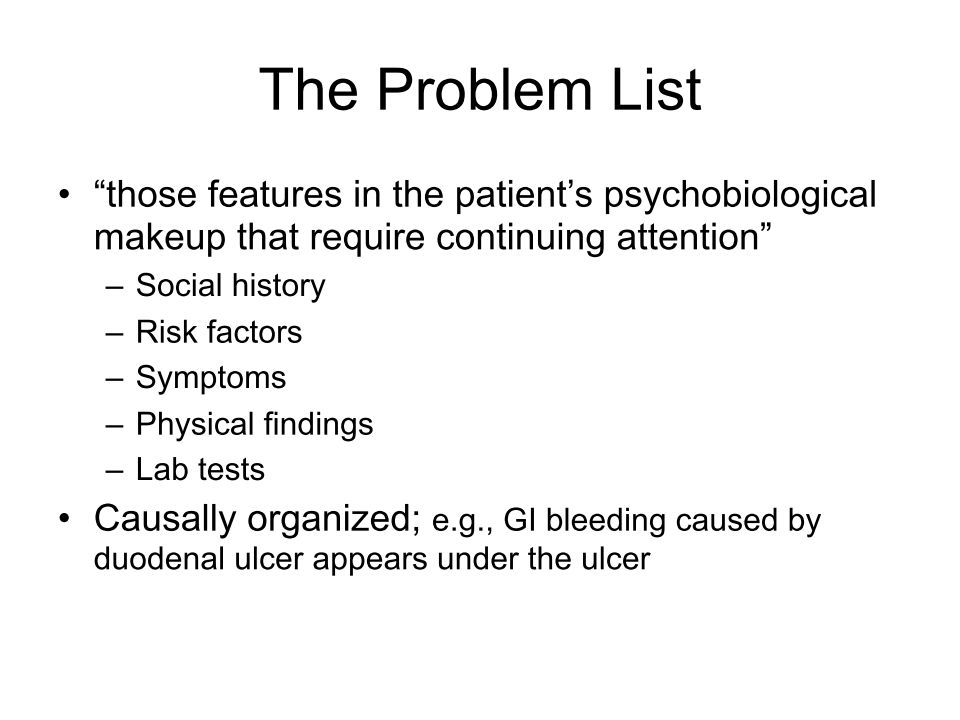
Shortliffe “ Medical informatics is the rapidly developing scientific field that deals with resources, devices and formalized methods for optimizing the storage, retrieval and management of biomedical information for problem solving and decision making” Edward Shortliffe, MD, PhD 1995

15
Organisms Classified into two types:
Eukaryotes: contain a membrane-bound nucleus and organelles (plants, animals, fungi,…) Prokaryotes: lack a true membrane-bound nucleus and organelles (single-celled, includes bacteria) Not all single celled organisms are prokaryotes!
 Prokaryotes: lack a true membrane-bound nucleus and organelles (single-celled, includes bacteria) Not all single celled organisms are prokaryotes!")
16
Cells 60 trillion cells 320 cell types
Complex system enclosed in a membrane Organisms are unicellular (bacteria, baker’s yeast) or multicellular Humans: 60 trillion cells 320 cell types Example Animal Cell biology_intro.htm
 or multicellular. Humans: 60 trillion cells. 320 cell types. Example Animal Cell. biology_intro.htm.")
17
DNA Basics – cont. DNA in Eukaryotes is organized in chromosomes.

18
Chromosomes In eukaryotes, nucleus contains one or several double stranded DNA molecules orgainized as chromosomes Humans: 22 Pairs of autosomes 1 pair sex chromosomes Human Karyotype Session8/Session8.html

20
What is DNA? DNA: Deoxyribonucleic Acid
Single stranded molecule (oligomer, polynucleotide) chain of nucleotides 4 different nucleotides: Adenosine (A) Cytosine (C) Guanine (G) Thymine (T)
 chain of nucleotides. 4 different nucleotides: Adenosine (A) Cytosine (C) Guanine (G) Thymine (T)")
21
Nucleotide Bases Purines (A and G) Pyrimidines (C and T)
Difference is in base structure Image Source: biology_intro.htm

22
DNA

25
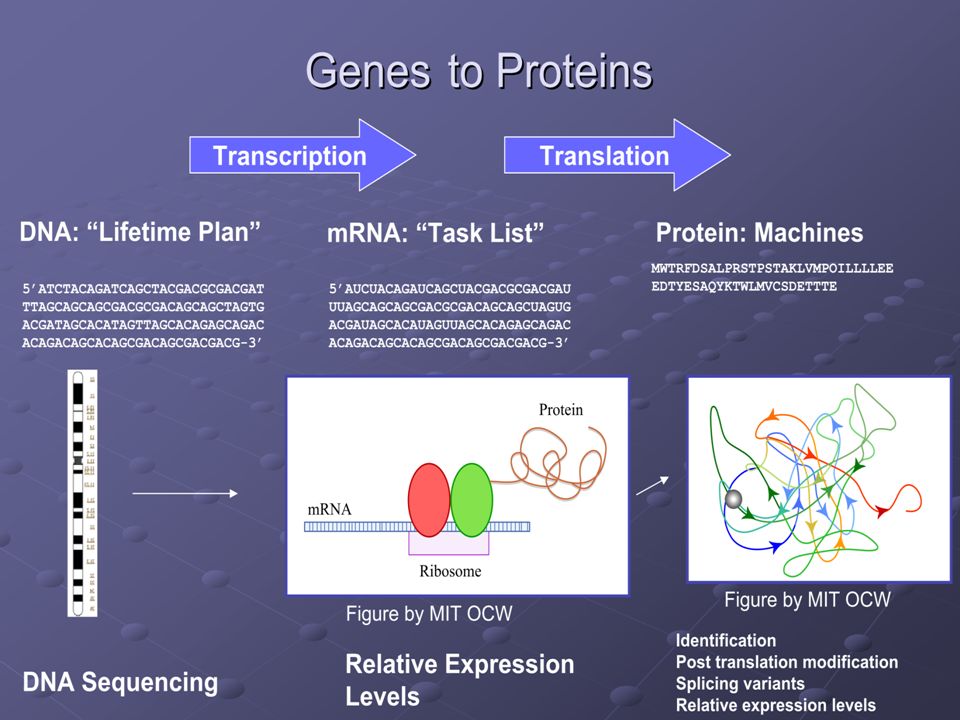
The Central DogmaProtein Synthesis
Transcription Translation Cell Function Genome Transcriptome Proteome Gene Expression Level

28
Genome chromosomal DNA of an organism
number of chromosomes and genome size varies quite significantly from one organism to another Genome size and number of genes does not necessarily determine organism complexity

29
Genome Comparison ORGANISM CHROMOSOMES GENOME SIZE GENES
Homo sapiens (Humans) 23 3,200,000,000 ~ 30,000 Mus musculus (Mouse) 20 , 2600,000,000 ~30,000 Drosophila melanogaster (Fruit Fly) 4 180,000,000 ~18,000 Saccharomyces cerevisiae (Yeast) 16 14,000,000 ~6,000 Zea mays (Corn) 10 2,400,000,000 ???
 23. 3,200,000,000. ~ 30,000. Mus musculus. (Mouse) 20. , 2600,000,000. ~30,000. Drosophila melanogaster (Fruit Fly) ,000,000. ~18,000. Saccharomyces cerevisiae (Yeast) ,000,000. ~6,000. Zea mays (Corn) 10. 2,400,000,000.")
31
DNA Basics – cont. The DNA in each chromosome can be read as a discrete signal to {a,t,c,g}. (For example: atgatcccaaatggaca…)
 .")
32
DNA Basics – cont. In genes (protein-coding region), during the construction of proteins by amino acids, these nucleotides (letters) are read as triplets (codons). Every codon signals one amino acid for the protein synthesis (there are 20 aa).
, during the construction of proteins by amino acids, these nucleotides (letters) are read as triplets (codons). Every codon signals one amino acid for the protein synthesis (there are 20 aa).")
33
DNA Basics – cont. There are 6 ways of translating DNA signal to codons signal, called the reading frames (3 * 2 directions). …CATTGCCAGT…

34
DNA Basics – Cont. …CATTGCCAGT… Start: ATG Stop: TAA, TGA, TAG Exon
gene Exon Intron

35
Understanding Genome Sequences
~3,289,000,000 characters: aattgtgctctgcaaattatgatagtgatctgtatttactacgtgcatat attttgggccagtgaatttttttctaagctaatatagttatttggacttt tgacatgactttgtgtttaattaaaacaaaaaaagaaattgcagaagtgt tgtaagcttgtaaaaaaattcaaacaatgcagacaaatgtgtctcgcagt cttccactcagtatcatttttgtttgtaccttatcagaaatgtttctatg tacaagtctttaaaatcatttcgaacttgctttgtccactgagtatatta tggacatcttttcatggcaggacatatagatgtgttaatggcattaaaaa taaaacaaaaaactgattcggccgggtacggtggctcacgcctgtaatcc cagcactttgggagatcgaggagggaggatcacctgaggtcaggagttac agacatggagaaaccccgtctctactaaaaatacaaaattagcctggcgt ggtggcgcatgcctgtaatcccagctactcgggaggctgaggcaggagaa tcgcttgaacccgggagcggaggttgcggtgagccgagatcgcaccgttg cactccagcctgggcgacagagcgaaactgtctcaaacaaacaaacaaaa aaacctgatacatggtatgggaagtacattgtttaaacaatgcatggaga tttaggttgtttccagtttttactggcacagatacggcaatgaatataat tttatgtatacattcatacaaatatatcggtggaaaattcctagaagtgg aatggctgggtcagtgggcattcatattgagaaattggaaggatgttgtc aaactctgcaaatcagagtattttagtcttaacctctcttcttcacaccc ttttccttggaagaaagctaaatttagacttttaaacacaaaactccatt ttgagacccctgaaaatctgggttcaaagtgtttgaaaattaaagcagag gctttaatttgtacttatttaggtataatttgtactttaaagttgttcca . . . Goal: Identify components encoded in the DNA sequence

36
Open Reading Frame ATGCTCAGCGTGACCTCA CAGCGTTAA M L S V T S Q R STP Protein-encoding DNA sequence consists of a sequence of 3 letter codons Starts with the START codon (ATG) Ends with a STOP codon (TAA, TAG, or TGA)
 Ends with a STOP codon (TAA, TAG, or TGA)")
37
Finding Open Reading Frames
ATGCTCAGCGTGACCTCA CAGCGTTAA M L S V T S Q R STP Try all possible starting points 3 possible offsets 2 possible strands Simple algorithm finds all ORFs in a genome Many of these are spurious (are not real genes) How do we focus on the real ones?
 How do we focus on the real ones")
38
Using Additional Genomes
Basic premise “What is important is conserved” Evolution = Variation + Selection Variation is random Selection reflects function Idea: Instead of studying a single genome, compare related genomes A real open reading frame will be conserved

39
Phylogentic Tree of Yeasts
S. cerevisiae S. paradoxus S. mikatae S. bayanus C. glabrata S. castellii K. lactis A. gossypii K. waltii D. hansenii C. albicans Y. lipolytica N. crassa M. graminearum M. grisea A. nidulans S. pombe ~10M years Kellis et al, Nature 2003

40
Evolution of Open Reading Frame
S. cerevisiae S. paradoxus S. mikatae S. bayanus ATGCTCAGCGTGACCTCA . . . ATGCTCAGCGTGACATCA . . . ATGCTCAGGGTGACA--A . . . ATGCTCAGG---ACA--A . . . Conserved positions Frame shift changes interpretation of downstream seq Variable positions A deletion

41
Examples Spurious ORF Confirmed ORF Frame shift ATG not conserved
Variable Frame shift Spurious ORF ATG not conserved Confirmed ORF Greedy algorithm to find conserved ORFs surprisingly effective (> 99% accuracy) on verified yeast data Sequencing error [Kellis et al, Nature 2003]
 on verified yeast data. Sequencing error. [Kellis et al, Nature 2003]")
42
Defining Conservation
Conserved Variable Naïve approach Consensus between all species Problem: Rough grained Ignores distances between species Ignores the tree topology Goal: More sensitive and robust methods A A C G T A C C A % conserv 100 33 55 55

43
Bioinformatics – an area of emerging knowledge
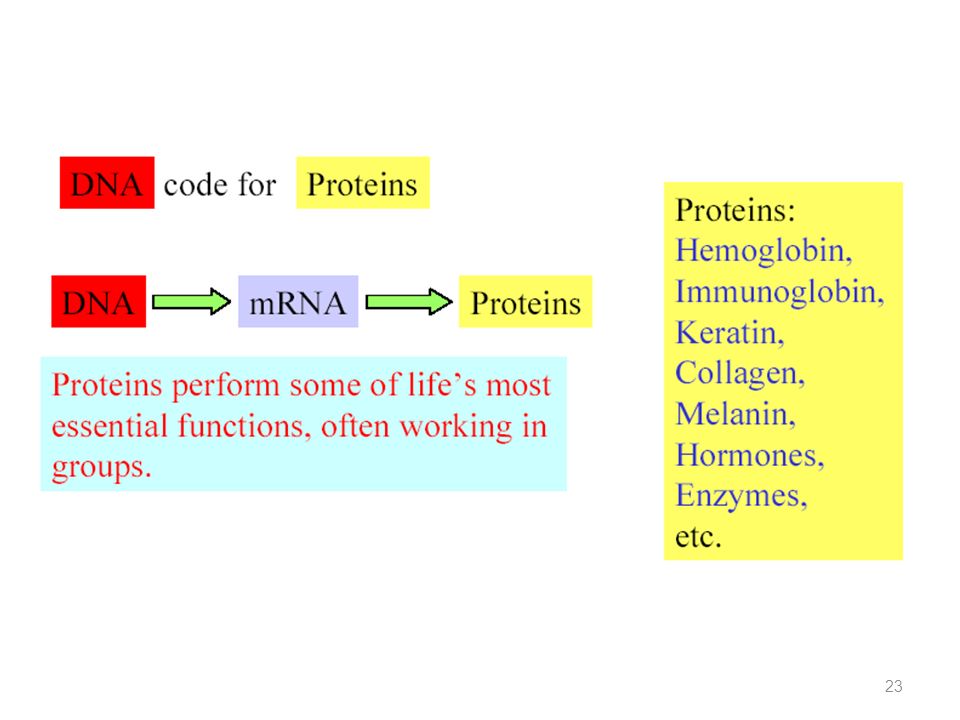
Each cell of the body contains the whole DNA of the individual (about 40,000 genes in the human genome, each of them comprising from 50 to a mln base pairs – A,T,C or G) The Main Dogma in Genetics: DNA->RNA->proteins Transcription: DNA (about 5%) -> mRNA DNA -> pre-RNA -> splicing -> mRNA (only the exons) Translation: mRNA -> proteins Proteins make cells alive and specialised (e.g. blue eyes) Genome -> proteome N.Kasabov, 2003
 The Main Dogma in Genetics: DNA->RNA->proteins. Transcription: DNA (about 5%) -> mRNA. DNA -> pre-RNA -> splicing -> mRNA (only the exons) Translation: mRNA -> proteins. Proteins make cells alive and specialised (e.g. blue eyes) Genome -> proteome. N.Kasabov,")
44
Bioinformatics The area of Science that is concerned with the development and applications of methods, tools and systems for storing and processing of biological information to facilitate knowledge discovery. Interdisciplinary: Information and computer science, Molecular Biology, Biochemistry, Genetics, Physics, Chemistry, Health and Medicine, Mathematics and Statistics, Engineering, Social Sciences. Biology, Medicine -- Information Science --> IT, Clinics, Pharmacy, I____________________I Links to Health informatics, Clinical DSS, Pharmaceutical Industry N.Kasabov, 2003

45
Bioinformatics: challenging problems for computer and information sciences
Discovering patterns (features) from DNA and RNA sequences (e.g. genes, promoters, RBS binding sites, splice junctions) Analysis of gene expression data and predicting protein abundance Discovering of gene networks – genes that are co-regulated over time Protein discovery and protein function analysis Predicting the development of an organism from its DNA code (?) Modeling the full development (metabolic processes) of a cell (?) Implications: health; social,… N.Kasabov, 2003
 from DNA and RNA sequences (e.g. genes, promoters, RBS binding sites, splice junctions) Analysis of gene expression data and predicting protein abundance. Discovering of gene networks – genes that are co-regulated over time. Protein discovery and protein function analysis. Predicting the development of an organism from its DNA code ( ) Modeling the full development (metabolic processes) of a cell ( ) Implications: health; social,… N.Kasabov,")
46
Problems in Computational Modeling for Bioinformatics
Abundance of genome data, RNA data, protein data and metabolic pathway data is now available (see and this is just the beginning of computational modeling in Bioinformatics Complex interactions: between proteins, genes, DNA code, between the genome and the environment much yet to to be discovered Stability and repetitiveness: Genes are relatively stable carriers of information. Many sources of uncertainty: Alternative splicing Mutation in genes caused by: ionising radiation (e.g. X-rays); chemical contamination, replication errors, viruses that insert genes into host cells, aging processes, etc. Mutated genes express differently and cause the production of different proteins It is extremely difficult to model dynamic, evolving processes N.Kasabov, 2003
; chemical contamination, replication errors, viruses that insert genes into host cells, aging processes, etc. Mutated genes express differently and cause the production of different proteins. It is extremely difficult to model dynamic, evolving processes. N.Kasabov,")
47
Bioinformatics Important Challenges
Transcription Translation Protein Function Protein 3D Structure Gene Predication Gene Function

48
Public Data Base Protein sequence KMLSLLMARTYW DNA sequence Microarray
Transcription Translation Protein sequence KMLSLLMARTYW DNA sequence {A,T,C,G} Microarray Gene Expression Level

49
Gene Expression Gene Expression Level: The amount of mRNA copies are in the cell for each Gene. Over expressed Under expressed 49

50
What are the Advantages?
Microarray What can it be used for? How does it work? What are the Advantages? An Example Application Current version I the past Biologist have followed a one gene one experiments philosophy. Today with new technology of microarrays scientist can investigate the expression of several genes at once using this high throughput method. This provides the potential to monitor thousands of genes at the same time. Hybridization is the fundamental concept of how this works. Impacting many fields like genomics, drug discovery, and toxicological research. Currently cost is high. Demand, competition and time will bring down the costs. Most used for RNA expression levels. Get differences between oligonucleotides and cDNA methods. Arrays with 5,000 to 10,000 genes are common. The challenge is in The main use is for comparison of expression analysis. oligonucleotides method; Photolithography is used to construct arrays with high information content onto glass slides. The slides are turned upside down over the hybridization chamber so that fluorescently tagged nucleic acids can hybridized. The laser if focused through the back of the glass to the target solution. The fluorescence emission is collected by a lens and passed through filters to the detector. The array may be moved or the laser or both. Used to understand under what conditions and to what level the gene is expressed. cDNA methods; Gene-specific polynucleotides are arrayed on the matrix. The matrix is probed by fluorescently tagged cDNA made from the expressed RNA. Printing Methods; Robot used to place material on slide. Contact method. Non-contact, capillary tube, ink-jet being tried. The DNA is cross-linked to the matrix by UV light to fix it. Some of the DNA is changed to single-strand by heat or alkali. RNA is used as template to make cDNA by reverse transcription using fluorescence labeled nucleotides.

51
Microarrays can be used for:
Comparison of transcription levels between two cells Examples: Comparison between: Cells from a young mouse vs cell from an old mouse Drug efficacy: Treated cells vs untreated cells

52
Based on hybridization
G A C U G A mRNA How it works: Based on hybridization U G A C A C T G ▀ A = C ≡ T = G ≡ ▀ U G A C A = C ≡ T = A ≡ ▀ U G A A = C ≡ T = A ≡ ▀

53
Probes and the printing process
Head slides (100) Microtiter Plates
 Microtiter. Plates.")
54
Pins Print Head Printing Methods;
Robot used to place material on slide. Contact method. Non-contact, capillary tube, ink-jet being tried. The DNA is cross-linked to the matrix by UV light to fix it. Some of the DNA is changed to single-strand by heat or alkali.

56
The printing tips is like a foutain tip pen
The printing tips is like a foutain tip pen. They are machined in a way that promotes capillary action. Liquid is drawn into the tip by putting it into DNA solution in a 96-well plate. The drops are also formed by capillary action, and the size of the drops are determined partly by the sharpness of the point. Printing is performed by lowered the tip very close the surface of the slide.

58
Print Head with Pins

60
Microarray Technology
23/2/2008

61
pseudo-colour image sample (labelled) probe (on chip)
[image from Jeremy Buhler]

62
Experimental design Track what’s on the chip
which spot corresponds to which gene Duplicate experimental spots reproducibility Controls DNAs spotted on glass positive probe (induced or repressed) negative probe (bacterial genes on human chip) oligos on glass or synthesised on chip (Affymetrix) point mutants (hybridisation plus/minus)
 negative probe (bacterial genes on human chip) oligos on glass or synthesised on chip (Affymetrix) point mutants (hybridisation plus/minus)")
63
Images from scanner Resolution
standard 10m [currently, max 5m] 100m spot on chip = 10 pixels in diameter Image format TIFF (tagged image file format) 16 bit (65’536 levels of grey) 1cm x 1cm image at 16 bit = 2Mb (uncompressed) other formats exist e.g.. SCN (used at Stanford University) Separate image for each fluorescent sample channel 1, channel 2, etc.
 16 bit (65’536 levels of grey) 1cm x 1cm image at 16 bit = 2Mb (uncompressed) other formats exist e.g.. SCN (used at Stanford University) Separate image for each fluorescent sample. channel 1, channel 2, etc.")
64
Images in analysis software
The two 16-bit images (cy3, cy5) are compressed into 8-bit images Goal : display fluorescence intensities for both wavelengths using a 24-bit RGB overlay image RGB image : Blue values (B) are set to 0 Red values (R) are used for cy5 intensities Green values (G) are used for cy3 intensities Qualitative representation of results
 are compressed into 8-bit images. Goal : display fluorescence intensities for both wavelengths using a 24-bit RGB overlay image. RGB image : Blue values (B) are set to 0. Red values (R) are used for cy5 intensities. Green values (G) are used for cy3 intensities. Qualitative representation of results.")
65
Images : examples Pseudo-color overlay cy3 cy5 Spot color
Signal strength Gene expression yellow Control = perturbed unchanged red Control < perturbed induced green Control > perturbed repressed

66
Data : DNA Microarray assay gene 1 gene 2 gene 3
It is far from trivial to predict gene expression from the sequence code alone. The current availability of microarray measurements of thousands of gene expression levels during the course of an experiment or after the knockout of a gene provides a wealth of complementary information that may be exploited to unravel the complex interplay between genes. 23/2/2008

67
Data Required: Gene Expression Matrix
1 2 g2 g3 1. g4 23/2/2008

68
Data Required: Gene Expression Matrix
1 2 g2 g3 1. g4 a1 a2 a3 a4 g1 3 1 g2 2 g3 1. g4 Time serious Snap Shot 23/2/2008

78
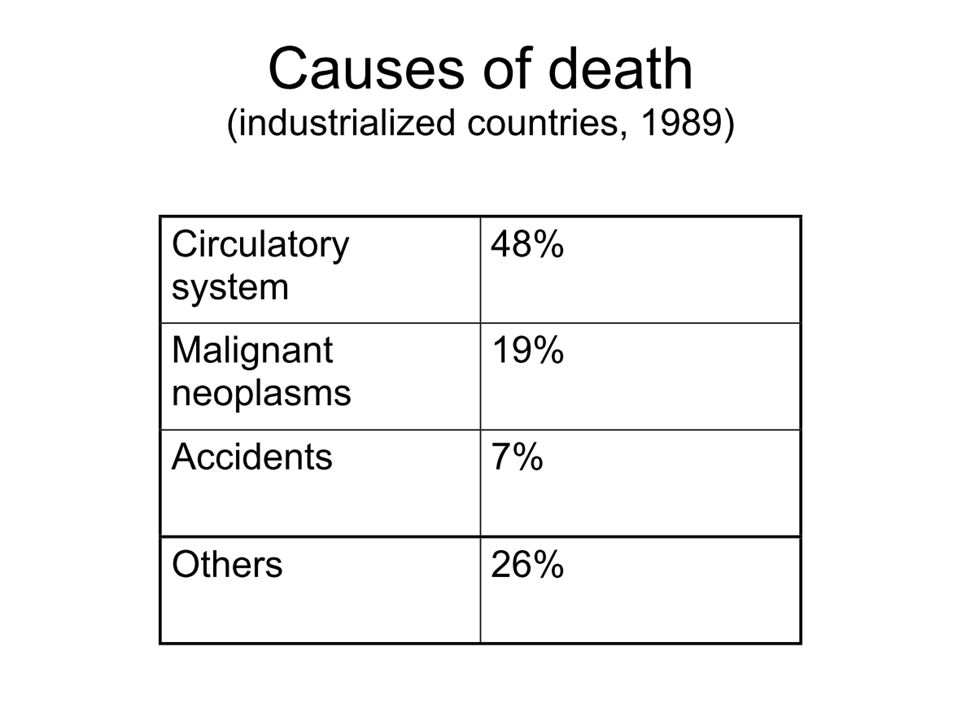
World Health Organization

Similar presentations


>")


 Lenwood S. Heath (CS) Ruth Grene (PPWS) Layne Watson (CS) Chris North (CS) Naren.>")


