Download presentation
Presentation is loading. Please wait.

1
U SING G EOGRAPHY TO S TRENGTHEN THE D ECISION -M AKING P ROCESS

2
Overview Value of geographic perspective is a valuable tool for M&E. Role of geographic data & tools in evidence-based decision making for M&E. Geographic identifiers can be used to link data sets and Reduce “stovepiping “of data Improve recognition of spatial patterns Deepen the understanding of M&E program data Using geography to link datasets can Increase collaboration with other organizations Expand the inventory of available data Lower costs. Leveraging geography enhances evidence-based decision making & strengthens overall data infrastructure.

9
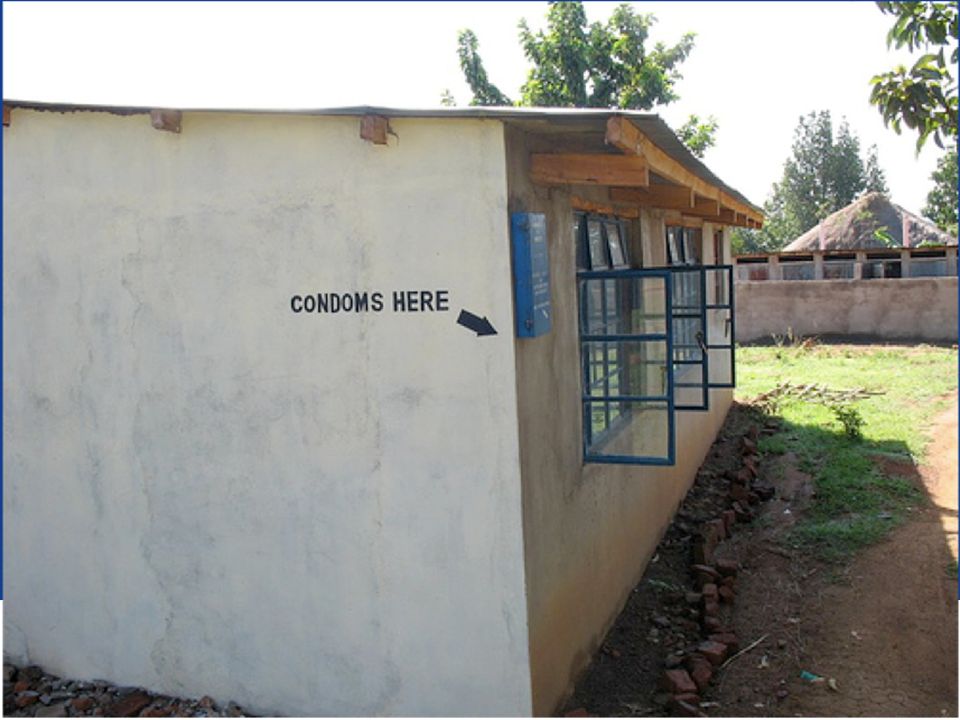
Photo by Eileen Maher

10
Where

11
Why

13
Value of Mapping Facilitates recognition of spatial patterns Provides insight into data Highlights data quality issues Provides a powerful tool for Decision support Analysis Data display Picture worth 1,000 words

14
Value of Geography More than just mapping Strengthens data infrastructure by Providing a way to link different data sets Increases collaboration Expands inventory of available data Can lowers costs of data creation and maintenance Enforcing data schema standards

15
GEOGRAPHY CAN STRENGTHEN THE DATA INFRASTRUCTURE

16
A STRONG DATA INFRASTRUCTURE MAKES BETTER DECISIONS AND BETTER OUTCOMES MORE LIKELY

17
Data Infrastructure Available data Systems to support, update, and disseminate data

18
Data Streams

19
The world is complex; take advantage of as much data as possible

22
Geography is key link Population DistrictPopulation North3253 South5621 East8732 West7715 OVC DistrictOVC North812 South1011 East2709 West1411

23
Geography is key link Population and OVC DistrictPopulationOVCPercent OVC North325381224.96 South5621101117.99 East8732270931.02 West7715141118.29

24
Geography is key link Seems obvious Data need to have a geographic identifier Data must have complementary structure One record per observation Consistent geographic identifiers Compatible level of geographic representation Don’t necessarily need a GIS—data can be linked and shared in Excel or Access

25
Geographic Identifiers -0.125140 S 34.754213 E -0.125312 S 34.754180 E

26
Geographic Identifiers Administrative units Provinces Districts Communes Etc. Village or community name

27
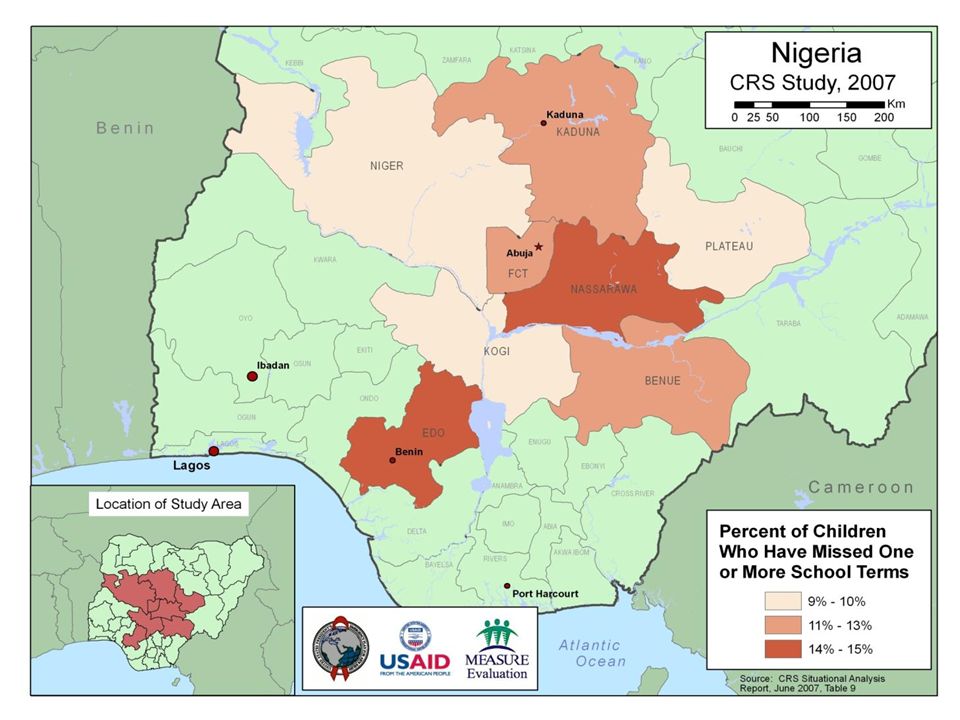
OVC CASE STUDY Nigeria

33
The world is complex; take advantage of as much data as possible

34
Mapping: One Tool in the Toolbox

35
Key Steps to Mapping Include Geographic Identifier in Data Where are things? Select Software ArcGIS DevInfo Diva-GIS Excel to Google Earth Google Earth

36
Power of Geography and Mapping Data quality Target efforts for improving data quality Strengthen data quality by enforcing data schema standards Demonstrate value of high quality data Decision making Facilitate Data Visualization Demonstrate impact of programs Integrate various data sources

37
Power of Geography and Mapping Adding the “where” can help understand the “why” Geography can act as a “Rosetta Stone” to link different elements of the data infrastructure

39
Discussion Questions Can anyone provide an example of how the use of geography and mapping has helped improve the decision making process within his or her country or organization? Can anyone provide an example of stovepiping of data? And do you see this as a problem for your country or organization?

40
Discussion Questions (cont’d) If you’re affected by stovepiping of data, how do you think you could overcome it? Or if you’ve had to overcome stovepiping in the past, how did you accomplish it? Has anyone had a positive experience with linking to external data sets? Such as linking to data from the national mapping agency (NMA), other ministries, universities?
, other ministries, universities .")
41
Discussion Questions (cont’d) Has anyone here collaborated with the NMA to obtain data? Can you share any lessons learned?

42
General Objective The general objective of the module « Fundamentals of Geographic Data » is to present the fundamentals of geographic data, including the relationship between geographic and attribute data, and to help participants understand some important data quality considerations.

43
Session Plan Geographic data Geographic identifiers Data schema best practices

45
Geographic Identifiers

46
Geographic Identifiers GPS coordinate Administrative name In reference to other features

47
Geography basics

48
Latitude/Longitude

49
Taj Mahal: 27.17 Latitude 78.04 Longitude

50
GPS Coordinate Global Positioning System

51
GPS Coordinates Advantages Very accurate: 10 meters or less Easy to get a quick location of a few objects Receivers and devices becoming more affordable Disadvantages If many objects need to be located, there needs to be a well designed data collection protocol Capturing something other than a point can add time and cost

52
GPS Coordinate Best practice: Display as latitude/longitude coordinate Example: 36.05576 078.91376

53
Geographic Identifiers Administrative division names or codes Regions, provinces, districts, communes Human settlement names or codes Cities, villages, neighborhoods, informal settlements Exact locations Street addresses, GPS coordinates

54
Geographic Identifiers: Administrative Divisions Source: Odhiambo, Emma. “Census Cartography: The Kenyan Experience,” presented at the United Nations Expert Group Meeting on Contemporary Practices in Census Mapping and Use of Geographical Information Systems, 29th May – 1st June 2007, New York. Kenyan Geographic Hierarchy for 1999 Census

55
Acknowledgments: USAID, FEWS, EDC- International Program, and the U.S. Geological Survey.

56
Source: Administrative boundaries downloaded October 2008 from http://gisweb.ciat.cgiar.org/povertymapping/.

57
Geographic Identifiers: Human Settlements Cities Towns Villages Neighborhoods Communities Informal settlements

58
Geographic Identifiers Anything that helps uniquely identify where something is

60
MEASURE Evaluation is a MEASURE project funded by the U.S. Agency for International Development and implemented by the Carolina Population Center at the University of North Carolina at Chapel Hill in partnership with Futures Group International, ICF Macro, John Snow, Inc., Management Sciences for Health, and Tulane University. Views expressed in this presentation do not necessarily reflect the views of USAID or the U.S. Government. MEASURE Evaluation is the USAID Global Health Bureau's primary vehicle for supporting improvements in monitoring and evaluation in population, health and nutrition worldwide.

Similar presentations


>")
