Download presentation
Presentation is loading. Please wait.

1
Introduction to Climate: Overview

2
Radiation Pathways and ‘Budget’ (342 W/m 2 is the total Solar 1,370 W/m 2 averaged over the Earths’ Surface)
")
3
Seasonal Radiation

4
Solar Radiation Drives the Large Scale Flow

5
Unequal Distribution of Solar Radiation, compounded by reflection WATER

6
Atmospheric Temperature Profile: US “Standard” Atmosphere. From Liou Cirrus cloud level. High cold clouds, visible optical depth range 0.001 to 10, emits IR to surface in the IR window.

7
SOLAR ALBEDO OF VARIOUS SURFACES

8
Distribution of Radiation

9
Global Climate Models: The Job

10
Global Climate Models: The DOE ARM PROGRAM Mission Statement The U.S. Department of Energy's (DOE's) ARM Climate Research Facility (ACRF) has been designated a national user facility for the purpose of providing this unique asset for the study of global change to the broader national and international research community. Research at this facility will include the study of alterations in climate, land productivity, oceans or other water resources, atmospheric chemistry, and ecological systems that may alter the capacity of the Earth to sustain life. Global change research also includes the study, monitoring, assessment, prediction, and information management activities to describe and understand: The interactive physical, chemical, and biological processes that regulate the total Earth system The unique environment that the Earth provides for life The changes that are occurring in the Earth system and the environment and how these changes are influenced by human actions.
 ARM Climate Research Facility (ACRF) has been designated a national user facility for the purpose of providing this unique asset for the study of global change to the broader national and international research community. Research at this facility will include the study of alterations in climate, land productivity, oceans or other water resources, atmospheric chemistry, and ecological systems that may alter the capacity of the Earth to sustain life. Global change research also includes the study, monitoring, assessment, prediction, and information management activities to describe and understand: The interactive physical, chemical, and biological processes that regulate the total Earth system The unique environment that the Earth provides for life The changes that are occurring in the Earth system and the environment and how these changes are influenced by human actions..")
11
Simple Model for Earth’s Atmosphere

12
Simple Surface Temperature Calculation Assuming Solar Absorption only at the surface, IR emission by the atmosphere and Earth’s surface, and IR absorption by the Atmosphere. S 0 = 1376 W/m 2 =Solar Irradiance at the TOA and =Stefan-Boltzmann constant

13
Solar Radiation Components: Direct beam, total, and diffuse irradiance. Direct Beam Irradiance (detector normal to sun rays) like measuring laser irradiance. Total Irradiance, also called Global Irradiance, direct + diffuse (detector horizontal) Diffuse Irradiance (detector horizontal) http://solardat.uoregon.edu/SolarRadiationBasics.html Sun image (NRL) from SKYLAB, 1973, 304 nm.
 like measuring laser irradiance. Total Irradiance, also called Global Irradiance, direct + diffuse (detector horizontal) Diffuse Irradiance (detector horizontal) Sun image (NRL) from SKYLAB, 1973, 304 nm..")
14
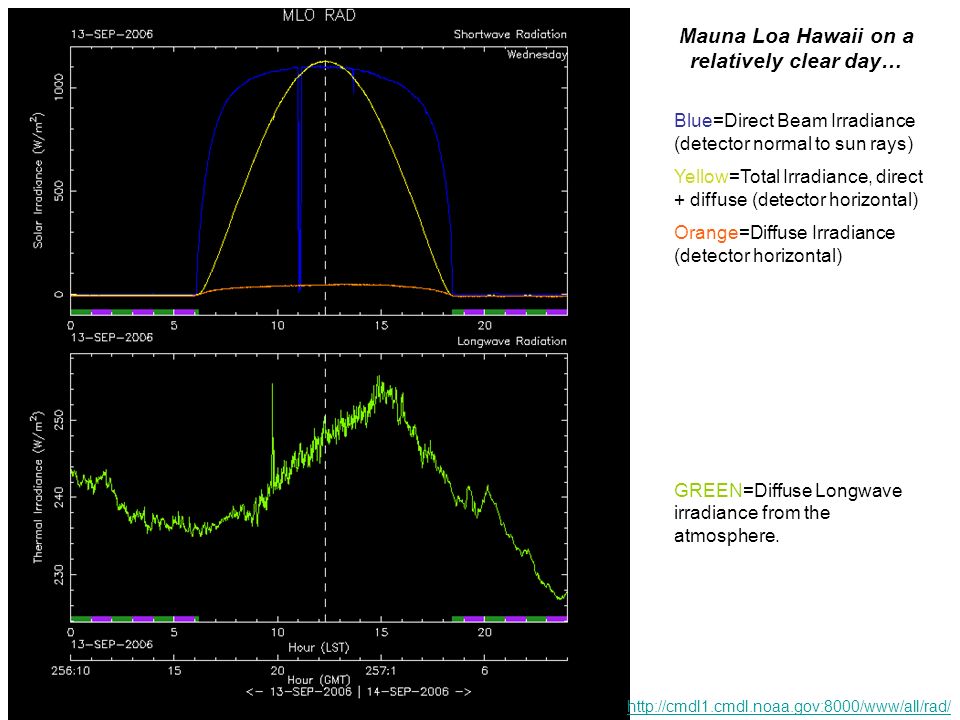
Mauna Loa Hawaii on a relatively clear day… Blue=Direct Beam Irradiance (detector normal to sun rays) Yellow=Total Irradiance, direct + diffuse (detector horizontal) Orange=Diffuse Irradiance (detector horizontal) GREEN=Diffuse Longwave irradiance from the atmosphere. http://cmdl1.cmdl.noaa.gov:8000/www/all/rad/
15
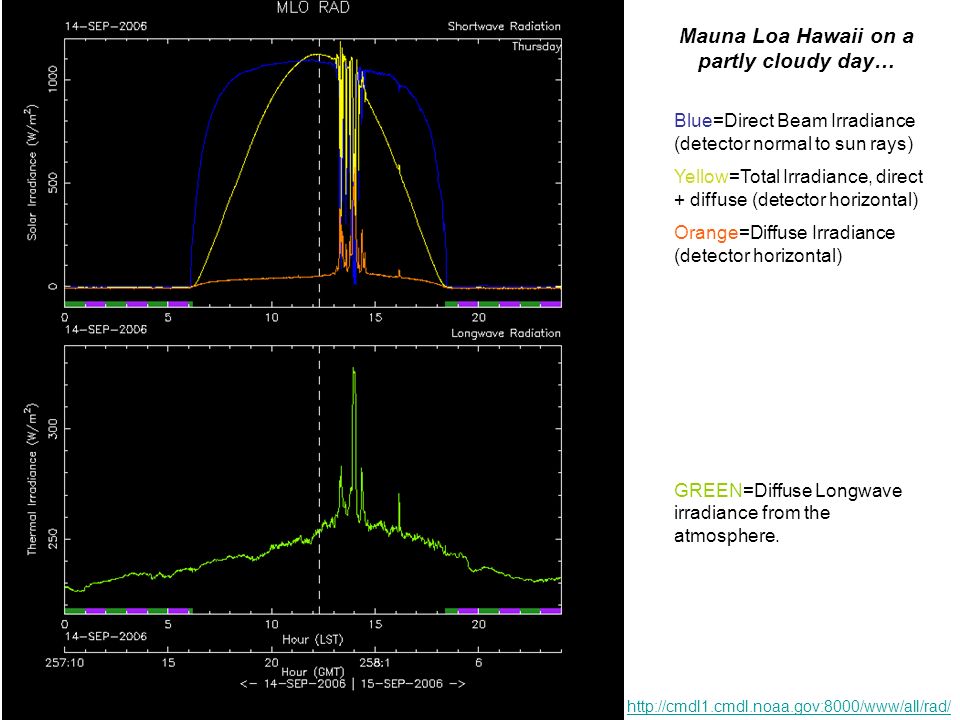
Mauna Loa Hawaii on a partly cloudy day… Blue=Direct Beam Irradiance (detector normal to sun rays) Yellow=Total Irradiance, direct + diffuse (detector horizontal) Orange=Diffuse Irradiance (detector horizontal) GREEN=Diffuse Longwave irradiance from the atmosphere. http://cmdl1.cmdl.noaa.gov:8000/www/all/rad/
16
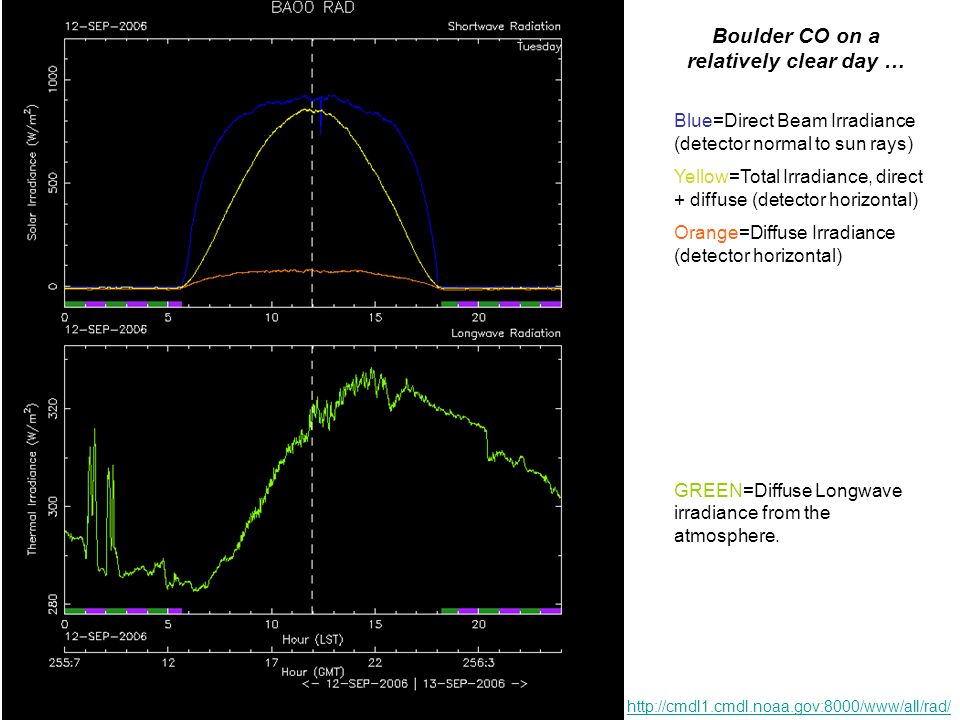
Boulder CO on a relatively clear day … Blue=Direct Beam Irradiance (detector normal to sun rays) Yellow=Total Irradiance, direct + diffuse (detector horizontal) Orange=Diffuse Irradiance (detector horizontal) GREEN=Diffuse Longwave irradiance from the atmosphere. http://cmdl1.cmdl.noaa.gov:8000/www/all/rad/
17
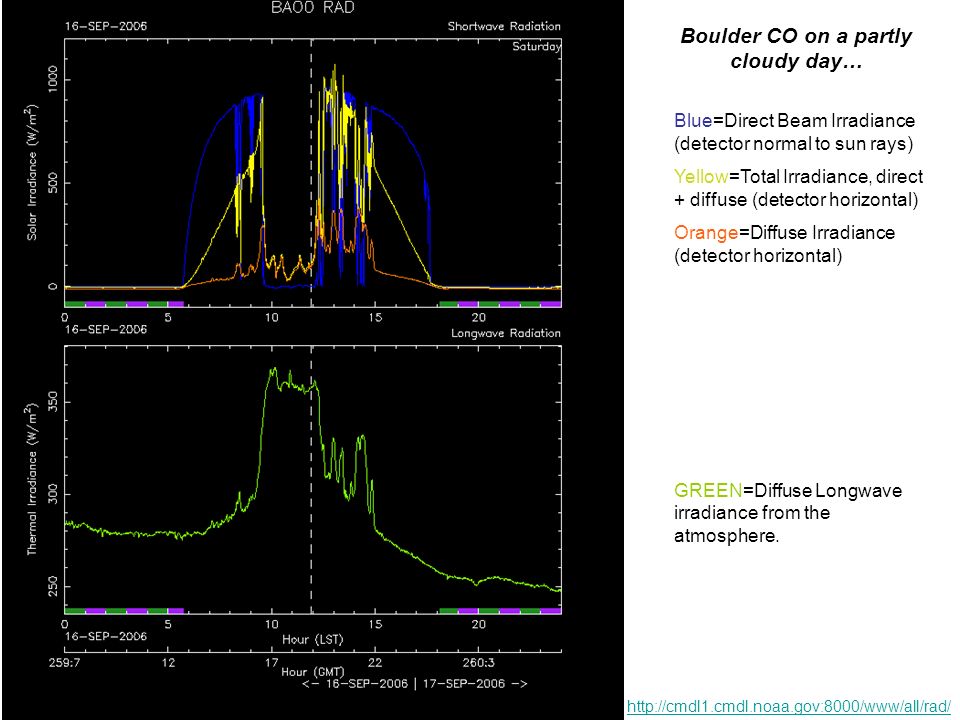
Boulder CO on a partly cloudy day… Blue=Direct Beam Irradiance (detector normal to sun rays) Yellow=Total Irradiance, direct + diffuse (detector horizontal) Orange=Diffuse Irradiance (detector horizontal) GREEN=Diffuse Longwave irradiance from the atmosphere. http://cmdl1.cmdl.noaa.gov:8000/www/all/rad/
18
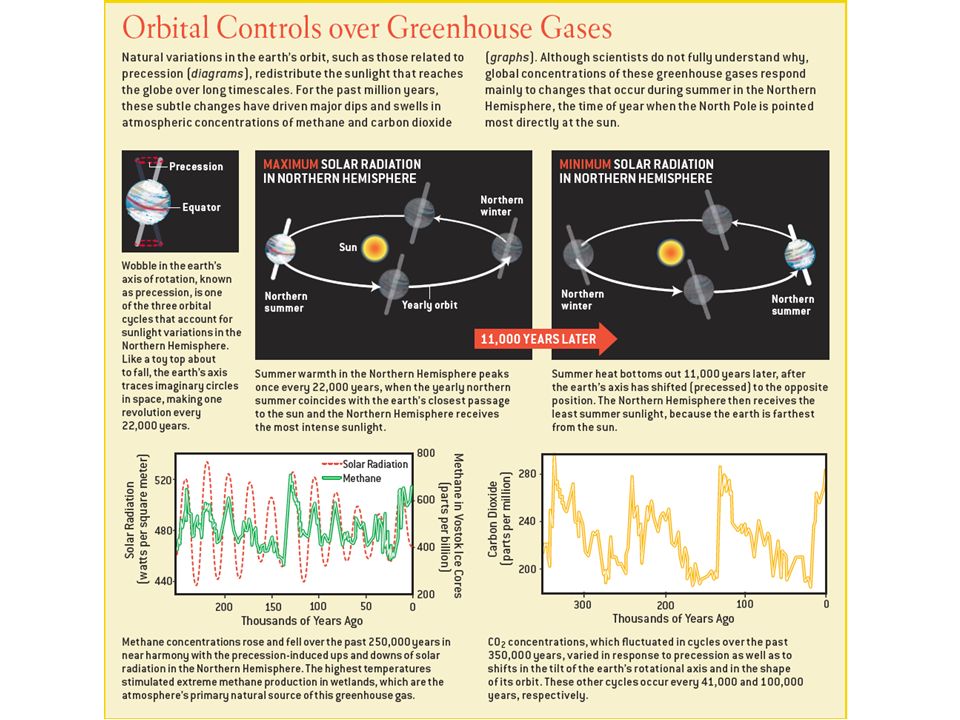
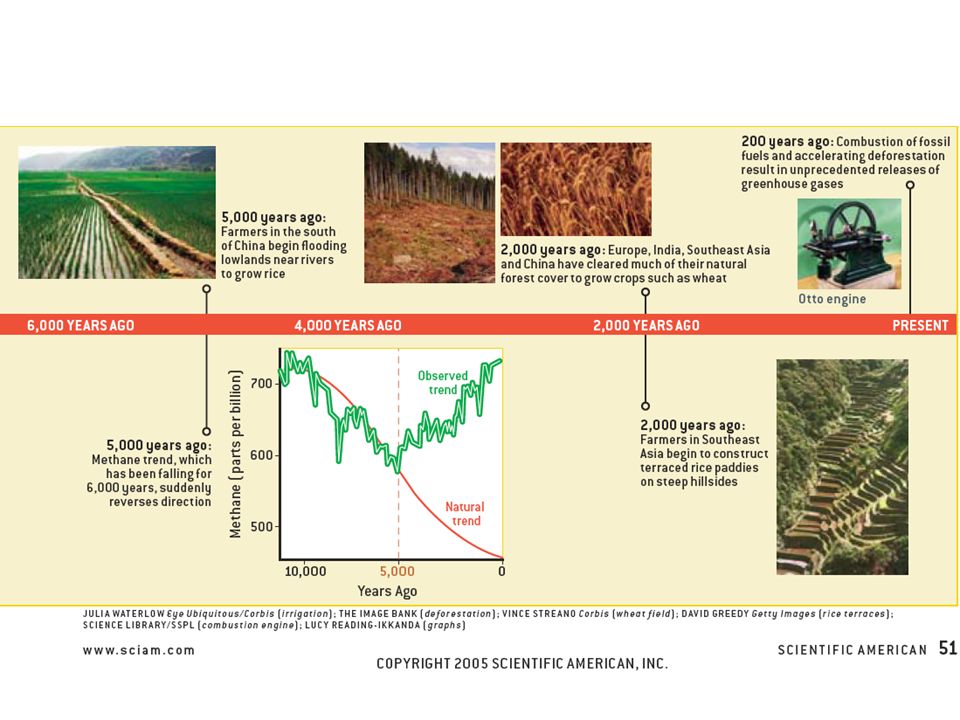
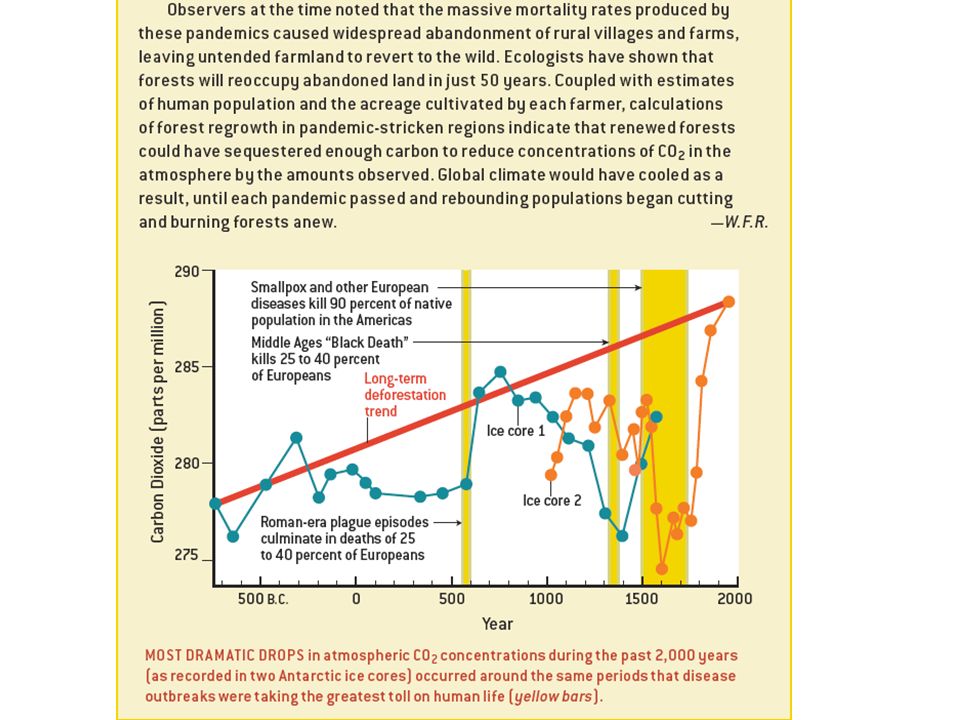
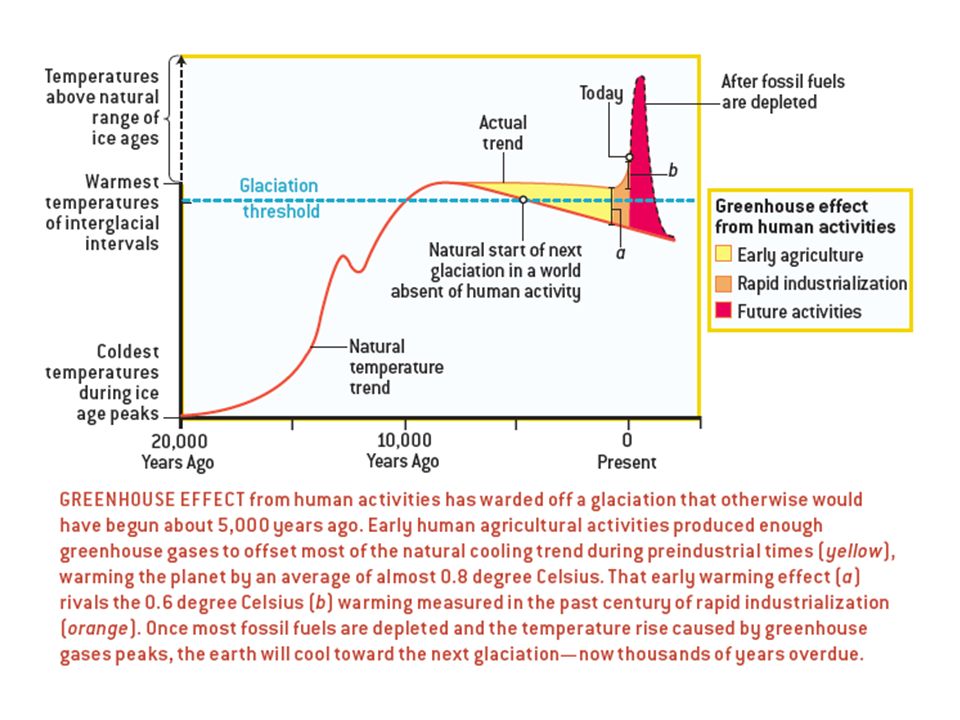
William Ruddiman, The Ruddiman Hypothesis. William Ruddiman is a marine geologist. He received his PhD from Columbia University, and is currently Professor Emeritus of Environmental Sciences at the University of Virginia. He was the Chair of this department from 1993 -1996. Prior to this, he was a senior research scientist at the Lamont-Doherty Observatory in New York, a program associate with the National Science Foundation, and a Senior Scientist/Oceanographer with the U.S. Naval Oceanographic Office in Maryland The Anthropogenic Greenhouse Emissions Era Began 8 Thousands of Years Ago for CO 2 and 3 Thousand years ago for CH 4. These emissions have prevented North America and Europe from experiencing 3 to 4 C cooling and an ice in North East Canada. Agriculture would be difficult without these emissions. CO 2 comes from burning, and CH 4 (swamp gas) comes from the decomposition of vegetation in standing water (rice fields, wetlands, soon the tundra). Much CH 4 is stored as methane-ice in the ocean. Belching animals also make CH 4. It is a “good thing” that we saved ourselves from the ice age. Too much of a “good thing” could cook us. Should we slow our pace of fossil fuel use to better spread our effects over time?
 comes from the decomposition of vegetation in standing water (rice fields, wetlands, soon the tundra). Much CH 4 is stored as methane-ice in the ocean. Belching animals also make CH 4. It is a good thing that we saved ourselves from the ice age. Too much of a good thing could cook us. Should we slow our pace of fossil fuel use to better spread our effects over time .")
20
From Scientific American, March 2005, Ruddiman’s article.

24
THE CARBON CYCLE: WHERE DOES CO 2 GO??? CARBON RESERVOIRS (GIGATONS) C Exchange Rate
 C Exchange Rate")
25
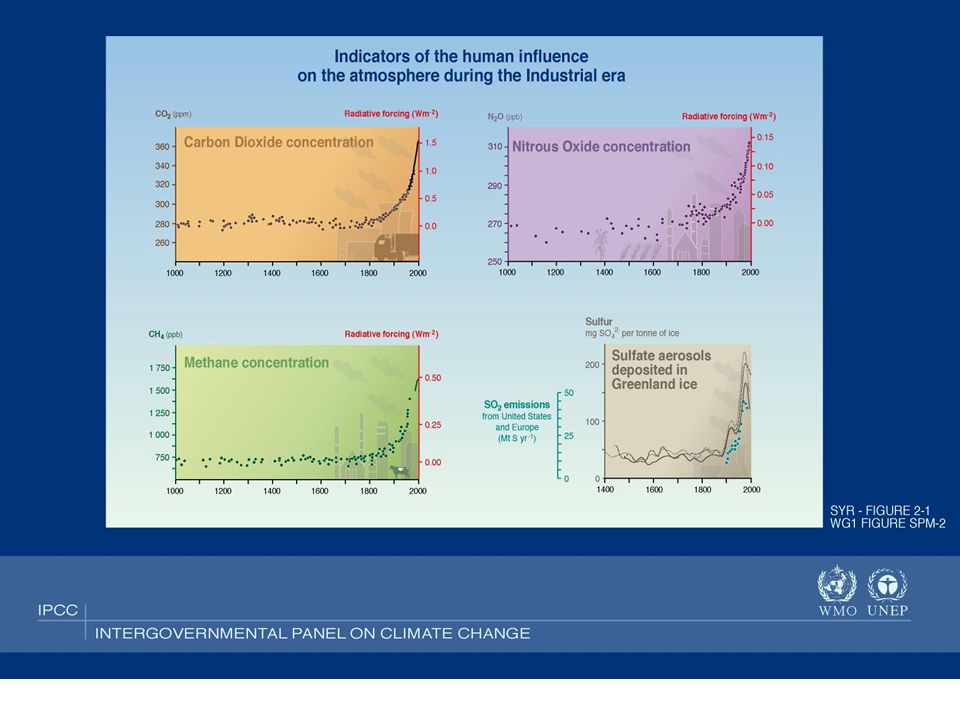
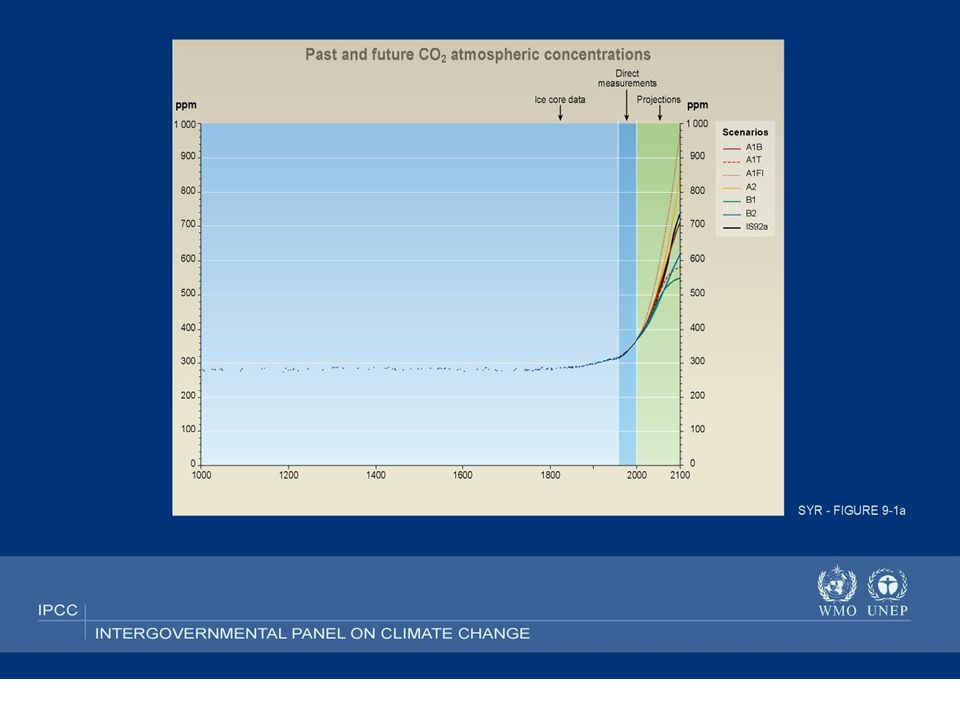
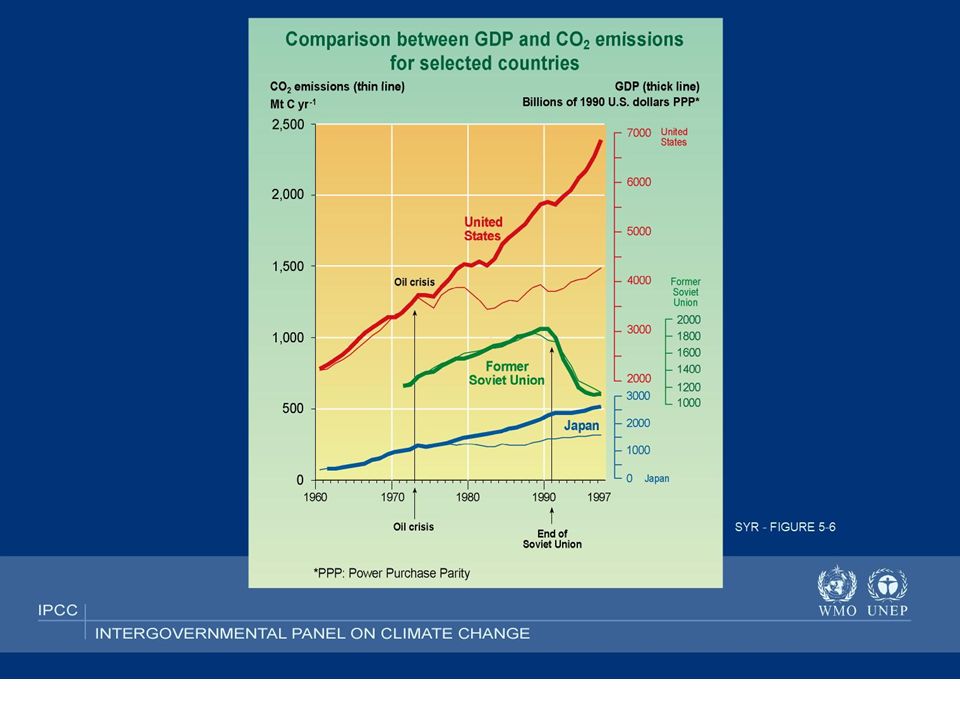
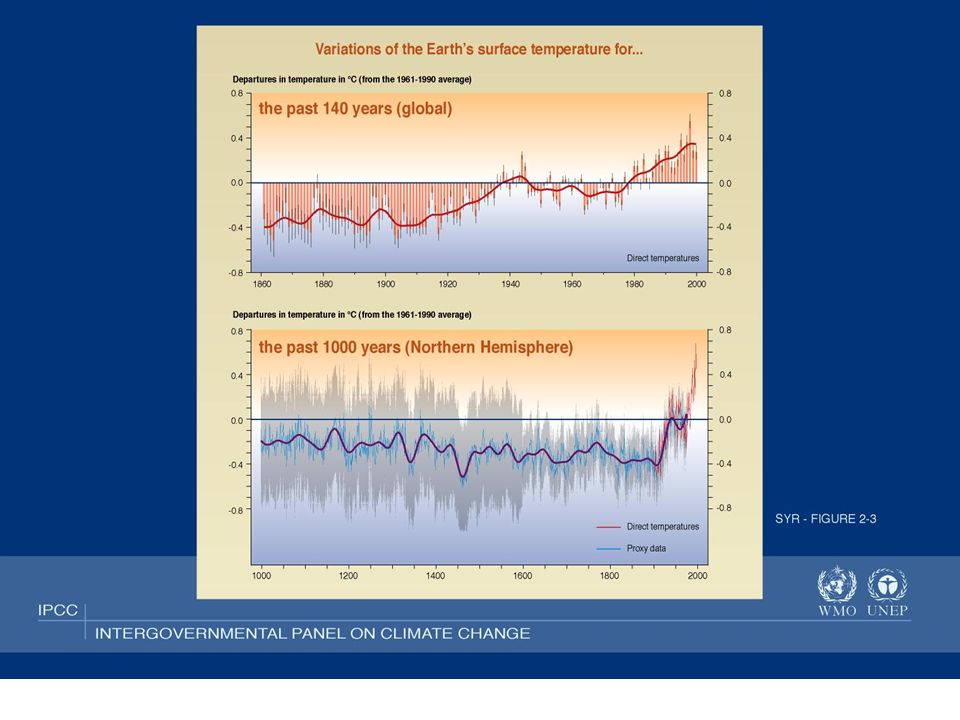
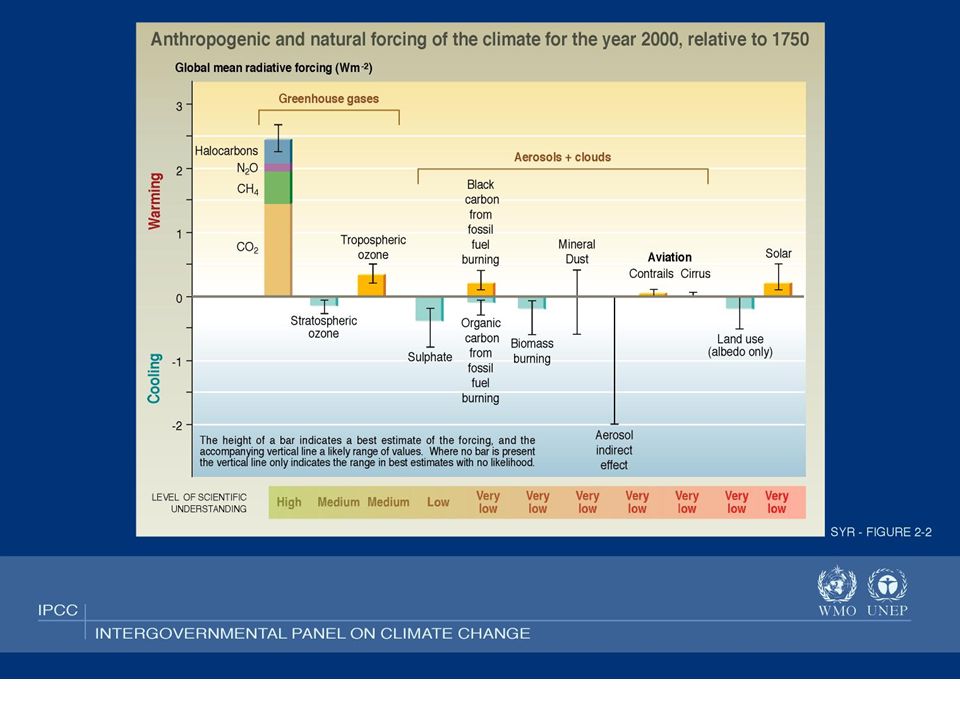
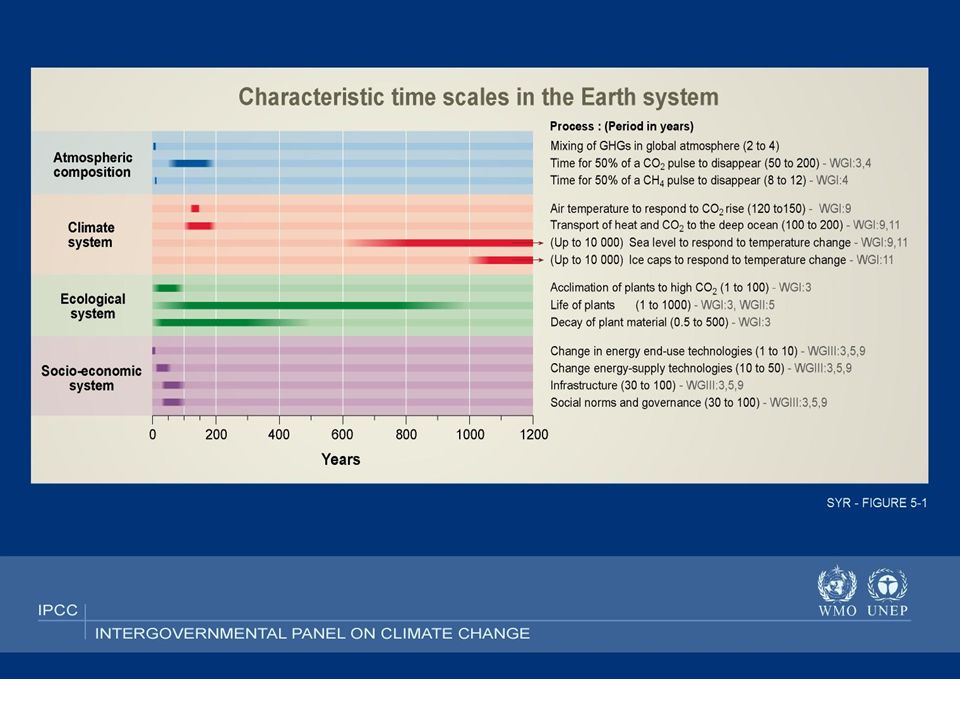
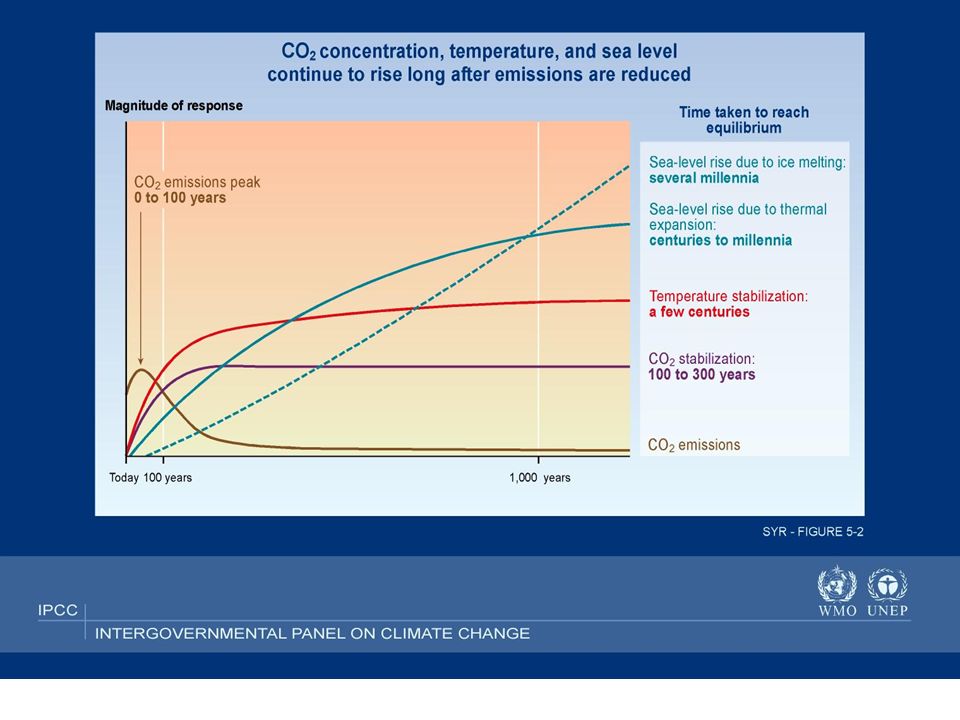
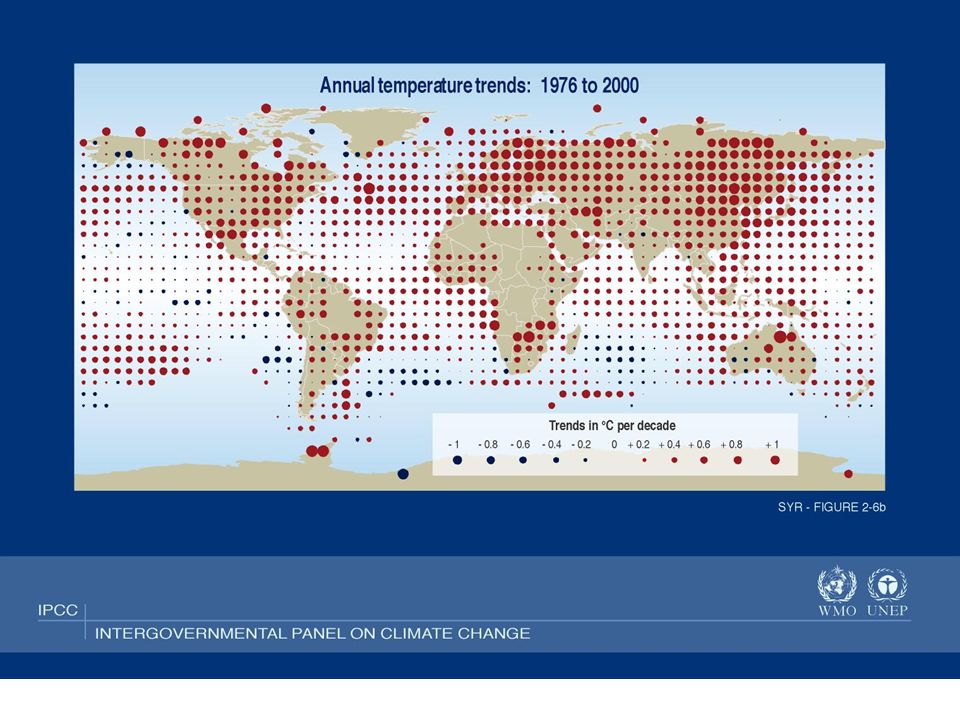
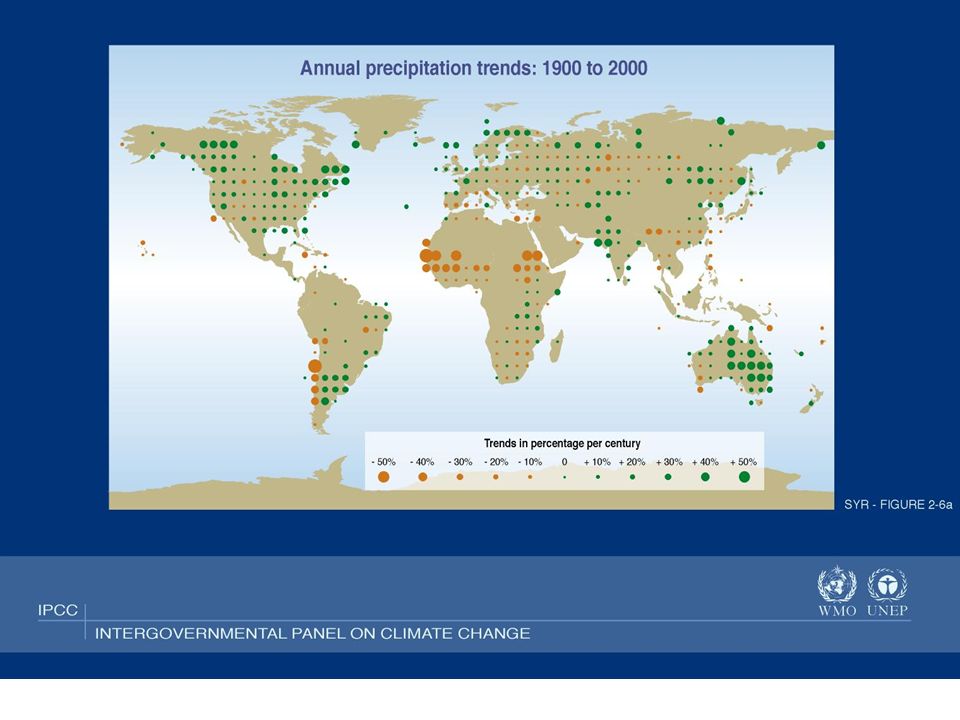
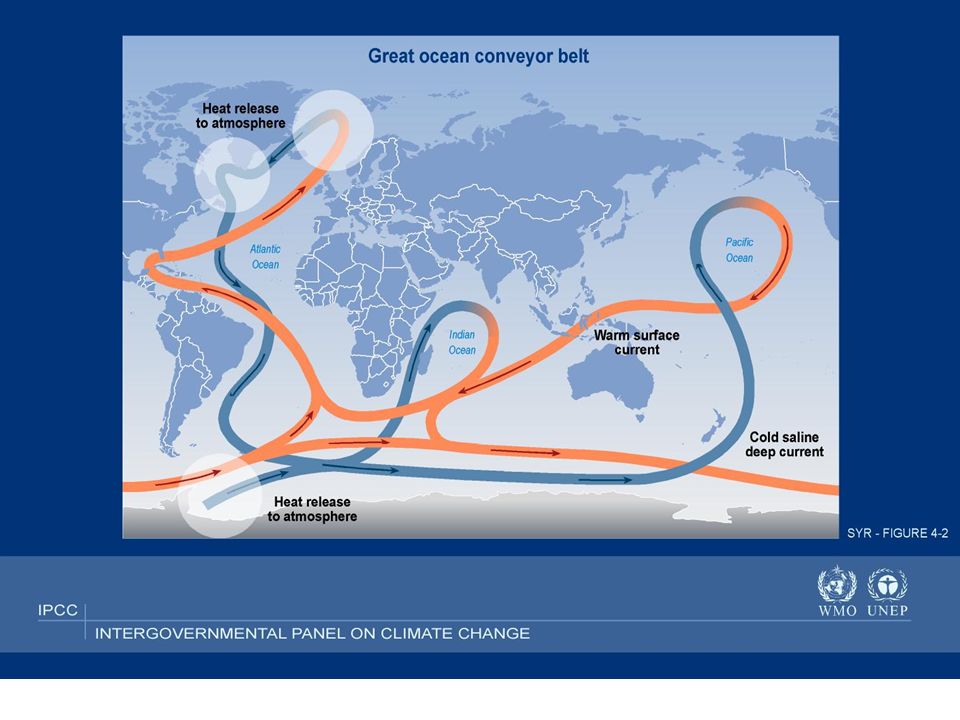
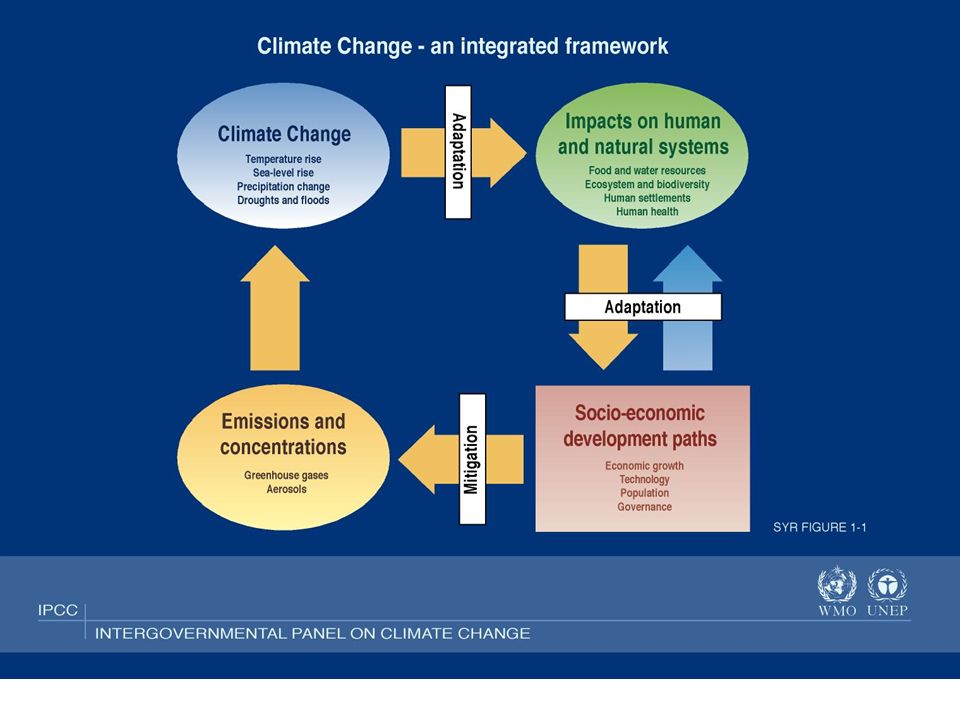
CLIMATE DATA PUBLISHED ON THE IPCC WEBSITE Recognizing the problem of potential global climate change, the World Meteorological Organization (WMO) and the United Nations Environment Programme (UNEP) established the Intergovernmental Panel on Climate Change (IPCC) in 1988. It is open to all members of the UN and WMO. The role of the IPCC is to assess on a comprehensive, objective, open and transparent basis the scientific, technical and socio-economic information relevant to understanding the scientific basis of risk of human-induced climate change, its potential impacts and options for adaptation and mitigation. The IPCC does not carry out research nor does it monitor climate related data or other relevant parameters. It bases its assessment mainly on peer reviewed and published scientific/technical literature. See http://www.ipcc.ch/present/graphics.htm

39
IR IMAGE OF GULF STREAM OCEAN CURRENT See: http://marine.rutgers.edu/mrs/sat_data/

Similar presentations


>")


 Your Organization (Line #2) Global warming.: Matthieu BERCHER, Master M.I.G.S., University of Burgundy,>")


