Download presentation
Presentation is loading. Please wait.

1
Rajamangala Institute of Technology 1 Computer Graphics Hardware Input/Output Technologies

2
Rajamangala Institute of Technology 2 Display Hardware Hard Copy devices –Printers, plotters Transient displays –LCD Monitors, CRT Monitors, projectors

4
Rajamangala Institute of Technology 4 Cathode ray tube Most common is Cathode Ray Tube (CRT) monitor Horizontal and vertical deflectors focus an electron beam on any spot on a phosphor coated screen Electrons hit the screen phosphor molecules and excite them
 monitor Horizontal and vertical deflectors focus an electron beam on any spot on a phosphor coated screen Electrons hit the screen phosphor molecules and excite them")
5
Rajamangala Institute of Technology 5 Phosphors Most phosphors relax back to the ground state by emitting a photon of light which is called fluorescence, which decays in under a millisecond Some molecules may be further excited, and emit a light call phosphorescence, which decays slower, but still rapidly (15-20 milliseconds) Therefore, the screen must be refreshed by redrawing the image They also are characterized by their persistence (time to decay of emitted light) –High persistence cheap and good for text, bad for animation –Low persistence, good for animation, but need high refresh rate
 Therefore, the screen must be refreshed by redrawing the image They also are characterized by their persistence (time to decay of emitted light) –High persistence cheap and good for text, bad for animation –Low persistence, good for animation, but need high refresh rate")
6
Rajamangala Institute of Technology 6 Colour Systems Phosphors have a colour. Colour systems have groups of 3 different phosphors, for red, green and blue. 3 Electron guns used, for R G and B Each pixel consists of 3 dots of phosphor, arranged as triangle Combining different intensities of phosphors can generate different colours SONY Trinitron CRTNEC Hybrid Mask Hitachi EDPStandard Dot-trio

7
Rajamangala Institute of Technology 7 Shadow Masks Shadow maskholes are arranged so that each beam can only excite it’s own color phosphor

8
Rajamangala Institute of Technology 8 Shadow Masks (2)
")
9
Rajamangala Institute of Technology 9 Colours CRT systems employ additive colour mixing: –Red + Green = Yellow –Red + Blue = Magenta –Green + Blue = Cyan –Red + Green + Blue = White We get intermediate colour mixes by varying the intensity of each of the 3 primaries. –Light Orange = 100% R + 50% G + 20% B

10
Rajamangala Institute of Technology 10 Vector Display Devices A.K.A. Vector Scan Displays, Random Scan Devices, Line Plotters The electron beam directly draws the picture e.g. DrawLine(A, B): Turn beam off, move to A. Turn beam on, move to B. A B
: Turn beam off, move to A. Turn beam on, move to B. A B.")
11
Rajamangala Institute of Technology 11 Vector Displays Advantages: High resolution and not discretized Less Storage Space Less Transfer Time (usually) Disadvantages Limited colour capability. Problems with filled areas and shading. Flicker occurs as complexity of image increases. Vector data needs some processing before display Processing required before obtaining the Vector representation Wastage in Overlapping areas

12
Rajamangala Institute of Technology 12 Vector Graphics Although Vector Displays no longer as widely used, it is still common practice to deal with graphics in terms of vector graphics. A Vector File contains a list of entries each of which describes an element of a picture. How a picture element is described depends on what type of element it is. e.g. a line segment can be described in terms of the co-ordinates of its two end points, its thickness, and its style (solid, dotted, etc.) Also curves and shapes. Example: postscript files (PS/EPS) To display on a RASTER device the graphic needs to be rasterized
 Also curves and shapes. Example: postscript files (PS/EPS) To display on a RASTER device the graphic needs to be rasterized.")
13
Rajamangala Institute of Technology 13 Raster Graphics An image made up of many small regularly placed cells (pixels) Stored as an array of numerical values commonly called a pixelmap (or bitmap)
 Stored as an array of numerical values commonly called a pixelmap (or bitmap)")
14
Rajamangala Institute of Technology 14 Raster Scan Devices Scans the screen from top to bottom in a regular pattern (common TV technology) A Raster is a matrix of pixels (picture elements) covering the screen The electron beam is turned on/off so the image is a collection of dots painted on screen one row (scan line) at a time.
 A Raster is a matrix of pixels (picture elements) covering the screen The electron beam is turned on/off so the image is a collection of dots painted on screen one row (scan line) at a time.")
15
Rajamangala Institute of Technology 15 Frame Buffer An image is stored in a special graphics memory area called a frame buffer (or bit map) Each memory location corresponds to a pixel A display processor scans this memory and controls the electron beam at each pixel accordingly For a monochrome system, each pixel is either on or off, so only one bit per pixel is required, and the electron beam is either on or off For gray scale images, 8 bits per pixel gives 256 different intensities of gray
 Each memory location corresponds to a pixel A display processor scans this memory and controls the electron beam at each pixel accordingly For a monochrome system, each pixel is either on or off, so only one bit per pixel is required, and the electron beam is either on or off For gray scale images, 8 bits per pixel gives 256 different intensities of gray")
16
Rajamangala Institute of Technology 16 Rasterization Geometric and Mathematical Data structures typically in vertex coordinates not dependent on resolution We must convert from typical continuous representation to discrete

17
Rajamangala Institute of Technology 17 Rasterization Mostly based on Interpolation: –X and Y projected coordinates –Red, green and blue values –Intensity values –Alpha values –Z values (depth) –Colour index values –Surface Normals –Texture map coordinates
 –Colour index values –Surface Normals –Texture map coordinates")
18
Rajamangala Institute of Technology 18 Anti Aliasing

19
Rajamangala Institute of Technology 19 RAMDAC Random Access Memory Digital-to-Analog Converter, A single chip on video adapter cards. The RAMDAC's role is to convert digitally encoded images into analog signals that can be displayed by a monitor. A RAMDAC actually consists of four different components –SRAM to store the color map –three digital-to-analog converters (DACs), one for each of the monitor's red, green, and blue electron guns.
, one for each of the monitor s red, green, and blue electron guns..")
20
Rajamangala Institute of Technology 20 Raster System Architecture

21
Rajamangala Institute of Technology 21 Raster Scan Systems: Conclusion Advantages of Raster Scan systems: –Low cost (cheap ram used for bitmaps) –Refresh rate independent of image complexity –Handles colour and filled areas images -> high refresh –Regular repetitive => easier and cheaper to implement. Disadvantages –Models must be scan converted. Often this can’t be reused so must do this every frame. –Aliasing –Requires large refresh buffers even for small or simple images. –Images bound to a certain resolution

22
Rajamangala Institute of Technology 22 LCD Technology Liquid Crystal Display A transmissive technology Works by letting varying amounts of a fixed- intensity white backlight through an active filter Organnic crystals that lign themselves together When external force is applied they realign themselves This is used to change polarisation and filter light

23
Rajamangala Institute of Technology 23 CRT Displays Advantages Fast repsonse (high resolution possible) Full color (large modulation depth of E- beam) Saturated and natural colors Inexpensive, matured technology Wide angle, high contrast and brightness Disadvantages Large and heavy (typ. 70x70 cm, 15 kg) High power consumption (typ. 140W) Harmful DC and AC electric and magnetic fields Flickering at 50-80 Hz (no memory effect) Geometrical errors at edges
 High power consumption (typ. 140W) Harmful DC and AC electric and magnetic fields Flickering at Hz (no memory effect) Geometrical errors at edges.")
24
Rajamangala Institute of Technology 24 LCD Displays Advantages Small footprint (approx 1/6 of CRT) Light weight (typ. 1/5 of CRT) Low power consumption (typ. 1/4 of CRT) Completely flat screen - no geometrical errors Crisp pictures - digital and uniform colors No electromagnetic emission Fully digital signal processing possible Large screens (>20 inch) on desktops Disadvantages High price (presently 3x CRT) Poor viewing angle (typ. +/- 50 degrees) Low contrast and luminance (typ. 1:100) Low luminance (typ. 200 cd/m2)
 Low power consumption (typ. 1/4 of CRT) Completely flat screen - no geometrical errors Crisp pictures - digital and uniform colors No electromagnetic emission Fully digital signal processing possible Large screens (>20 inch) on desktops Disadvantages High price (presently 3x CRT) Poor viewing angle (typ. +/- 50 degrees) Low contrast and luminance (typ. 1:100) Low luminance (typ. 200 cd/m2).")
25
Rajamangala Institute of Technology 25 Input DEVICES

26
Rajamangala Institute of Technology 26 Logical Input Devices Diverse variations of input devices exist It is useful to classify object in terms of what it does This provides level of abstraction –Enhances portability (device independent design of interface) –Shields application from physical details
 –Shields application from physical details")
27
Rajamangala Institute of Technology 27 Classes of Logical Input Devices Locator/ Pick –to indicate a position or orientation (subclasses) –to select a displayed entity Valuator –to input a single real number String –To input a character string –Returns key with specific meaning –Letters, Numbers etc. Choice –To select from a set of possible actions or choices –Often return sensory feedback e.g. lights, clicks

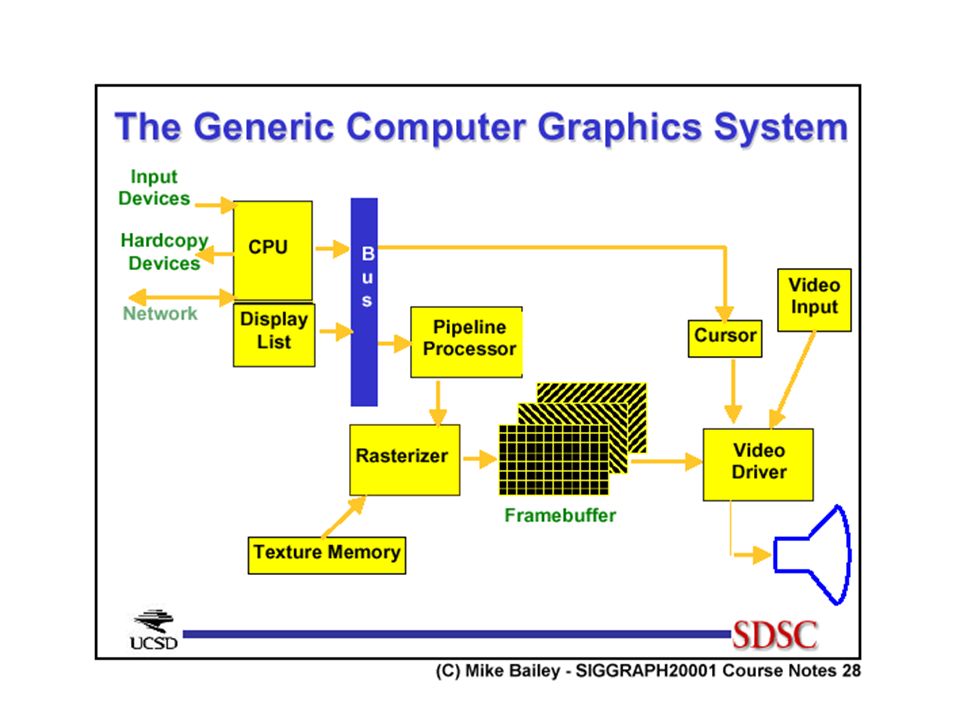
28
Rajamangala Institute of Technology 28 Physical Input Devices (1) Keyboard: string/choice input Gamepad: choice Mouse: pick/locator device with relative positioning and indirect input. Tablet: pick/locator device with absolute positioning and indirect input. Joystick/Trackball: locator/valuator Knobs (e.g. Volume control): valuator devices
: valuator devices.")
29
Rajamangala Institute of Technology 29 3D Input Devices Read a 3D position Returns 3 numbers to the program: an (x,y,z) triple Some also return 3 rotation angles for orientation E.g. Digitizer, VR glove

30
Rajamangala Institute of Technology 30 Physical Input Devices 3D laser scanner/digitizer Data Gloves Motion Capture Devices Eye trackers

31
Rajamangala Institute of Technology 31 Motion Tracker Dataglove Eye Tracker

32
Rajamangala Institute of Technology 32 HITLabs/Microvision Googgles CAVE: Cave Automatic Virtual Environment HMD (Head Mounted Display)
")
33
Rajamangala Institute of Technology 33 COLOUR

34
Rajamangala Institute of Technology 34 Colour Colour is a sensation which occurs when light energy, incident on the retina is interpreted by the brain. Computer Graphics is interested in: –Colour Vision (perception) –Colour Reproduction –Colour Synthesis
 –Colour Reproduction –Colour Synthesis.")
35
Rajamangala Institute of Technology 35 Colour How we see colour: Color Vision The response of the visual system to colour: Colour Appearance How to measure colour: Colorimetry –We need tools to describe and control colour in applications –Colour depends on interactions between the physics of light radiation and the eye-brain system –How are colours described in numerical terms, and how do these descriptions relate to everyday ways of describing colour?

36
Rajamangala Institute of Technology 36 Colour Vision How do we see colour? Light enters the eye as a spectrum of colours, distributed by wavelength – can be represented by a Spectral density function The retina of the eye is its light-sensitive membrane, containing two types of cells: –cones: colour sensitive cells –rods: cannot distinguish colour, nor fine detail, but sensitive to low levels of light (night vision) Spectral Density impinges on retina and is picked up by cones
 Spectral Density impinges on retina and is picked up by cones.")
37
Rajamangala Institute of Technology 37 Light An electromagnetic phenomenon, like television waves, infrared radiation, and x- rays Colour involves those waves that lie in a narrow band of wavelengths in the “visible spectrum”

38
Equi-energy Monochromatic Sunlight Tungsten 380760 Wavelength (nm) Relative Power
 Relative Power")
39
Rajamangala Institute of Technology 39 Pure Spectral light The eye responds to light with wavelengths between approximately 400 and 700 nm Some light sources emit light of essentially a single wave-length (e.g. lasers) Some spectral densities for pure spectral light, and how we perceive them: 400500600700 wavelength Spectral Density (power per unit wavelength) Violet Blue Green Yellow Orange Red
 Some spectral densities for pure spectral light, and how we perceive them: wavelength Spectral Density (power per unit wavelength) Violet Blue Green Yellow Orange Red.")
40
Rajamangala Institute of Technology 40 Example spectra

41
Rajamangala Institute of Technology 41 Cones Human beings have three types of cones responding to different wavelenghts of light: –Short, Medium or Long wavelengths –Or Red, Green and Blue Cones absorb light and send signals to the brain I.e. Spectrum is encoded into three values that correspond to each type of cone - trichromacy

42
Rajamangala Institute of Technology 42 Cone Response 400500600700 blue green rods red Wavelenght (nm) Relative Sensitivity 100 50
 Relative Sensitivity")
43
Rajamangala Institute of Technology 43 Perceived Colour The light from most sources does not consist of only one wavelength In most cases it consists a distribution of wavelenghts An enormous variety of spectra is perceived by the eye as having the same colour - Metamerism

44
Rajamangala Institute of Technology 44 Metamerism Different Spectra sometimes appear the same Brain “sees” due to cone response

45
Rajamangala Institute of Technology 45 Representing Colour How can a particular colour be precisely and unambiguously described? Verbal descriptions such as “Dark blue”, “Bright red”, “Slimy green” are too broad Description of its spectral density curve, by specifying its level at a number of wavelengths is awkward, and too specific, as many different spectral shapes produce the same perceived colour

46
Rajamangala Institute of Technology 46 Numeric Colour Description Ideally, every colour should be described uniquely in some numeric way How many numbers are required to define a colour? What coding scheme can be used to map colours into numbers, and vice versa? There are several different conventions for coding colours, what are they, and how do they relate to each other? International standard for colour description?

47
Rajamangala Institute of Technology 47 Dominant Wavelength Theory Capitalizes on the variety of spectra that produce the same perceived colour Specifies a spectrum having this simple shape: 400700 A D B 620 W

48
Rajamangala Institute of Technology 48 Dominant Wavelength Theory Luminance is the total power in the light: –L = (D - A)B + AW Hue is the location of the dominant wavelength, I.e. the colour of the main pure light present (in previous e.g. it’s red) Saturation is the purity of the light, I.e. the percentage of luminance that resides in the dominant component: – S = (D - A)B L X 100%
 Saturation is the purity of the light, I.e. the percentage of luminance that resides in the dominant component: – S = (D - A)B L X 100%.")
49
Rajamangala Institute of Technology 49 Dominant Wavelength cont. The dominant wavelength, luminance and saturation fully define a colour When D = A, saturation is 0, and white light is seen. When A=0, a pure light is seen. Pastel colours contain much white light, and are therefore unsaturated. The eye can distinguish about 128 different hues, and about 20 different saturations (depending on the hue).
..")
50
Rajamangala Institute of Technology 50 3-dimensional colour spaces Saturation, luminance and hue are useful concepts for describing colour However, not very easy to measure these values when presented with a sample colour It does, however, illustrate the fact that colour perception is three-dimensional, I.e. that any colour may be described uniquely by exactly three numbers Any colour can be represented as a point in a three-dimensional colour space.

51
Rajamangala Institute of Technology 51 Tri-stimulus theory Any colour can be constructed as a linear combination of three primary colours, e.g. C = n1R + n2G + n3B(n1, n2, n3 scalars) (doesn’t have to be red, green and blue, can be any three primaries) e.g. RGB(0,1,0) would be pure green, CMY(.2,.3,.5) would be a yellow Problem! To produce all perceivable colours, some of the above scalars must be negative. This makes no physical sense. Light cannot be removed that isn’t there.
 (doesn’t have to be red, green and blue, can be any three primaries) e.g. RGB(0,1,0) would be pure green, CMY(.2,.3,.5) would be a yellow Problem. To produce all perceivable colours, some of the above scalars must be negative. This makes no physical sense. Light cannot be removed that isn’t there..")
52
Rajamangala Institute of Technology 52 Colour RGB colour: –24 bit colour: 8 bits for each primary –0-255 in unsigned integers –Many graphics packages however would use real numbers ranging from 0 to 1 e.g. float (1.0, 0, 0) equiv. to (255, 0, 0) –32 bit colour: 8 bits per colour + 8 bits for transparency
 equiv. to (255, 0, 0) –32 bit colour: 8 bits per colour + 8 bits for transparency.")
53
Rajamangala Institute of Technology 53 The RGB Color Cube On a display with 3 color phosphors/lamps/LEDs, the possible magnitudes of each color vary from 0 to 1. Thus the space of possible colors in R, G, B space is a unit cube The RGB color cube is a well known vector space defining all possible colour combinats based on the RGB basis vectors E.g. (0, 0, 0) Black, (1, 0, 0) Red, (0, 1, 0) Green, (0, 0, 1) Blue, (1, 1, 0) Yellow, (1, 0, 1) Magenta, (0, 1, 1) Cyan, (1, 1, 1) White
 Black, (1, 0, 0) Red, (0, 1, 0) Green, (0, 0, 1) Blue, (1, 1, 0) Yellow, (1, 0, 1) Magenta, (0, 1, 1) Cyan, (1, 1, 1) White.")
54
Rajamangala Institute of Technology 54 RGB Colour Space This is a vector space with the RGB basis vectors defined by the properties of the monitor phosphors.

55
Rajamangala Institute of Technology 55 Device Dependency Unfortunately the choice of red, green and blue and be quite different in different implementations. If the phosphors colours are slightly different the vector space is different so we cannot use RGB to universally define a unique colour. We require a device independent colour space. RGB Space 1 RGB Space 2

56
Rajamangala Institute of Technology 56 CIE Standard Standard developed by Commission Internationale de L'Eclairage (1931): a way of defining any colour based on the r + g + b = 1 plane. Based on three primaries which are able to produce ALL visible colours. CIE chromaticity diagram is the view you would get looking at the plane x + y + z = 1, straight down the blue axis Provides a standard reference for comparing other color systems

57
Rajamangala Institute of Technology 57 CIE Chromticity Diagram Less natural than RGB However standard is useful for converting betwen colour spaces of different devices

58
Rajamangala Institute of Technology 58 Colour Mixing

59
Rajamangala Institute of Technology 59 Additive Colours CRT Systems employ additive colour mixing: –Red + Green = Yellow –Red + Blue = Magenta –Green + Blue = Cyan –Red + Green + Blue = White We get intermediate colour mixes by varying the intensity of each of the three primaries. –Light Orange = 100%R + 50%G + 20%B Solid spectral colours are optically mixed –by being placed closely together or –by being presented in rapid succession Two or more colours perceived as being one

60
Rajamangala Institute of Technology 60 Subtractive Colours Subtractive colour mixing results from selective absorption of light wavelengths This is the nature of colour print production and Cyan, Magenta and Yellow are considered to be subtractive primaries Overlapping layers of varying percentages of transparent primaries are laid down. Layers of CMY ink subtract inverse percentages from the reflected light so that we see a particular colour.

Similar presentations


>")


