Download presentation
Presentation is loading. Please wait.

1
Distributional Analysis of Tax Policy: Theory and Practice Joseph Rosenberg Urban-Brookings Tax Policy Center February 20, 2014

2
Distributional Analysis of Tax Policy Measuring the impact of tax laws and tax policy changes on individuals. - Motivation? - Concerns? Distributional analysis at the federal level is routinely produced by: Congressional Budget Office (CBO), Joint Committee on Taxation (JCT), U.S. Treasury’s Department of Tax Analysis (OTA), Urban-Brookings Tax Policy Center (TPC)
, Joint Committee on Taxation (JCT), U.S. Treasury’s Department of Tax Analysis (OTA), Urban-Brookings Tax Policy Center (TPC).")
3
Distributional Analysis: Overview Unit of analysis Tax unit; Family; Household Time period Single year; Multiyear; Lifetime Ranking individuals Income; Consumption Definition of income Adjustments for size of unit Measuring tax burden Taxes paid; Burden Incidence assumptions How should we assign tax burdens back to individuals

4
Distributional Analysis: Comparison JCTOTACBOTPC Unit of Analysis Tax unitFamilyHouseholdTax unit Time PeriodSingle yearSingle year (fully phased-in law) Single yearSingle year* Income Measure Expanded Income Cash Income Before-tax Income Expanded Cash Income Size adjustedNoYesNoBoth Taxes Included Income Payroll Corporate* Excise Income Payroll Corporate Excise Estate & Gift Income Payroll Corporate Excise Income Payroll Corporate Estate & Gift Measure of burden Taxes paidBurden
 Single yearSingle year* Income Measure Expanded Income Cash Income Before-tax Income Expanded Cash Income Size adjustedNoYesNoBoth Taxes Included Income Payroll Corporate* Excise Income Payroll Corporate Excise Estate & Gift Income Payroll Corporate Excise Income Payroll Corporate Estate & Gift Measure of burden Taxes paidBurden")
5
Common Incidence Assumptions Individual Income Tax: Borne by individual taxpayer Payroll Tax: Employer & employee portions borne by employee Estate Tax: Borne by decedent Corporate Income Tax: It’s complicated CBO & JCT*: 75% Capital, 25% Labor OTA: 63% Shareholders, 18% Capital, 18% Labor TPC: 60% Shareholders, 20% Capital, 20% Labor Consumption/Excise Tax: It’s really complicated e.g., Toder, Nunns, Rosenberg (2011)
")
6
JCT Distribution Table, 2012

7
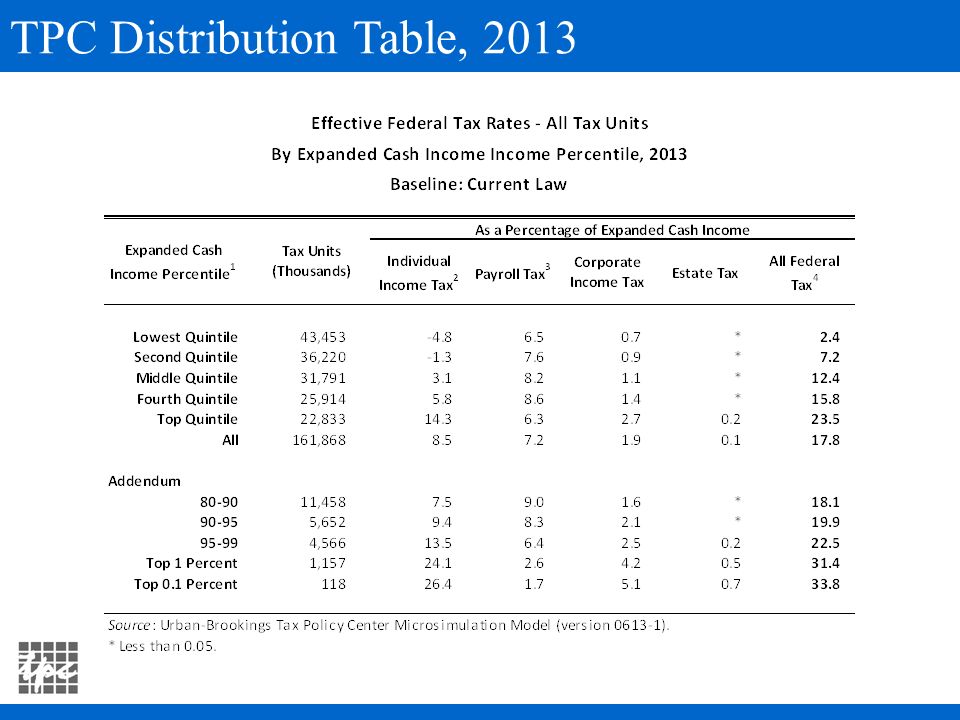
TPC Distribution Table, 2013

9
TPC: Distributional Impact of ATRA

10
CBO, 1979-2010

11
Measuring Income for Distributional Analysis Ranking taxpayers Standard distributional tables rank taxpayers based on annual income as a proxy for their economic status and ability to pay taxes. Measuring tax burdens The overall burden of the tax system (excluding indirect economic costs) can be summarized in the effective tax rate (ETR), the amount of taxes paid measured as a percentage of income. Evaluating the effects of tax policy changes Changes in taxes are often shown as a percentage of pre- tax income or as a percentage change in after-tax income.
 can be summarized in the effective tax rate (ETR), the amount of taxes paid measured as a percentage of income. Evaluating the effects of tax policy changes Changes in taxes are often shown as a percentage of pre- tax income or as a percentage change in after-tax income..")
12
Measuring Income for Distributional Analysis (cont.) Haig-Simons Income: Consumption + Change in Net Wealth Practical Difficulties: Administrative (e.g., accrued capital gains) Timing (e.g., retirement income) Imputed Rent! Relative to narrow income measures (e.g., AGI), broad income measures provide a more accurate ranking of taxpayers and better estimates of the burden of the tax system and tax policy changes.
, broad income measures provide a more accurate ranking of taxpayers and better estimates of the burden of the tax system and tax policy changes..")
13
Conceptual Issues in Measuring Income Transfer Payments –Cash transfers –In-kind transfers Timing of Retirement Income –Defined benefit –Defined contribution Front-loaded Back-loaded Corporate Income Tax Data Quality –Administrative vs. Imputed Data

14
Comparison of Different Income Measures

15
Distribution of Sources of ECI

16
Distributional Analysis in Practice: Example “Who Benefits from Tax-Exempt Bonds?: An Application of the Theory of Tax Incidence” (with Harvey Galper, Kim Rueben, and Eric Toder) Motivation: Often claimed… “Tax-exemption only benefits holders of tax-exempt bonds” “80% of the benefit accrues to state & local governments in the form of lower financing costs”
 Motivation: Often claimed… Tax-exemption only benefits holders of tax-exempt bonds 80% of the benefit accrues to state & local governments in the form of lower financing costs")
17
Tax Incidence: General Principles General Principles: Economic burdens may differ from statutory burdens Tax burdens ultimately borne by individuals Individuals are affected according to how they earn the income (“sources-side”) and how they spend their income (“uses-side”) Sources-side: Taxes reduce after-tax incomes depending on the size and composition of an individual’s income Uses-side: Taxes affect relative prices and can reallocate resources across goods and/or sectors of the economy
 and how they spend their income ( uses-side ) Sources-side: Taxes reduce after-tax incomes depending on the size and composition of an individual’s income Uses-side: Taxes affect relative prices and can reallocate resources across goods and/or sectors of the economy")
18
Incidence of Muni Tax Exemption: Theory Current Method: Allocate benefit in proportion to reported tax-exempt interest Sources-side: Creates implicit taxes and subsidies in pre- tax incomes, spread across… all interest income all capital income capital and labor income Uses-side: Net transfer to S&L governments from other sectors lower S&L taxes (to whom?), or higher S&L spending (for what?)
, or higher S&L spending (for what )")
19
Capital Market Effects of Tax Exemption In theory, the yield spread between tax-exempt debt and similar taxable debt should proxy for the value of tax exemption. Literature on BABs finds a range of yield spreads, but generally centered around 25% Important Stylized Fact: Tax-exempt interest reported across a wide range of incomes and marginal tax brackets, casting doubt on pure clientele or “marginal investor” model of capital market equilibrium. We refer to the empirical yield spread as the “implied equilibrating tax rate.”

20
Model Simulations: Methodology Sources-side: Using implied yield spread, we calculate an “adjusted” measure of pre-tax income by grossing up tax-exempt interest and then adjusting down relevant income sources in order to hold aggregate pre-tax income constant. Uses-side: Zero-sum reallocation among… Positive reallocation to state & local governments –Case 1: Lower taxes distributed in proportion to MAGI –Case 2: Higher spending distributed per capita Negative reallocation to other sectors –Distributed in proportion to private consumption by income group3

21
Simulations: Main Findings Overall, majority of the benefit from exemption accrues to top 5%. However: Relative to conventional methodology, “sources-side” effects spread the benefit more broadly across income distribution –Benefits spread to holders of taxable securities –But benefit still goes disproportionately to top 5 percent Uses-side effects can be large for the bottom quintile –They either benefit more from increased S&L provided goods & services or less from S&L tax cuts, than the harm to them from higher relative prices on consumption goods

22
Simulations: Results

23
Advances in Distributional Analysis Where to go from here: Better data sources Incorporating state/local taxes –Distribution of federal taxes by state –Distribution of state income taxes Integrating taxes and transfer/spending programs (e.g., CBO, 2013)
")
Similar presentations


 tax – Disability tax Taxes on spending – Sales tax – Excise tax Taxes on wealth.>")


 and.>")

