Download presentation
Presentation is loading. Please wait.

1
ERT 209 HEAT AND MASS TRANSFER FOR BIOPROCESS ENGINEERING Dryer

2
Purpose of Drying Removal of small amount of water or organic liquids from solids (process materials). The difference between evaporation and drying: 1. Evaporation: remove large amount of water Drying: remove relatively small of water 2. Evaporation: water is removed as vapor at its boiling point Drying: water is removed as a vapor by air Moisture content of the final dried product varies depending upon the type of product. Example: Dried salt (0.5% water); coal (4%) and food products (5%) Final processing step before packaging.
; coal (4%) and food products (5%) Final processing step before packaging.")
3
Drying or dehydration of biological materials, especially foods is used as preservation technique.
Microorganisms cannot grow and multiply in the absence of water. Below 10 wt% - the microorganisms are not active To preserve flavor & nutrition – 5 wt% water content Some biological materials & pharmaceuticals may not be heated for ordinary drying – may be freeze dried.

4
General Drying Methods
2 ways: Batch – the material is insert into the drying equipment and drying is proceeds for a given period of time Continuous – the material is continuously added to the dryer and dried material is continuously removed. 3 types of physical conditions: Heat is added by direct contact with heated air at atm pressure Vacuum drying Freeze drying

5
Equipment for Drying There are several types of dryers: Tray Dryer
Vacuum-Shelf Indirect Dryers Continuous Tunnel Dryers Rotary Dryers Drum Dryers Spray Dryers

6
Tray Dryer

7
Spray Dryer

8
Vapor Pressure of Water

9
Humidity Definition of humidity Percentage humidity
Percentage relative humidity Dew point of an air-water vapor mixture Humid heat of an air-water vapor mixture Total enthalphy of an air-water vapor mixture Humidity chart of air-water vapor mixtures

10
Humidity Humidification involves the transfer of water from the liquid phase into a gaseous mixture of air and water vapor. Dehumidification involves the reverse transfer, whereby water vapor is transferred from the vapor state to the liquid state. Definition of humidity: The humidity H of an air - water vapor mixture is defined as the kg of water vapor contained in 1 kg of dry air. Humidity depends on partial pressure pA of water vapor in the air and total pressure P (assume to be kPa, 1.0 atm abs, or 760 mm Hg).
.")
11
1. The humidity is defined as:
Saturated air – water vapor is in equilibrium with liquid water at the given temperature & pressure. Saturation Humidity, Hs is:

12
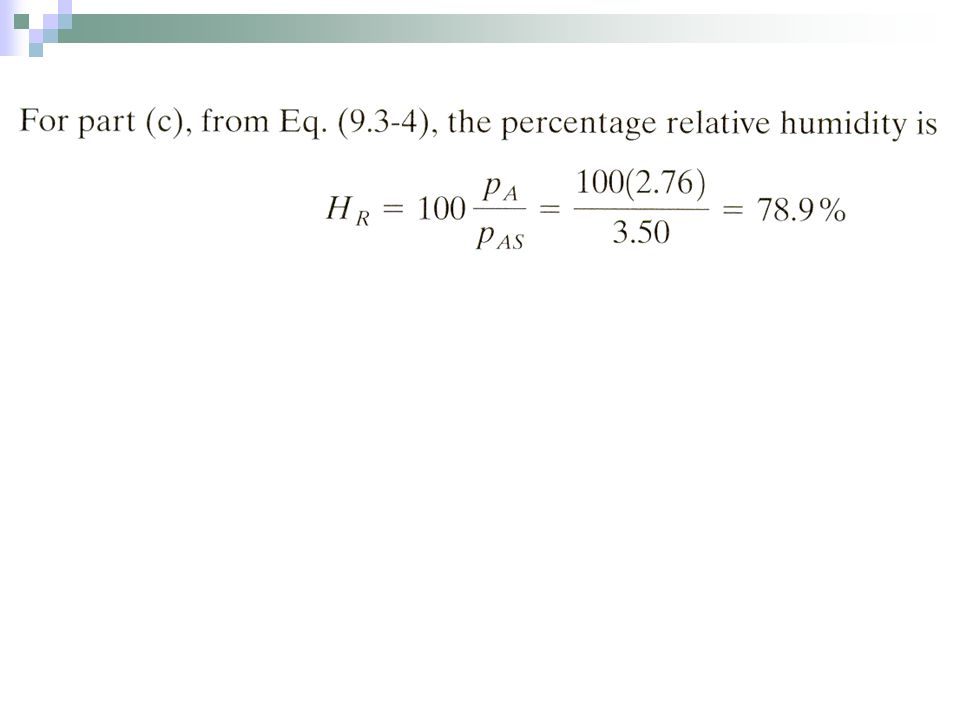
2. Percentage humidity, Hp :
- 100 times the actual humidity H of the air divided by the humidity Hs if the air were saturated at the same temperature and pressure: 3. Percentage relative humidity, HR The amount of saturation of an air-water vapor mixture is also given as percentage relative humidity HR using partial pressures:

13
EXAMPLE 9.3-1. Humidity from Vapor-Pressure Data
The air in a room is at 26.70C (800F) and a pressure of kPa and contains water vapor with a partial pressure pA = 2.76 kPa. Calculate the following: (a) Humidity, H. (b) Saturation humidity, Hs, and percentage humidity, Hp. (c) Percentage relative humidity, HR.
 and a pressure of kPa and contains water vapor with a partial pressure pA = 2.76 kPa. Calculate the following: (a) Humidity, H. (b) Saturation humidity, Hs, and percentage humidity, Hp. (c) Percentage relative humidity, HR.")
14
Solution: From the steam tables at 26.70C, the vapor pressure of water is pAS = kPa (0.507 psia). Also, pA = 2.76 kPa and P = kPa (14.7 psia). For part (a), using Eq. (9.3-1),
. Also, pA = 2.76 kPa and P = kPa (14.7 psia). For part (a), using Eq. (9.3-1),")
16
4. Dew Point of an air-water vapor mixture
Dew dew-point temperature is the temperature at which a given mixture of air and water vapor would be saturated. Example: From steam table, at 26.70C, saturation vapor pressure, pAS = kPa, hence the dew point of a mixture containing water vapor having a vapor pressure (pA) of 3.50 kPa is 26.70C. If an air-water vapor mixture is at 37.80C, and contain water vapor pA = 3.50 kPa, the mixture would not be saturated.
 of 3.50 kPa is 26.70C. If an air-water vapor mixture is at 37.80C, and contain water vapor pA = 3.50 kPa, the mixture would not be saturated.")
17
5. Humid heat of an air-water vapor mixture
The humid heat cs is the amount of heat in J (or kJ) required to raise the temperature of 1 kg of dry air plus the water vapor present by 1 K or 1°C. The heat capacity of air and water vapor can be assumed constant over the temperature ranges usually encountered at kJ/kg dry air•K and 1.88 kJ/kg water vapor•K,respectively. Hence, for SI and English units,
 required to raise the temperature of 1 kg of dry air plus the water vapor present by 1 K or 1°C. The heat capacity of air and water vapor can be assumed constant over the temperature ranges usually encountered at kJ/kg dry air•K and 1.88 kJ/kg water vapor•K,respectively. Hence, for SI and English units,")
18
6. Humid volume of an air-water vapor mixture
The humid volume vH,. is the total volume in m3 of 1 kg of dry air plus the vapor it contains at kPa (1.0 atm) abs pressure and the given gas temperature. Using the ideal gas law, For a saturated air-water vapor mixture, H = HS, and vH is the saturated volume.
 abs pressure and the given gas temperature. Using the ideal gas law, For a saturated air-water vapor mixture, H = HS, and vH is the saturated. volume.")
19
7. Total enthalpy of an air-water vapor mixture
The total enthalpy of 1 kg of air plus its water vapor is Hy (J/kg or kJ/kg) dry air. If T0 is the datum temperature chosen for both components, the total enthalpy is the sensible heat of the air-water vapor mixture plus the latent heat λ0 in J/kg or kJ/kg water vapor of the water vapor at T0.
 dry air. If T0 is the datum temperature chosen for both components, the total enthalpy is the sensible heat of the air-water vapor mixture plus the latent heat λ0 in J/kg or kJ/kg water vapor of the water vapor at T0.")
20
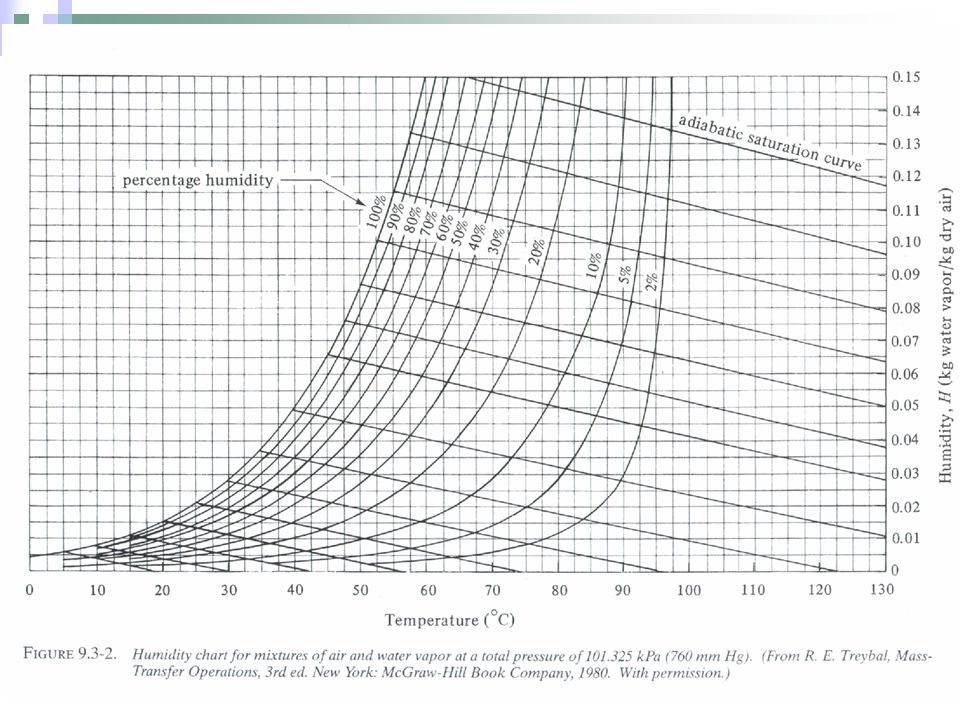
8. Humidity Chart of an air-water vapor mixture
Humidity chart (Fig ) : A convenient chart of the properties of air-water vapor mixtures at 1.0 atm abs pressure. In this figure the humidity H is plotted versus the actual temperature of the air-water vapor mixture (dry bulb temperature). The curve marked 100% running upward to the right gives the saturation humidity H as a function of temperature. In Example 9.3-1, for 26.7°C, HS was calculated as kg H20/kg air. Plotting this point for 26.7°C (80°F) and HS = on Fig , it falls on the 100% saturated line. Any point below the saturation line represents unsaturated air-water vapor mixtures.
 : A convenient chart of the properties of air-water vapor mixtures at 1.0 atm abs pressure. In this figure the humidity H is plotted versus the actual temperature of the air-water vapor mixture (dry bulb temperature). The curve marked 100% running upward to the right gives the saturation humidity H as a function of temperature. In Example 9.3-1, for 26.7°C, HS was calculated as kg H20/kg air. Plotting this point for 26.7°C (80°F) and HS = on Fig , it falls on the 100% saturated line. Any point below the saturation line represents unsaturated air-water vapor mixtures.")
21
The curved lines below the 100% saturation line and running upward to the right represent unsaturated mixtures of definite percentage humidity HP. All the percentage humidity lines HP mentioned and the saturation humidity line HS can be calculated from the data for vapor pressure of water.

23
EXAMPLE 9.3-2. Use of Humidity Chart
Air entering a dryer has a temperature (dry bulb temperature) of 60 0C (140 F) and a dew point of C (80°F). Using the humidity chart, determine the actual humidity H, percentage humidity H, humid heat cS, and humid volume vH in SI and English units.
 of 60 0C (140 F) and a dew point of C (80°F). Using the humidity chart, determine the actual humidity H, percentage humidity H, humid heat cS, and humid volume vH in SI and English units.")
24
Solution: The dew point of 26.70C is the temperature when the given mixture is at 100% saturation. Starting at 26.7°C (Fig ), and drawing a vertical line until it intersects the line for 100% humidity, a humidity of H = kg H2O/kg dry air is read off the plot. This is the actual humidity of the air at 60°C. Stated in another way. if air at 60 °C and having a humidity H = is cooled, its dew point will be 26.7°C. In English units, H = lb H2O/lb dry air. Locating this point where H = and t = 600C on the chart, the percentage humidity HP is found to be 14%, by linear interpolation vertically between the 10 and 20% lines.
, and drawing a vertical line until it intersects the line for 100% humidity, a humidity of H = kg H2O/kg dry air is read off the plot. This is the actual humidity of the air at 60°C. Stated in another way. if air at 60 °C and having a humidity H = is cooled, its dew point will be 26.7°C. In English units, H = lb H2O/lb dry air. Locating this point where H = and t = 600C on the chart, the percentage humidity HP is found to be 14%, by linear interpolation vertically between the 10 and 20% lines.")
25
The humid heat for H = 0.0225 is, from Eq. (9.3-6),
,")
26
Tutorial/Exercise Problem 9.3-3.
Use of the Humidity Chart. The air entering a dryer has a temperature of C (150 F) and dew point of C (60 F). Using the humidity chart, determine the actual humidity and percentage humidity. Calculate the humid volume of this mixture and also calculate cs using SI and English units. Ans. H = kg H20/kg dry air, HP = 5.3%, cS = kJ/kg. K (0.245 btu/lbm.°F), vH = m3 air + water vapor/kg dry air
 and dew point of C (60 F). Using the humidity chart, determine the actual humidity and percentage humidity. Calculate the humid volume of this mixture and also calculate cs using SI and English units. Ans. H = kg H20/kg dry air, HP = 5.3%, cS = kJ/kg. K (0.245 btu/lbm.°F), vH = m3 air + water vapor/kg dry air.")
27
Problem 9.3-4. - Properties of Air to a Dryer.
An air water vapor mixture going to a drying process has a dry bulb temperature of C and a humidity of kg H20/kg dry air. Using the humidity chart and appropriate equations, determine the percentage humidity, saturation humidity at 57.2°C, dew point, humid heat, and humid volume. Ans. HP = 23%, dew point, t = 31.70C, cS = kJ/kg. K (0.254 btu/lbm.°F), vH = m3/kg dry air
, vH = m3/kg dry air.")
28
Adiabatic Saturation Temperature
Consider the process shown in Fig The entering gas of air-water vapor mixture is contacted with a spray of liquid water. The process is adiabatic. The gas leaves having a different humidity and temperature. The water is recirculated, with some makeup water added. Adiabatic saturation temperature, Ts is a steady state temperature of water being recirculated. Adiabatic humidification lines or adiabatic saturation line is shown in Fig

30
EXAMPLE 9.3-3. Adiabatic Saturation of Air
An air stream at C having a humidity H = kg H2O/kg dry air is contacted in an adiabatic saturator with water. It is cooled and humidified to 90% saturation. (a) What are the final values of H and T? (b) For 100% saturation, what would be the values of H and T? Solution: For part (a), the point H = and T = C is located on the humidity chart. The adiabatic saturation curve through this point is followed upward to the left until it intersects the 90% line at 42.5°C and H = kg H20/kg dry air. For part (b), the same line is followed to 100% saturation, where T C and H = kg H20/kg dry air.
 What are the final values of H and T (b) For 100% saturation, what would be the values of H and T Solution: For part (a), the point H = and T = C is located on the humidity chart. The adiabatic saturation curve through this point is followed upward to the left until it intersects the 90% line at 42.5°C and H = kg H20/kg dry air. For part (b), the same line is followed to 100% saturation, where T C and H = kg H20/kg dry air.")
31
Wet Bulb Temperature Wet bulb temperature is the steady-state non-equilibrium temperature reached when a small amount of water is contacted under adiabatic conditions by a continuous stream of gas. FIGURE Measurement of wet bulb temperature.

32
EXAMPLE 9.3-4. Wet Bulb Temperature and Humidity
A water vapor air mixture having a dry bulb temperature of T = 60 0C is passed over a wet bulb, as shown in Fig , and the wet bulb temperature obtained is Tw= C. What is the humidity of the mixture? Solution: The wet bulb temperature of 29.5°C can be assumed to be the same as the adiabatic saturation temperature Ts, as discussed. Following the adiabatic saturation curve of C until it reaches the dry bulb temperature of 60 0C, the humidity is H = kg H20/kg dry air.

33
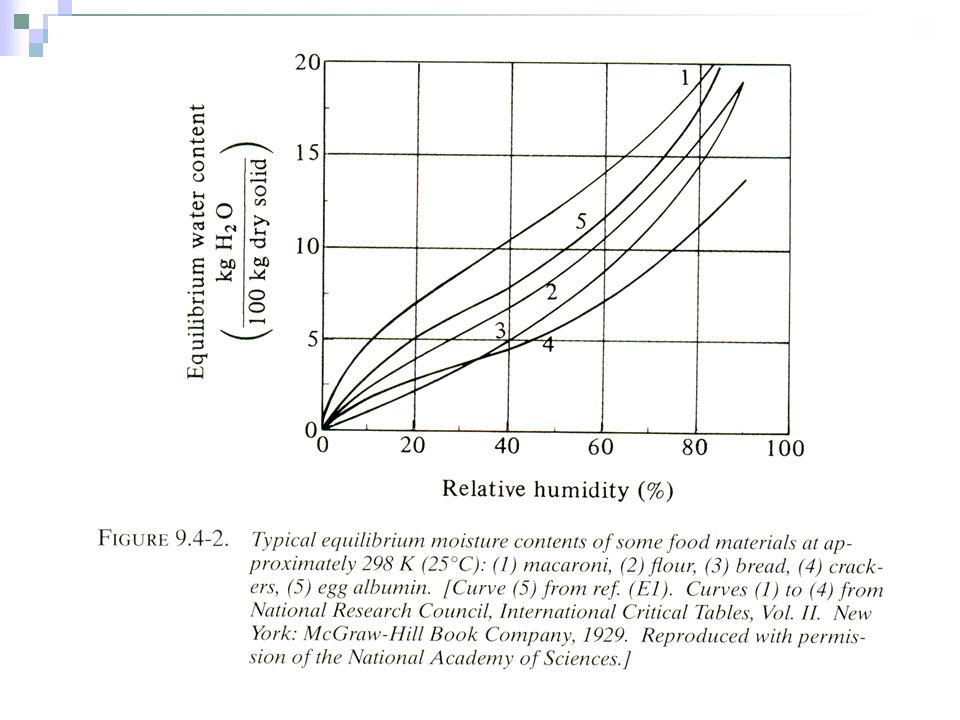
Equilibrium Moisture Content of Materials
The material will dry until it reaches its equilibrium value.

35
Rate-of-Drying Curves
Introduction & Experimental Methods Rate of Drying Curves for Constant-Drying Conditions Drying in the Constant-Rate Period Drying in the Falling-Rate Period

36
Introduction & Experimental Methods
To determine rate of drying for a given material, a sample is usually placed on a tray. If it is a solid material it should fill the tray so that only the top surface is exposed to the drying air stream. By suspending the tray from a balance in a cabinet or duct through which the air is flowing, the loss in weight of moisture during drying can be determined at different intervals without interrupting the operation.

37
Rate of Drying Curves for Constant-Drying Conditions
Data obtained from a batch-drying experiment are usually obtained as W total weight of the wet solid (dry solid plus moisture) at different times t hours in the drying period. These data can be converted to rate-of-drying data in the following ways. First, the data are recalculated. Where: W = the weight of the wet solid in kg total water plus dry solid and WS = the weight of the dry solid in kg,
 at different times t hours in the drying period. These data can be converted to rate-of-drying data in the following ways. First, the data are recalculated. Where: W = the weight of the wet solid in kg total water plus dry solid and WS = the weight of the dry solid in kg,")
38
The free moisture content X in kg free water/kg dry solid is calculated for each value of Xt:
where X * = the equilibrium moisture content kg equilibrium moisture/kg dry solid (can be determined for the given constant drying condition). Using the data calculated from Eq. (9.5-2), a plot of free moisture content X versus time t in hour is made as in Fig a.
. Using the data calculated from Eq. (9.5-2), a plot of free moisture content X versus time t in hour is made as in Fig a.")
39
Fig. 9.5-1 Typical drying rate curve for constant drying conditions
(a) plot data as free moisture versus time
 plot data as free moisture versus time.")
40
To obtain the rate-of-drying curve from this plot, the slopes of the tangents drawn to the curve in Fig. 9.5-la can be measured, which give values of dX/dt at given values of t. The drying rate R is calculated for each point by where; R = drying rate in kg H2O/h.m2 (lbm H2O/h.ft2) LS = kg of dry solid used (lbm) A = exposed surface area in m2 (ft2)
 LS = kg of dry solid used (lbm) A = exposed surface area in m2 (ft2)")
41
The drying rate curve is then obtained by plotting R versus the moisture content as in Fig. 9.5-1b.

42
Rate-of-drying curve. In Fig. 9.5-lb the rate-of-drying curve for constant-drying conditions is shown. At point A - at zero time: the initial free moisture content. In the beginning the solid is usually at a colder temperature than its ultimate temperature, and the evaporation rate will increase. At point B - the surface temperature rises to its equilibrium value. Alternatively, if the solid is quite hot to start with, the rate may start at point A’.

43
From point B to point C the line is straight the slope and rate are constant during this period. This constant-rate-of-drying period is shown as line BC in Fig. 9.5-lb. At point C on both plots the drying rate starts to decrease in the falling-rate period until it reaches point D. In this first falling-rate period, the rate shown as line CD in Fig. 9.5-lb is often linear. At point C in Fig. 9.51b is at the critical free moisture content XC - the entire surface is no longer wetted. The wetted area continually decreases in this first falling-rate period until the surface is completely dry at point D.

44
At point D the rate of drying falls even more rapidly, until it reaches point E, the equilibrium moisture content is X* and X = X* - X* = 0.

45
Calculation Methods for Constant-Rate Drying Period
The important factor in drying calculations is the length of time required to dry the material from a given initial free moisture content X1 to a final moisture content X2. 2 Methods: a) Method using Experimental Drying Curve - using Drying Curve - using rate of drying curve for constant rate period b) Method using Predicted Transfer Coefficients for Constant-Rate Period
 Method using Experimental Drying Curve. - using Drying Curve. - using rate of drying curve for constant rate period. b) Method using Predicted Transfer Coefficients for Constant-Rate Period.")
46
a) Method using Experimental Drying Curve
1) The time required for the constant-rate period can be determined directly from the drying curve of free moisture content versus time. EXAMPLE Time of Drying from Drying Curve A solid whose drying curve is represented by Fig. 9.5-la is to be dried from a free moisture content X1 = 0.38 kg H20/kg dry solid to X2 = 0.25 kg H20/kg dry solid. Estimate the time required. Solution: From Fig. 9.5-la for X1 = 0.38 , t1 is read off as 1.28 h For X2 = 0.25, t2 = 3.08 h. Hence, the time required is = t2 - t1 = = 1.80h.
 The time required for the constant-rate period can be determined directly from the drying curve of free moisture content versus time. EXAMPLE Time of Drying from Drying Curve. A solid whose drying curve is represented by Fig. 9.5-la is to be dried from a free moisture content X1 = 0.38 kg H20/kg dry solid to X2 = 0.25 kg H20/kg dry solid. Estimate the time required. Solution: From Fig. 9.5-la for X1 = 0.38 , t1 is read off as 1.28 h. For X2 = 0.25, t2 = 3.08 h. Hence, the time required is = t2 - t1 = = 1.80h.")
47
Method using rate of drying curve for constant rate period
The drying rate is defined as: The equation can be rearranged and integrated over the time interval fro drying from X1 at t1 = 0 to X2 at t2 = t: Integrating Eq. (9.6-1) for the rate constant period (where R = Rc = constant)
 for the rate constant period (where R = Rc = constant)")
48
EXAMPLE 9.6-2. Drying Time from Rate-of-Drying Curve
A solid whose drying curve is represented by Fig. 9.5-la is to be dried from a free moisture content X1 = 0.38 kg H20/kg dry solid to X2 = 0.25 kg H20/kg dry solid. Estimate the time required. use Eq. (9.6-2) and Fig. 9.5-lb. Solution: As stated previously, a value of 21.5 for L /A was used to prepare Fig. 9.5-lb from 9.5-la. From Fig b, Rc = 1.51 kg H20/h.m2. Substituting into Eq. (9.6-2), This is close to the value of 1.80 h in Example
 and Fig. 9.5-lb. Solution: As stated previously, a value of 21.5 for L /A was used to prepare Fig. 9.5-lb from 9.5-la. From Fig b, Rc = 1.51 kg H20/h.m2. Substituting into Eq. (9.6-2), This is close to the value of 1.80 h in Example")
49
b) Method using Predicted Transfer Coefficients for Constant-Rate Period
Equations for predicting constant-rate drying The rate of convective heat transfer q in W (J/s, btu/h) from the gas at T 0C (0F) to the surface of the solid at Tw C, where (T - Tw) 0C = (T - Tw) K is: Where: h is the heat-transfer coefficient in W/m2.K (btu/h.ft2.°F) A is the exposed drying area in m2 (ft2).
 from the gas at T 0C (0F) to the surface of the solid at Tw C, where (T - Tw) 0C = (T - Tw) K is: Where: h is the heat-transfer coefficient in W/m2.K (btu/h.ft2.°F) A is the exposed drying area in m2 (ft2).")
50
2) The equation of the flux of water vapor from the surface is:
3) The amount of heat needed to vaporize NA kg mol/s.m2 water: Where λw is the latent heat at Tw in J/kg (btu/lbm). 4) Rate of drying, RC:
 The amount of heat needed to vaporize NA kg mol/s.m2 water: Where λw is the latent heat at Tw in J/kg (btu/lbm). 4) Rate of drying, RC:")
51
5) The heat transfer coefficient can be calculated as follow:
Where G = vρ (kg/h.m2) and h is W/m2.K. 6) Time of drying during the constant-rate period:
 and h is W/m2.K. 6) Time of drying during the constant-rate period:")
52
EXAMPLE 9.6-3. Prediction of Constant-Rate Drying
An insoluble wet granular material is dried in a pan x m (1.5 X 1.5 ft) and 25.4 mm deep. The material is 25.4 mm deep in the pan, and the sides and bottom can be considered to be insulated. Heat transfer is by convection from an air stream flowing parallel to the surface at a velocity of 6.1 m/s (20 ft/s). The air is at 65.6°C (150 F) and has a humidity of kg H20/kg dry air. Estimate the rate of drying for the constant-rate period using SI and English units.
 and 25.4 mm deep. The material is 25.4 mm deep in the pan, and the sides and bottom can be considered to be insulated. Heat transfer is by convection from an air stream flowing parallel to the surface at a velocity of 6.1 m/s (20 ft/s). The air is at 65.6°C (150 F) and has a humidity of kg H20/kg dry air. Estimate the rate of drying for the constant-rate period using SI and English units.")
53
Solution: For a humidity H = and dry bulb temperature of C, using the humidity chart, Fig , the wet bulb temperature Tw is found to be C (84 F) and Hw = by following the adiabatic saturation line (the same as the wet bulb line) to the saturated humidity. Using Eq. (9.3-7) to calculate the humid volume,
 and Hw = by following the adiabatic saturation line (the same as the wet bulb line) to the saturated humidity. Using Eq. (9.3-7) to calculate the humid volume,")
55
At Tw = 28.9 0C (84 F), λw = 2433 kJ/kg (1046 btu/lbm) from steam tables.
Substituting into Eq. (9.6-8) and noting that ( )0C = ( ) K,
 and noting that ( )0C = ( ) K,")
57
Calculation Methods for Falling-Rate Drying Period
In the falling rate drying period, the rate of drying R is not constant but decreases when drying proceeds past the critical free moisture content XC. The time of drying for any region between X1 and X2 has been given by: In falling rate drying period, R varies. Plot 1/R versus X, determining the area under the curve using numerical integration.

58
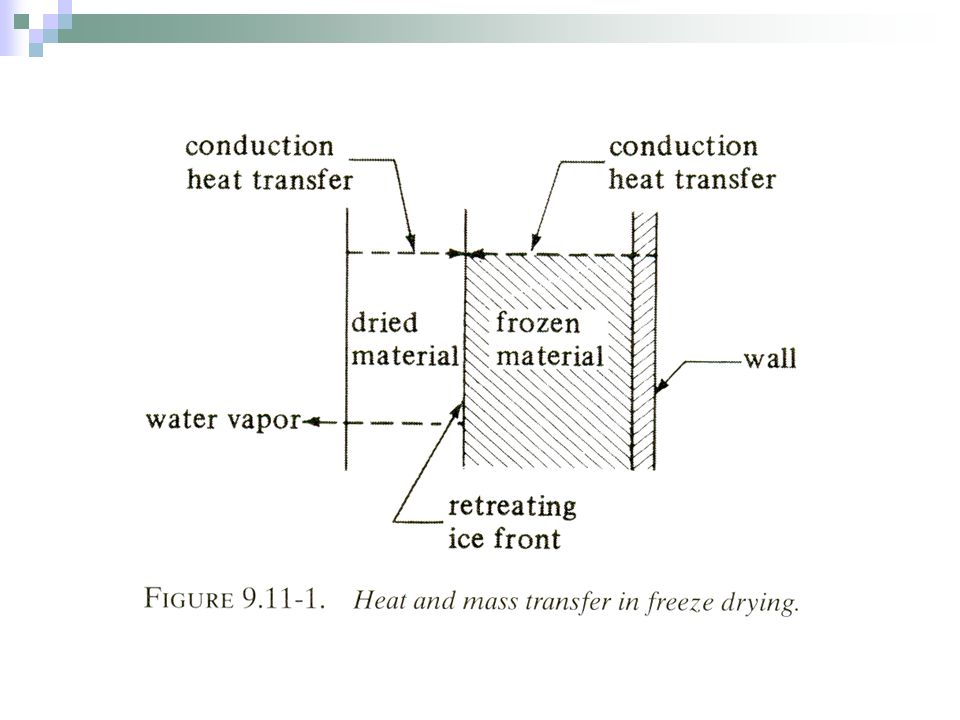
Freeze-Drying of Biological Materials
For certain foodstuffs, pharmaceuticals, and biological materials, which may not be heated even to moderate temperatures in ordinary drying. The substance to be dried is usually frozen by exposure to very cold air. In freeze-drying, the water is removed as a vapor by sublimation from the frozen material in a vacuum chamber. After the moisture sublimes to a vapor, it is removed by mechanical vacuum pumps or steam jet ejectors. Advantages: a) highest-quality food product - little loss of flavor and aroma. b) the low temperatures involved minimize the degrading reactions which normally occur in ordinary drying processes However, freeze-drying is an expensive form of dehydration for foods because of the slow drying rate and the use of vacuum.
 highest-quality food product - little loss of flavor and aroma. b) the low temperatures involved minimize the degrading reactions which normally occur in ordinary drying processes. However, freeze-drying is an expensive form of dehydration for foods because of the slow drying rate and the use of vacuum.")
59
Since the vapor pressure of ice is very small, freeze-drying requires very low pressures or high vacuum. If the water were in a pure state, freeze-drying at or near 0°C (273 K) at a pressure of 4580 µm (4.58 mm Hg abs) could be performed. (See Appendix A.2 for the properties of ice.) However, since the water usually exists in a solution or a combined state, the material must be cooled below 0 C to keep the water in the solid phase. Most freeze-drying is done at -10°C (263 K) or lower at pressures of about 2000 µm or less.
 at a pressure of 4580 µm (4.58 mm Hg abs) could be performed. (See Appendix A.2 for the properties of ice.) However, since the water usually exists in a solution or a combined state, the material must be cooled below 0 C to keep the water in the solid phase. Most freeze-drying is done at -10°C (263 K) or lower at pressures of about 2000 µm or less.")
61
Unsteady-State thermal Processing and Sterilization of Biological Materials
It is necessary to use certain processing methods to preserve biological materials, especially foods. Physical and chemical processing methods of preservation, such as drying, smoking, salting, chilling, freezing, and heating, are commonly used. An important method is heat or thermal processing, whereby contaminating microorganisms that occur primarily on the outer surface of foods and cause spoilage and health problems are destroyed. This leads to longer storage times for food and other biological materials. A common method of preservation is to heat-seal cans of food. Likewise, thermal processing is used to sterilize aqueous fermentation media to be used in fermentation processes so that organisms that do not survive are unable to compete with the organism that is to be cultured.

62
The sterilization of food materials by heating destroys bacteria, yeast. molds, and so on, which cause spoilage, and also destroys pathogenic (disease-producing) organisms that may produce deadly toxins if not destroyed. The rate of destruction of microorganisms varies with the amount of heating and the type of organism. Some bacteria can exist in a vegetative growing form and in a dormant or spore form. For foods, it is necessary to kill essentially all the spores of Clostridium botulinum, which produces a toxin that is a deadly poison. Complete sterility with respect to this spore is the purpose of thermal processing.

63
Temperature has a great effect on the growth rate of microorganisms.
Each organism has a certain optimal temperature range in which it grows best. If any microorganism is heated to a sufficiently high temperature for a sufficient time, it will be rendered sterile or killed.

64
Pasteurization Pasteurization - apply a mild heat treatment of foods that is less drastic than sterilization. It is used to kill organisms that are relatively low in thermal resistance compared to those which the more drastic sterilization processes are designed to eliminate. Pasteurization usually involves killing vegetative microorganisms and not heat-resistant spores. The most common process is the pasteurization of milk to kill Mycobacterium tuberculosis. This pasteurization does not sterilize the milk but kills the M. tuberculosis and reduces the other bacterial count sufficiently so that the milk can be stored if refrigerated.

65
Effects of Thermal Processing on Food Constituents
Thermal processing causes undesirable effects, such as the reduction of certain nutritional values. Ascorbic acid (vitamin C), thiamin and riboflavin (vitamins B1 and B2) are partially destroyed by thermal processing.
, thiamin and riboflavin (vitamins B1 and B2) are partially destroyed by thermal processing.")
Similar presentations


>")


 Energy absorbed Energy released Solid (Ice) melting evaporation deposition freezing.>")


Mechanically: By presses or centrifuges,>")


