Download presentation
Presentation is loading. Please wait.

1
Spatial Analysis Using Grids GIS in Water Resources Fall 2014
by Ayse Kilic with materials from David G. Tarboton, Utah State University and from ESRI software

2
Spatial Analysis Using Grids
Learning Objectives Continuous surfaces or spatial fields representation of geographical information Grid data structure for representing numerical and categorical data Map algebra raster calculations Interpolation Calculate slope on a raster using ArcGIS method based in finite differences D8 steepest single flow direction D steepest outward slope on grid centered triangular facets

3
Readings – at http://resources.arcgis.com/en/help/
Raster and Images, starting from "Introduction/What is raster data" to end of " Fundamentals of raster data/Rasters with functions"

4
Readings – at http://resources.arcgis.com/
What is the ArcGIS Spatial Analyst extension and Essential ArcGIS Spatial Analyst extension vocabulary

5
Two fundamental ways of representing geography are discrete (separated) objects and fields.
The discrete object view represents the real world as objects with well defined boundaries in empty space. (x1,y1) Points Lines Polygons The field view represents the real world as a finite number of variables, each one defined at each possible position. DRM x y f(x,y) Continuous surface
 Points. Lines. Polygons. The field view represents the real world as a finite number of variables, each one defined at each possible position. DRM. x. y. f(x,y) Continuous surface.")
6
Numerical representation of a spatial surface (field)
Grid or Raster TIN Contour and flowline Elevation and contours are overlaid on the upper right figure. Fields can represent any number of two or three dimensional surfaces (any kind of gridded data)
")
7
Discrete (vector) and continuous (raster) data
Discrete is also called thematic, categorical, or discontinuous data Continuous Continuous House, stream, lake are separate units in discrete view (each is an object) Continuous- defined everywhere and usually an equal gridded spacing. Just tells us the value for a pixels. Discrete Images from
 Continuous- defined everywhere and usually an equal gridded spacing. Just tells us the value for a pixels. Discrete. Images from")
8
Raster and Vector Data Vector Raster Point Line Polygon
Raster data are described by a cell grid, one value per cell Vector Raster Point Line DRM Zone of cells Polygon

9
Line as a Sequence of Cells
How do we define a line (stream) using grid cells?
 using grid cells")
10
Polygon as Zone of Grid Cells
When we use grid cells, we have to break down polygon shapes like lakes into individual grid cells We start on the left with a accurate picture of well-defined boundaries and we end up with a pixelated view on the right

11
Raster and Vector are two methods of representing geographic data in GIS
Both represent different ways to encode and generalize geographic phenomena Both can be used to code both fields and discrete objects In practice a strong association between raster and fields and vector and discrete objects DRM

12
A grid defines geographic space as a mesh of identically-sized square cells. Each cell holds a numeric value that measures a geographic attribute (like elevation) for that unit of space. 549 542 538 534 528 522 518 512 548 541 536 530 524 515 511 558 551 532 525 519 571 559 544 537 514 585 583 576 563 505 606 593 578 546 513 497 612 600 584 568 550 533 516 611 586 498 601 592 580 565 545 508 594 577 570 560 547 521 614 605 597 588 575 527 622 603 595 620 610 582 554 627 616 604 574 564 631 618 572 566 557 628 591 552 602 561 617 590 573 562 613 567 579 553 569 Elevation (meter) for part of Upper Klamath Basin, OR
 for part of Upper Klamath Basin, OR.")
13
The grid values There are two types of grids: integer and floating point Use integer grids to represent discrete data (land use classes) Use floating-point grids to represent continuous data (elevation) Grids may have associated attribute table Attribute tables describe overall characteristics for the entire grid
 Grids may have associated attribute table. Attribute tables describe overall characteristics for the entire grid.")
14
The grid Grid is defined by extent, spacing, and perhaps a no data value Extent is the Number of rows, Number of columns Top-left and bottom-right coordinates Spacing is the Cell size (X and Y) NODATA is outside the extent or is undefined Number of Columns Number of rows (X,Y) NODATA cell Cell size
 NODATA is outside the extent or is undefined. Number of Columns. Number. of. rows. (X,Y) NODATA cell. Cell size.")
15
NODATA Cells

16
Networks Using Cells The same number identifies cells that are in the same reach

17
Grids Using Floating Point (Decimal Numbers)
Continuous data surfaces using floating point or decimal numbers Examples are ET (evapotranspiration), elevation, precipitation
, elevation, precipitation.")
18
Integer valued grids to represent zones
Examples are Landuse classes, soil types, political units

19
Value Attribute Table (VAT) to summarize categorical (integer) grid data
Attributes of grid zones

20
How are values for Rasters determined?
There are three ways that a “Value” for a grid cell is determined from Michael F. Goodchild. (1997) Rasters, NCGIA Core Curriculum in GIScience, posted October 23, 1997
 Rasters, NCGIA Core Curriculum in GIScience, posted October 23,")
21
Cell size of raster data
The level of detail (of features/phenomena) represented by a raster is dependent on the cell size. (Cell size matters!!!) Estimates of area Discrete data If you use 1 meter cell, the area for polygon (count the number) is 73 of them If you use 4 meter cell, the area for polygon (there are 5 cells) is 80 m2. The cell must be small enough to capture the required detail but large enough so computer storage and analysis can be performed efficiently.
 represented by a raster is dependent on the cell size. (Cell size matters!!!) Estimates of area. Discrete data. If you use 1 meter cell, the area for polygon (count the number) is 73 of them. If you use 4 meter cell, the area for polygon (there are 5 cells) is 80 m2. The cell must be small enough to capture the required detail but large enough so computer storage and analysis can be performed efficiently.")
22
Integer Raster Generalization How do we determine the value for the cell?
Largest share rule Central point rule Central point rule- Look at the center of pixel and take that value Whatever is happening at the center Winner takes it all!

23
Map Algebra/Raster Calculation
Example Precipitation - Losses (Evaporation + Infiltration) = Runoff 5 2 3 4 7 6 - = Cell by cell evaluation of mathematical functions 5-3= 2
 = Runoff = Cell by cell evaluation of mathematical functions. 5-3= 2.")
24
Runoff generation processes
Infiltration excess overland flow aka Horton overland flow P P f P qo f Partial area infiltration excess overland flow P P P qo f Delete or skip this slide. P Saturation excess overland flow P P qo qr qs

25
Runoff generation at a point depends on
Rainfall intensity or amount Antecedent moisture conditions Soils and vegetation type Depth to water table (topography) Time scale of interest These factors vary spatially. That suggests using a spatial approach (GIS) to runoff estimation
 Time scale of interest. These factors vary spatially. That suggests using a spatial approach (GIS) to runoff estimation.")
26
Cell based generation of runoff and routing discharge
Radar Precipitation grid Soil and land use grid Runoff grid from raster-based calculations implementing runoff generation formulas We use a DEM to show accumulation and routing of runoff within watersheds

27
Raster calculation – some complications
Sometimes different layers have different: Cell size Extent Projection We need to tell Arc how to combine these data layers. We may need to reproject, and resample to a common cell size. +

28
Raster calculation – some complications
An Analysis Mask is used to tell Arc how to resample or interpolate (and reproject) inputs to the target extent, cell size, and projection + = Analysis mask (Domain) Analysis cell size Analysis extent
 inputs to the target extent, cell size, and projection. + = Analysis mask (Domain) Analysis cell size. Analysis extent.")
29
Spatial Snowmelt Raster Calculation Example
40 50 55 43 47 41 44 42 100 m 150 m 4 6 2 4 Taking snow depth today Subtract what melted Find snow depth at next day

30
Lets Experiment with this in ArcGIS
snow.asc ncols nrows xllcorner 0 yllcorner 0 cellsize NODATA_value temp.asc ncols nrows xllcorner 0 yllcorner 0 cellsize NODATA_value 4 6 2 4

31
New depth calculation using Raster Calculator
“snow100” * “temp150”

32
Environment Settings Tell Arc how to resample or interpolate (and reproject) inputs to the target extent, cell size
 inputs to the target extent, cell size.")
33
Example and Pixel Inspector
![]()
34
The Result for Snow Depth on Day 2
Outputs are on 150 m grid. How were values obtained ? 38 52 41 39

35
When input layers have different cell sizes
When we have two different input cell sizes, we have to specify one of them for the output cell size. If you specify using the layer having the maximum cell size, then the input layers having the smaller cell size will be resampled. The default resampling in Arc uses Nearest Neighbor 40 50 55 43 47 41 44 42 100 m The NN resampling grabs the input cell that is closest to the center of the output cell 38 52 4 2 6 150 m Nearest Neighbor Resampling with Cellsize Maximum of Inputs There are 9 of 100 m cells Only 4 of them will be selected for the calculations (because we use NN) 150 m 41 39 Output raster See next slide
 150 m Output raster. See next slide.")
36
Nearest Neighbor (NN) Resampling using Cell size based on “Maximum of Inputs”
The NN resampling grabs the input cell that is closest to the center of the output cell Red symbols are centers of the 150 m cells 40 50 55 43 47 41 44 42 100 m 40 55 Nearest Neighbor Resampling with Cellsize Maximum of Inputs 42 41 Resampling the 100 meter input to 150 meters using NN There are Nine 100 m cells . Only 4 of them will be selected for the calculations (because we use NN). Note that some spatial information is lost during resampling.
. Note that some spatial information is lost during resampling.")
37
Nearest Neighbor (NN) Resampling using Cell size based on “Maximum of Inputs”
Now we can make calculations with all the inputs and outputs at 150 meter 40 55 40-0.5*4 = 38 55-0.5*6 = 52 38 52 42 41 42-0.5*2 = 41 4 2 6 150 m Nearest Neighbor Resampling with Cellsize Maximum of Inputs 41-0.5*4 = 39 41 39 However, only 4 of original snow depths were utilized because we use NN.

38
Nearest Neighbor (NN) Resampling using Cell size based on “Maximum of Inputs”
We could have combined the resampling and calculations into one step as shown here (this is what Arc Does) 40 50 55 43 47 41 44 42 100 m Red symbols are centers of the 150 m cells 40-0.5*4 = 38 55-0.5*6 = 52 38 52 42-0.5*2 = 41 4 2 6 150 m Nearest Neighbor Resampling with Cellsize Maximum of Inputs 41-0.5*4 = 39 41 39 There are Nine 100 m cells Only 4 of them will be selected for the calculations (because we use NN)
 m. Red symbols are centers of the 150 m cells *4 = *6 = *2 = m. Nearest Neighbor Resampling with Cellsize Maximum of Inputs *4 = There are Nine 100 m cells. Only 4 of them will be selected for the calculations (because we use NN)")
39
Cell size and sampling frequency need to agree with the behavior of our data
We need to sample more frequently to capture high frequency changes We need to sample a longer series to capture the full data extent If we are interested in behavior of the process (i.e. solar radiation), we need to sample frequently enough 2) You don’t even know that there is a valley because you did not sample a larger extent/area 3) Too large of a cell size to sample, you miss the resolution. For example, sampling temperature of center pivot field using MODIS From: Blöschl, G., (1996), Scale and Scaling in Hydrology, Habilitationsschrift, Weiner Mitteilungen Wasser Abwasser Gewasser, Wien, 346 p. We need to use a smaller cell size to capture the full range of values
, we need to sample frequently enough. 2) You don’t even know that there is a valley because you did not sample a larger extent/area. 3) Too large of a cell size to sample, you miss the resolution. For example, sampling temperature of center pivot field using MODIS. From: Blöschl, G., (1996), Scale and Scaling in Hydrology, Habilitationsschrift, Weiner Mitteilungen Wasser Abwasser Gewasser, Wien, 346 p. We need to use a smaller cell size to capture the full range of values.")
40
Interpolation and Resampling
Estimate values between known values A set of spatial analyst functions that predict values for a surface from a limited number of sample points creating a continuous raster. Apparent improvement in resolution may not be justified

41
Interpolation methods
Nearest neighbor Inverse distance weight Bilinear interpolation Kriging (best linear unbiased estimator) Spline Cubic convolution Known data points are large red circles Bilinear : points on the left, right, below, above. 5 points Cubic convolution: Uses 8 points Nearest Neignor (gets the values from the closets old cell). (For resampling only)
 Spline. Cubic convolution. Known data points are large red circles. Bilinear : points on the left, right, below, above. 5 points. Cubic convolution: Uses 8 points. Nearest Neignor (gets the values from the closets old cell). (For resampling only)")
42
Resampling Methods in Arc

43
Resample 150 m to 100 m to get consistent cell size
Spacing & Support Lets redo the calculations at 100 m resolution 4 6 2 5 3 Black values are original The white values are resampled

44
Calculation with consistent 100 m cell size grid
“snow100” * “temp100” 38 52 41 39 47.5 40.5 42.5 45

45
Cell by cell snowmelt calculations using 100 m cell size
40 50 55 43 47 41 44 42 100 m 40-0.5*4 = 38 50-0.5*5 = 47.5 55-0.5*6 = 52 42-0.5*3 = 40.5 38 47.5 52 47-0.5*4 = 45 43-0.5*5 = 40.5 40.5 45 40.5 42-0.5*2 = 41 4 5 6 44-0.5*3 = 42.5 150 m 39 41 42.5 4 6 41-0.5*4 = 39 3 4 5 2 4 Two inputs on the left have the same 100 m resolution 2 3 4

46
Illustration of different Interpolation techniques
When you have to create a grid from a limited set of data points

47
Nearest Neighbor “Thiessen” Polygon Interpolation
Point to Raster Interpolation Spline Interpolation Nearest Neighbor “Thiessen” Polygon Interpolation

48
Interpolation Comparison
Thin plate spline Thiessen Inverse Distance Squared Kriging (zero nugget, large range) Sixth order polynomial Kriging (different nugget and range paramters) Grayson, R. and G. Blöschl, ed. (2000)
 Sixth order polynomial. Kriging (different nugget and range paramters) Grayson, R. and G. Blöschl, ed. (2000)")
49
Further Reading Grayson, R. and G. Blöschl, ed. (2000), Spatial Patterns in Catchment Hydrology: Observations and Modelling, Cambridge University Press, Cambridge, 432 p. Chapter 2. Spatial Observations and Interpolation Full text online at:
, Spatial Patterns in Catchment Hydrology: Observations and Modelling, Cambridge University Press, Cambridge, 432 p. Chapter 2. Spatial Observations and Interpolation. Full text online at:")
50
Spatial Surfaces used in Hydrology
Elevation Surface — the ground surface elevation at each point

51
Slope Handout Determine the length, slope and azimuth of the line AB.
Determine the length, slope and azimuth of the line AB.

52
3-D detail of the Tongue river at the WY/Montana border from LIDAR.
Roberto Gutierrez University of Texas at Austin

53
Topographic Slope Used to determine how water flows downhill and concentrates into streams Topographic slope can be determined from a DEM

54
Topographic Slope There are three alternative sets of inputs (choose one) Surface derivative z (dz/dx, dz/dy) Vector with x and y components (Sx, Sy). Slope in x and y direction. Vector with magnitude (slope) and direction (aspect) (S, )
. Slope in x and y direction. Vector with magnitude (slope) and direction (aspect) (S, )")
55
ArcGIS “Slope” tool Calculates the maximum rate of change in value from that cell to its neighbors Calculated for each cell Represents the rate of change of elevation for each digital elevation model (DEM) cell. It's the first derivative of a DEM The lower the slope value, the flatter the terrain; the higher the slope value, the steeper the terrain.
 cell. It s the first derivative of a DEM. The lower the slope value, the flatter the terrain; the higher the slope value, the steeper the terrain.")
56
Definition of X, Y, and Z in 3D space
Z axis is the direction that elevation changes (up or down) Origin is the location of the point of interest (pixel or grid cell) Y axis is the direction that Y has a changing value (North-South in ArcGIS) Fundamentally, to describe earth surface, you have to define, x, y and z As a definition, x and y go in the horizontal direction Z is the vertical direction. In Arc, y goes north and south In arc, x goes east and west I am at Chase Hall and looking at my office at Hardin Hall. I am looking towards South West. X axis is the direction that X has a changing value (East-West in ArcGIS) X, and Y are horizontal distances Z is the vertical distance The X, Y, Z axes are at right angles to one another
 Origin is the location of the point of interest (pixel or grid cell) Y axis is the direction that Y has a changing value (North-South in ArcGIS) Fundamentally, to describe earth surface, you have to define, x, y and z. As a definition, x and y go in the horizontal direction. Z is the vertical direction. In Arc, y goes north and south. In arc, x goes east and west. I am at Chase Hall and looking at my office at Hardin Hall. I am looking towards South West. X axis is the direction that X has a changing value (East-West in ArcGIS) X, and Y are horizontal distances. Z is the vertical distance. The X, Y, Z axes are at right angles to one another.")
57
Definition of Slope 𝑆𝑙𝑜𝑝𝑒 𝑖𝑛 𝑑𝑒𝑔𝑟𝑒𝑒𝑠(𝛳)= 𝑅𝑖𝑠𝑒 𝑅𝑢𝑛 (0)
𝑆𝑙𝑜𝑝𝑒 𝑖𝑛 𝑑𝑒𝑔𝑟𝑒𝑒𝑠(𝛳)= 𝑅𝑖𝑠𝑒 𝑅𝑢𝑛 (0) 𝑇𝑎𝑛 (𝛳)= 𝑅𝑖𝑠𝑒 𝑅𝑢𝑛 𝑃𝑒𝑟𝑐𝑒𝑛𝑡 𝑜𝑓 𝑆𝑙𝑜𝑝𝑒(𝛳)= 𝑅𝑖𝑠𝑒 𝑅𝑢𝑛 * 100 (%) Run is the horizontal distance calculated using X and Y Rise is the vertical distance calculated using Z (elevation) Slope ranges (-900, +900) or (-infinity %, +infinity %) The side of the house (the wall) have infinite slope because run = 0.
= 𝑅𝑖𝑠𝑒 𝑅𝑢𝑛 (0) 𝑇𝑎𝑛 (𝛳)= 𝑅𝑖𝑠𝑒 𝑅𝑢𝑛. 𝑃𝑒𝑟𝑐𝑒𝑛𝑡 𝑜𝑓 𝑆𝑙𝑜𝑝𝑒(𝛳)= 𝑅𝑖𝑠𝑒 𝑅𝑢𝑛 * 100 (%) Run is the horizontal distance calculated using X and Y. Rise is the vertical distance calculated using Z (elevation) Slope ranges (-900, +900) or (-infinity %, +infinity %) The side of the house (the wall) have infinite slope because run = 0.")
58
How Slope works 𝑆𝑙𝑜𝑝𝑒(𝛳)= 𝑅𝑖𝑠𝑒 𝑅𝑢𝑛 (0) 𝑆𝑙𝑜𝑝𝑒(𝛳)= 𝑅𝑖𝑠𝑒 𝑅𝑢𝑛 * 100 (%)
𝑆𝑙𝑜𝑝𝑒(𝛳)= 𝑅𝑖𝑠𝑒 𝑅𝑢𝑛 (0) 𝑆𝑙𝑜𝑝𝑒(𝛳)= 𝑅𝑖𝑠𝑒 𝑅𝑢𝑛 * 100 (%) When the angle (𝛳) is 45 degrees, the rise is equal to the run, and the percent rise is 100 percent When the slope angle (𝛳 ) approaches vertical (90 degrees), the percent rise (slope) begins to approach infinity. The side of the house (the wall) have infinite slope because run = 0. Run is the horizontal distance calculated using X and Y Rise is the vertical distance calculated using Z (elevation)
= 𝑅𝑖𝑠𝑒 𝑅𝑢𝑛 (0) 𝑆𝑙𝑜𝑝𝑒(𝛳)= 𝑅𝑖𝑠𝑒 𝑅𝑢𝑛 * 100 (%) When the angle (𝛳) is 45 degrees, the rise is equal to the run, and the percent rise is 100 percent. When the slope angle (𝛳 ) approaches vertical (90 degrees), the percent rise (slope) begins to approach infinity. The side of the house (the wall) have infinite slope because run = 0. Run is the horizontal distance calculated using X and Y. Rise is the vertical distance calculated using Z (elevation)")
59
Pythagorean theorem Used to calculate Run where a =ΔY and b = ΔX
Pi-te-garian

60
Definition of Aspect If I pour water on the ground, which direction does it flow? Identifies the direction where slope is maximum (slope is the steepest) Aspect identifies the downslope direction of the maximum rate of change in value from each cell to its neighbors Δ𝑥 Δ𝑦 𝛼 𝛼 = aspect, angle defined as degrees clockwise from North 𝑥 𝑦 Y axis is the direction that Y has a changing value (North-South in ArcGIS) I am standing on a hill, which direction looks the steepest. Aspect of my driveway is North East. If you go from top of the drive way to the bottom of drive way, you change location by delta X and delta y. Can’t see elevation here anymore because you are looking down. X axis is the direction that X has a changing value (East-West in ArcGIS) This is my grid cell location
 Aspect identifies the downslope direction of the maximum rate of change in value from each cell to its neighbors. Δ𝑥. Δ𝑦. 𝛼. 𝛼 = aspect, angle defined as degrees clockwise from North. 𝑥. 𝑦. Y axis is the direction that Y has a changing value (North-South in ArcGIS) I am standing on a hill, which direction looks the steepest. Aspect of my driveway is North East. If you go from top of the drive way to the bottom of drive way, you change location by delta X and delta y. Can’t see elevation here anymore because you are looking down. X axis is the direction that X has a changing value (East-West in ArcGIS) This is my grid cell location.")
61
Definition of Aspect 𝑇𝑎𝑛 (𝛼)= ∆𝑋 ∆𝑌 𝛼=𝐴𝑟𝑐𝑇𝑎𝑛 ∆𝑋 ∆𝑌 = Aspect
Invert that top equation and solve for α by Inverting the Tangent Function (ArcTan) 𝑇𝑎𝑛 (𝛼)= ∆𝑋 ∆𝑌 Δ𝑥 Δ𝑦 𝛼 𝛼 = aspect, angle defined as degrees clockwise from North 𝑥 𝑦 𝛼=𝐴𝑟𝑐𝑇𝑎𝑛 ∆𝑋 ∆𝑌 = Aspect The other way to write ArcTan is Tan-1 Convert from radians to degrees (180/π) Aspect =
 𝑇𝑎𝑛 (𝛼)= ∆𝑋 ∆𝑌. Δ𝑥. Δ𝑦. 𝛼. 𝛼 = aspect, angle defined as degrees clockwise from North. 𝑥. 𝑦. 𝛼=𝐴𝑟𝑐𝑇𝑎𝑛 ∆𝑋 ∆𝑌 = Aspect. The other way to write ArcTan is Tan-1. Convert from radians to degrees (180/π) Aspect =")
62
ArcGIS “Slope” tool g d a h e b i f c y
Calculates slope for each cell. In this illustration, it is for Cell “e” For each cell, the Slope tool calculates the maximum of the rate of change in value from that cell to each of its eight neighbors a b c d e f g h i The rate of change in the x direction for cell e is calculated with the following algorithm dz dx = a+2d+g − c+2f+i 8∆ x The rate of change in the y direction for cell e is calculated with the following algorithm dz dy = g+2h+i − a+2b+c 8∆ g d a h e b i f c ∆ 2∆ x y

63
ArcGIS “Slope” tool dz dx = g d a h e b i f c
The two equations for dz/dx and dz/dy are simplified from this first equation. The basis for that equation is illustrated in the Figure and represents an average of central finite differences over each of the three rows of cells, with the middle row counting twice as it appears in averages on each side. 𝑎−𝑐 2∆ + 𝑑−𝑓 2∆ 𝑑−𝑓 2∆ + 𝑔−𝑖 2∆ 2 2 dz dx = g d a h e b i f c ∆ 𝑎−𝑐 2∆ 𝑑−𝑓 2∆ 𝑔−𝑖 2∆ 2∆ x y dz dx = a+2d+g − c+2f+i 8∆ dz dy = g+2h+i − a+2b+c 8∆

64
ArcGIS Aspect – the steepest downslope direction
In Arc, with grid cells it is easiest to calculate Aspect using the ratio of dz/dx to dz/dy. We use Arc tangent function to determine the aspect angle. 𝛼

65
Example for topographic slope
30 80 74 63 69 67 56 60 52 48 a b c d e f g h i Mesh spacing=30 m Slope/Aspect at cell e? 145.2o Slope in degrees

66
Example for Aspect 30 80 74 63 69 67 56 60 52 48 a b c d e f g h i
Mesh spacing=30 m Slope/Aspect at cell e? 145.2o

67
The Atan function is multivalued on the full circle and only unique in a range of 180 degrees. To unambiguously determine the direction from two components you really need the atan2 function that keeps the sign on y and x components separately. Specifically, let y = y component of a vector x = x component of a vector atan(x/y) gives the direction of the vector as an angle (with the ratio x/y since angle here is measured from north). But x/y is the same value if y is positive and x negative, or x positive and y negative. So once you take the ratio x/y, if you get a negative number you do not know which (y or x) was negative. A way to resolve this is angle = atan(x/y) if(0 < angle < 180 and x < 0) then aspect = angle + 180 # flip the direction because x is negative if angle is in positive x direction else aspect = angle endif
 was negative. A way to resolve this is angle = atan(x/y) if(0 < angle < 180 and x < 0) then aspect = angle # flip the direction because x is negative if angle is in positive x direction else aspect = angle endif.")
68
D8 steepest single flow direction (Eight Direction Pour Point Model)
In a gridded system, water can only flow to one of eight adjacent cells 32 16 8 64 4 128 1 2 The direction of flow is determined by the direction of steepest descent: Maximum_drop = change_in_z-value / distance * 100 ESRI Direction encoding (ArcGIS)
")
69
Slope: Slope: Hydrologic Slope (Flow Direction Tool)
Find Direction of Steepest Descent (ArcGIS) 80 74 63 69 67 56 60 52 48 30 80 74 63 69 67 56 60 52 48 30 Hydrologic Slope (Flow Direction Tool) Slope: Slope: For diagonal direction, the denominator for slope includes square root of 2
 Hydrologic Slope (Flow Direction Tool) Slope: Slope: For diagonal direction, the denominator for slope includes square root of 2.")
70
Limitation due to 8 grid directions.
? The true flow direction follows the red arrow. However, we can only choose one of the blue arrows because we have to use one of eight adjacent cells.

71
The D Algorithm Tarboton, D. G., (1997), "A New Method for the Determination of Flow Directions and Contributing Areas in Grid Digital Elevation Models," Water Resources Research, 33(2): ) (
, A New Method for the Determination of Flow Directions and Contributing Areas in Grid Digital Elevation Models, Water Resources Research, 33(2): ) (")
72
The D Algorithm If 1 does not fit within the triangle, the angle is chosen along the steepest edge or diagonal resulting in a slope and direction equivalent to D8

73
D∞ Example 30 284.9o 80 74 63 69 67 56 60 52 48 eo 14.9o e7 e8 The tool is available at

74
ArcGIS.Com ready to use maps including elevation services
Elevation Land Cover Soils

75
Elevation Services

76
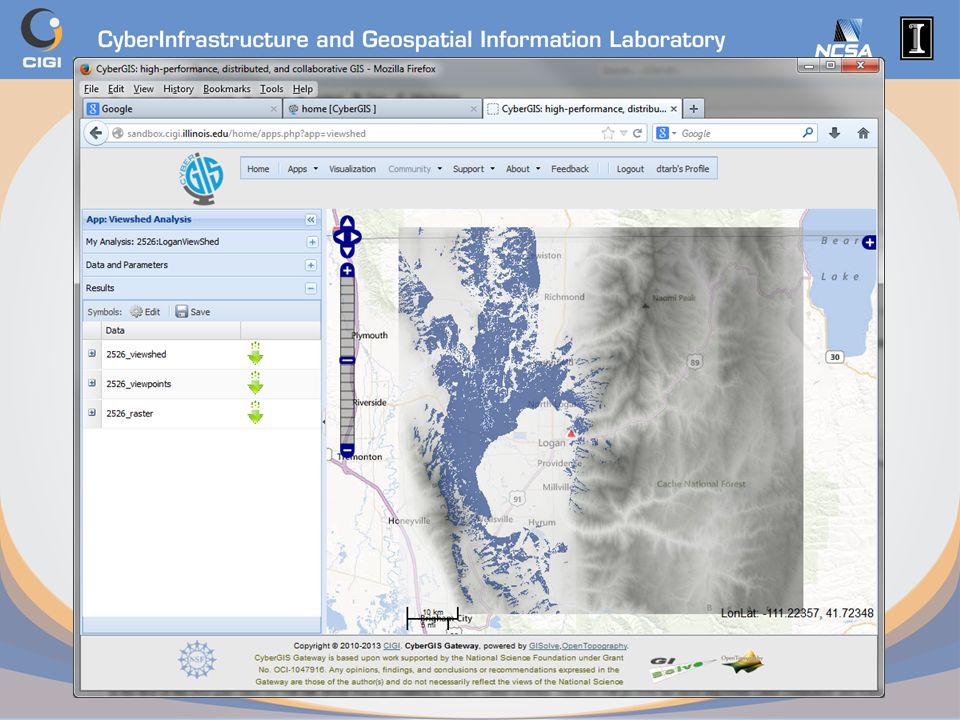
CyberGIS Apps

77
Big Spatial Data

78
A YouTube Video

79
Viewshed The locations that are visible from a viewer location. Line of sight analysis. Useful for cell coverage and visual exposure analyses From

81
Summary Concepts Grid (raster) data structures represent surfaces as an array of grid cells Raster calculation involves algebraic like operations on grids Interpolation and Generalization is an inherent part of the raster data representation

82
Summary Concepts (2) The elevation surface represented by a grid digital elevation model is used to derive slope important for surface flow The eight direction pour point model approximates the surface flow using eight discrete grid directions. The D vector surface flow model approximates the surface flow as a flow vector from each grid cell apportioned between down slope grid cells.

Similar presentations


 Raster calculation of wetness index Raster.>")
? A GIS is a particular form of Information System applied to geographical.>")


 Slope and aspect are calculated at each point in the grid, by comparing.>")