Download presentation
Presentation is loading. Please wait.

1
Shaun Purcell & Pak Sham Advanced Workshop Boulder, CO, 2003
Power calculation for QTL association (discrete and quantitative traits) Shaun Purcell & Pak Sham Advanced Workshop Boulder, CO, 2003
 Shaun Purcell & Pak Sham. Advanced Workshop. Boulder, CO,")
2
Discrete Threshold Quantitative Case-control Case-control Variance
components Aff UnAff A n1 n2 a n3 n4 High Low A n1 n2 a n3 n4 TDT TDT Tr UnTr A n1 n2 a n3 n4 Tr UnTr A n1 n2 a n3 n4

3
Discrete trait calculation
p Frequency of high-risk allele K Prevalence of disease RAA Genotypic relative risk for AA genotype RAa Genotypic relative risk for Aa genotype N, , Sample size, Type I & II error rate

4
Risk is P(D|G) gAA = RAA gaa gAa = RAa gaa
K = p2 gAA + 2pq gAa + q2 gaa gaa = K / ( p2 RAA + 2pq RAa + q2 ) Odds ratios (e.g. for AA genotype) = gAA / (1- gAA ) gaa / (1- gaa )
 Odds ratios (e.g. for AA genotype) = gAA / (1- gAA ) gaa / (1- gaa )")
5
Need to calculate P(G|D)
Expected proportion d of genotypes in cases dAA = gAA p2 / (gAAp2 + gAa2pq + gaaq2 ) dAa = gAa 2pq / (gAAp2 + gAa2pq + gaaq2 ) daa = gaa q2 / (gAAp2 + gAa2pq + gaaq2 ) Expected number of A alleles for cases 2NCase ( dAA + dAa / 2 ) Expected proportion c of genotypes in controls cAA = (1-gAA) p2 / ( (1-gAA) p2 + (1-gAa) 2pq + (1-gaa) q2 )
 dAa = gAa 2pq / (gAAp2 + gAa2pq + gaaq2 ) daa = gaa q2 / (gAAp2 + gAa2pq + gaaq2 ) Expected number of A alleles for cases. 2NCase ( dAA + dAa / 2 ) Expected proportion c of genotypes in controls. cAA = (1-gAA) p2 / ( (1-gAA) p2 + (1-gAa) 2pq + (1-gaa) q2 )")
6
Full contingency table
“A” allele “a” allele Case 2NCase ( dAA + dAa / 2 ) 2NCase ( daa + dAa / 2 ) Control 2NControl ( cAA + cAa / 2 ) 2NControl ( caa + cAa / 2 )
 2NCase ( daa + dAa / 2 ) Control 2NControl ( cAA + cAa / 2 ) 2NControl ( caa + cAa / 2 )")
7
Threshold selection Genotype AA Aa aa Frequency q2 2pq p2
Trait mean -a d a Trait variance 2 2 2

8
P(X) = GP(X|G)P(G) P(X) Aa aa AA X
 = GP(X|G)P(G) P(X) Aa aa AA X")
9
P(G|X<T) = P(X<T|G)P(G) / P(X<T)
Nb. the cumulative standard normal distribution gives the area under the curve, P(X < T) Aa T AA X
 Aa. T. AA. X.")
10
Incomplete LD Effect of incomplete LD between QTL and marker A a
M pm1 + δ qm1 - δ m pm2 – δ qm2 + δ δ = D’ × DMAX DMAX = min{pm2 , qm1} Note that linkage disequilibrium will depend on both D’ and QTL & marker allele frequencies

11
Incomplete LD Consider genotypic risks at marker:
P(D|MM) = [ (pm1+ δ)2 P(D|AA) + 2(pm1+ δ)(qm1- δ) P(D|Aa) + (qm1- δ)2 P(D|aa) ] / m12 Calculation proceeds as before, but at the marker Geno. Haplo. AAMM AM/AM AM/aM or aM/AM AaMM aaMM aM/aM MM
 = [ (pm1+ δ)2 P(D|AA) + 2(pm1+ δ)(qm1- δ) P(D|Aa) + (qm1- δ)2 P(D|aa) ] / m12. Calculation proceeds as before, but at the marker. Geno. Haplo. AAMM. AM/AM. AM/aM. or. aM/AM. AaMM. aaMM. aM/aM. MM.")
12
Discrete TDT calculation
Calculate probability of parental mating type given affected offspring Calculate probability of offspring genotype given parental mating type and affected Calculate overall probability of heterozygous parents transmitting allele A as opposed to a Calculate TDT test statistic, power

13
Fulker association model
The genotypic score (1,0,-1) for sibling i is decomposed into between and within components: sibship genotypic mean deviation from sibship genotypic mean
 for sibling i is. decomposed into between and within components: sibship. genotypic mean. deviation from sibship. genotypic mean.")
14
NCPs of B and W tests Approximation for between test
Approximation for within test Sham et al (2000) AJHG 66
 AJHG 66.")
15
Practical Exercise Calculation of power for simple case-control study.
DATA : frequency of risk factor in 30 cases and 30 controls TEST : 2-by-2 contingency table : chi-squared (1 degree of freedom)
")
16
Step 1 : determine expected chi-squared
Hypothetical risk factor frequencies Case Control A allele present A allele absent Chi-squared statistic = 6.666

17
P(T) Critical value T Step 2. Determine the critical value for a given
type I error rate, - inverse central chi-squared distribution P(T) Critical value T
 Critical value. T.")
18
Step 3. Determine the power for a given critical value
and non-centrality parameter - non-central chi-squared distribution P(T) Critical value T
 Critical value. T.")
19
Calculating Power 1. Calculate critical value (Inverse central 2)
Alpha 0 (under the null) 2. Calculate power (Non-central 2) Crit. value Expected NCP
 2. Calculate power (Non-central 2) Crit. value. Expected NCP.")
20
df = 1 , NCP = 0 X 0.05 0.01 0.001

21
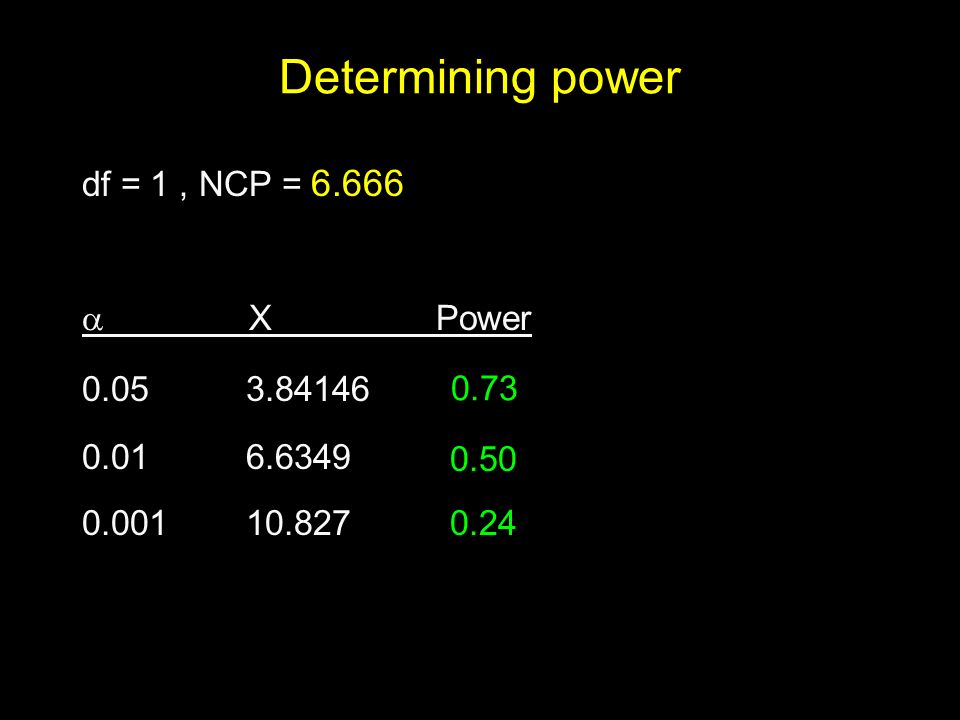
Determining power df = 1 , NCP = 6.666 X Power 0.05 3.84146
0.73 0.50 0.24
22
1. Planning a study Candidate gene study
A disease occurs in 2% of the population Assume multiplicative model genotype risk ratio Aa = 2 genotype risk ratio AA = 4 100 cases, 100 controls What if the risk allele is rare vs common?

23
2. Interpreting a negative result
Negative candidate gene TDT study, 82 affected offspring trios “affection” = scoring >2 SD above mean candidate gene SNP allele frequency 0.25 Desired 80% power, 5% type I error rate What is the minimum detectable QTL variance (assume additivity)?
")
24
Planning a study p N cases (=N controls) 0.01 1144 0.05 247 0.2 83

25
Interpreting a negative result
QTL Power

26
Exploring power of association using GPC
Linkage versus association difference in required sample sizes for specific QTL size TDT versus case-control difference in efficiency? Quantitative versus binary traits loss of power from artificial dichotomisation?

27
Linkage versus association
QTL linkage: 500 sib pairs, r=0.5 QTL association: 1000 individuals

28
Case-control versus TDT
p = 0.1; RAA = RAa = 2

29
Quantitative versus discrete
K=0.05 K=0.2 K=0.5 To investigate: use threshold-based association Fixed QTL effect (additive, 5%, p=0.5) 500 individuals For prevalence K Group 1 has N and T Group 2 has N and T
 500 individuals. For prevalence K. Group 1 has N and T. Group 2 has N and T.")
30
Quantitative versus discrete
K T (SD)
")
31
Quantitative versus discrete

32
Incomplete LD what is the impact of D’ values less than 1? does allele frequency affect the power of the test? (using discrete case-control calculator) Family-based VC association: between and within tests what is the impact of sibship size? sibling correlation? (using QTL VC association calculator)
 Family-based VC association: between and within tests. what is the impact of sibship size sibling correlation (using QTL VC association calculator)")
33
Incomplete LD Case-control for discrete traits Disease K = 0.1
QTL RAA = RAa = 2 p = 0.05 Marker1 m = D’ = { 1, 0.8, 0.6, 0.4, 0.2, 0} Marker2 m = D’ = { 1, 0.8, 0.6, 0.4, 0.2, 0} Sample 250 cases, 250 controls

34
Incomplete LD Genotypic risk at marker1 (left) and marker2 (right) as a function of D’
 and marker2 (right) as a function of D’")
35
Incomplete LD Expected likelihood ratio test as a function of D’

36
Family-based association
Sibship type 1200 individuals, 600 pairs, 400 trios, 300 quads Sibling correlation r = 0.2, 0.5, 0.8 QTL (diallelic, equal allele frequency) 2%, 10% of trait variance
 2%, 10% of trait variance.")
37
Family-based association
NCP proportional to variance explained Between test ↓ with ↑ sibship size and ↑ sibling correlation Within test 0 for s=1, ↑ with ↑ sibship size and ↑ sibling correlation

38
Between-sibship association

39
Within-sibship association

40
Total association

41
GPC Usual URL for GPC http://statgen.iop.kcl.ac.uk/gpc/
Purcell S, Cherny SS, Sham PC. (2003) Genetic Power Calculator: design of linkage and association genetic mapping studies of complex traits. Bioinformatics, 19(1):149-50
 Genetic Power Calculator: design of linkage and association genetic mapping studies of complex traits. Bioinformatics, 19(1):")
Similar presentations


 association? How do we test for association? When to use association.>")


 Test of Variance.>")


