Download presentation
Presentation is loading. Please wait.

1
ENVIRONMENTAL SCIENCE 13e CHAPTER 13: Energy

2
Core Case Study: Amory Lovins and the Rocky Mountain Institute (1) 1984: home and office building in Snowmass, CO Heat: –Sun –Heavy roof insulation –Thick stone walls –Energy-efficient windows –Waste-heat recovery
 1984: home and office building in Snowmass, CO Heat: –Sun –Heavy roof insulation –Thick stone walls –Energy-efficient windows –Waste-heat recovery")
3
Core Case Study: Amory Lovins and the Rocky Mountain Institute (2) Sun –99% of heat and hot water –95% of daytime lighting –90% of household electricity Energy-efficient electrical appliances and computers Rocky Mountain Institute –Promotes energy-efficient buildings and transportation
 Sun –99% of heat and hot water –95% of daytime lighting –90% of household electricity Energy-efficient electrical appliances and computers Rocky Mountain Institute –Promotes energy-efficient buildings and transportation")
4
Fig. 13-1, p. 296

5
13-1 What Major Sources of Energy Do We Use? Concept 13-1A About three-quarters of the world’s commercial energy comes from nonrenewable fossil fuels, and the rest comes from nonrenewable nuclear fuel and renewable sources. Concept 13-1B Net energy is the amount of high-quality energy available from a resource minus the amount of energy needed to make it available.

6
What do we need to consider when evaluating energy resources?

7
Evaluating Energy Resources The supply The environmental impact How much net useful energy they provide

8
Fig. 13-2, p. 298 Commercial energy use by source What can be said about renewable vs non-renewable?

9
Science Focus: Net Energy It takes energy get energy. What steps are involved in the oil industry that require energy? Second law of thermodynamics (what happens to the energy at each step?) Net energy: The usable amount of high quality energy available from a given quantity of an energy resource minus the energy needed to find, extract, process, and get that energy to consumers Net energy ratio Ex. Nuclear fuel cycle, how much energy we get out vs how much energy we put in
 Net energy: The usable amount of high quality energy available from a given quantity of an energy resource minus the energy needed to find, extract, process, and get that energy to consumers Net energy ratio Ex. Nuclear fuel cycle, how much energy we get out vs how much energy we put in.")
10
13-2 What Are the Advantages and Disadvantages of Fossil Fuels? Concept 13-2 Oil, natural gas, and coal are currently abundant and relatively inexpensive, but using them causes air and water pollution, degrades large areas of land, and releases greenhouse gases to the atmosphere.

11
Dependence on Oil (1) Petroleum (crude oil) –Also called light oil –Trapped underground or under ocean with natural gas –Fossil fuels Extraction –U.S. peak production –Global peak production: the point in time when we reach the maximum overall rate of crude oil production for the whole world. Once we pass this point, what will happen to global oil production?

12
Dependence on Oil (2) Transportation Refining Petrochemicals
 Transportation Refining Petrochemicals")
13
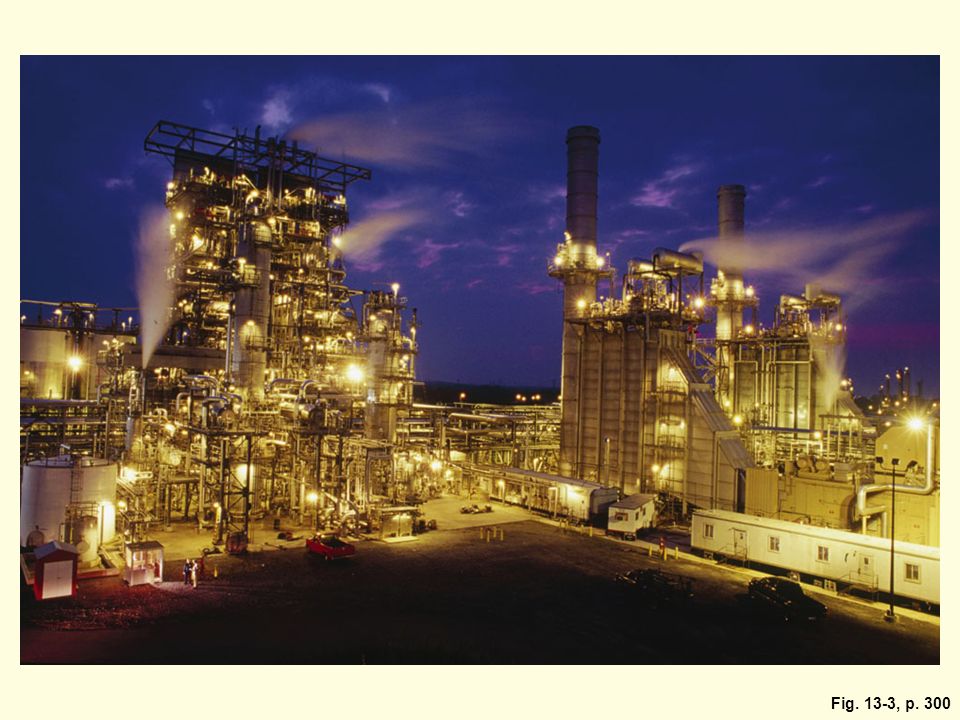
Asphalt Gases Lowest Boiling Point Highest Boiling Point Gasoline Aviation fuel Heating oil Diesel oil Heated crude oil Furnace Naphtha Grease and wax Fig. 13-3, p. 300

15
Supplement 9, Fig. 3, p. S40

16
How Long Will Crude Oil Supplies Last? Crude oil is the single largest source of commercial energy in world and U.S.

17
How Long Will Crude Oil Supplies Last? Crude oil is the single largest source of commercial energy in world and U.S. Proven oil reserves –Identified deposits that can be extracted profitably at today’s prices with today’s technology

18
How Long Will Crude Oil Supplies Last? Crude oil is the single largest source of commercial energy in world and U.S. Proven oil reserves –Identified deposits that can be extracted profitably at today’s prices with today’s technology –Geologists predict known and projected global reserves of crude oil will be 80% depleted between 2050 and 2100 depending on consumption rates

19
What are our options?

20
Look for more oil Use and waste less oil Use other energy options Yes, yes, and yes!

21
Fig. 13-4, p. 301 2050 Year Barrels of oil per year (billions) 0 1 2 3 4 5 6 7 8 9 10 11 12 13 14 Projected U.S. oil consumption Arctic refuge oil output over 50 years 20002010202020302040
 Projected U.S. oil consumption Arctic refuge oil output over 50 years")
22
*United States Oil Production and Use (1) U.S. –93% of energy from fossil fuels –39% from crude oil –Produces 9% of world’s crude oil –Uses 25% of world production –Has 2% of proven crude oil reserves

23
United States Oil Production and Use (2) Domestic oil production –Off-shore drilling –Alaska Future U.S. production Consumption versus production Oil imports –2008: imported 58% of crude oil

24
Fig. 13-5, p. 301 Disadvantages Need to find substitutes within 50 years Large government subsidies Environmental costs not included in market price Artificially low price encourages waste and discourages search for alternatives Pollutes air when produced and burned Releases CO 2 when burned Can cause water pollution Ample supply for 42–93 years Low cost High net energy yield Easily transported within and between countries Low land use Technology is well developed Efficient distribution system Trade-Offs Conventional Oil Advantages

25
Oil Sand Oil sand ( tar sand ): mixture of clay, water and bitumen Bitumen : thick, sticky, tar like heavy oil with high sulfur content Northeastern Alberta in Canada has ¾ world’s tar sands resources Under boreal forest Huge environmental cost
: mixture of clay, water and bitumen Bitumen : thick, sticky, tar like heavy oil with high sulfur content Northeastern Alberta in Canada has ¾ world’s tar sands resources Under boreal forest Huge environmental cost")
26
Tar sands http://www.good.is/post/think-nuclear- or-coal-is-bad-tar-sands-mining-is- coming-to-utah/http://www.good.is/post/think-nuclear- or-coal-is-bad-tar-sands-mining-is- coming-to-utah/ http://www.youtube.com/watch?v=Yk woRivP17A&feature=relatedhttp://www.youtube.com/watch?v=Yk woRivP17A&feature=related

27
Oil shale Contain kerogen Shale Oil About 72% of world’s estimated oil shale reserves buries in government owed land in US states of Colorado, Wyoming, and Utah in Green River formation What are the problems? Low net energy, requires huge amount of water to produce (Colorado River System), severe water pollution, air pollution, CO2 emission …
, severe water pollution, air pollution, CO2 emission ….")
28
Fig. 13-6, p. 303

29
Fig. 13-7, p. 303 Heavy Oils from Oil Shale and Tar Sand High cost (oil shale) Low net energy yield Environmental costs not included in market price Large amounts of water needed for processing Severe land disruption Severe water pollution Air pollution and CO 2 emissions when produced and burned Technology well-developed (tar sand) Efficient distribution system in place Easily transported within and between countries Large potential supplies, especially tar sands in Canada Moderate cost (tar sand) Trade-Offs AdvantagesDisadvantages
 Low net energy yield Environmental costs not included in market price Large amounts of water needed for processing Severe land disruption Severe water pollution Air pollution and CO 2 emissions when produced and burned Technology well-developed (tar sand) Efficient distribution system in place Easily transported within and between countries Large potential supplies, especially tar sands in Canada Moderate cost (tar sand) Trade-Offs AdvantagesDisadvantages.")
30
Natural Gas Is a Useful and Clean-burning Fossil Fuel (1) Natural gas Conventional natural gas Unconventional natural gas Liquefied petroleum gas (LPG) Less carbon dioxide emitted per unit of energy than with crude oil, tar sand, shale oil
 Natural gas Conventional natural gas Unconventional natural gas Liquefied petroleum gas (LPG) Less carbon dioxide emitted per unit of energy than with crude oil, tar sand, shale oil")
31
Natural Gas Is a Useful and Clean-burning Fossil Fuel (2) Liquefied natural gas (LNG) World supply of conventional natural gas – 62-125 years Unconventional natural gas –Coal-bed methane gas –Methane hydrate
 Liquefied natural gas (LNG) World supply of conventional natural gas – years Unconventional natural gas –Coal-bed methane gas –Methane hydrate")
32
Fig. 13-8, p. 304 Conventional Natural Gas Nonrenewable resource Releases CO 2 when burned Government subsidies Environmental costs not included in market price Methane (a greenhouse gas) can leak from pipelines Difficult to transfer from one country to another Can be shipped across ocean only as highly explosive LNG Ample supplies High net energy yield Low cost Less air pollution than other fossil fuels Lower CO 2 emissions than other fossil fuels Easily transported by pipeline Low land use Good fuel for fuel cells, gas turbines, and motor vehicles Trade-Offs Advantages Disadvantages
 can leak from pipelines Difficult to transfer from one country to another Can be shipped across ocean only as highly explosive LNG Ample supplies High net energy yield Low cost Less air pollution than other fossil fuels Lower CO 2 emissions than other fossil fuels Easily transported by pipeline Low land use Good fuel for fuel cells, gas turbines, and motor vehicles Trade-Offs Advantages Disadvantages.")
33
Coal Is a Plentiful But Dirty Fuel (1) Used in electricity production World’s most abundant fossil fuel U.S. reserves should last about 250 years Sulfur and particulate pollutants Mercury and radioactive pollutants

34
Coal Is a Plentiful But Dirty Fuel (2) Heavy carbon dioxide emissions Pollution control and environmental costs China major builder of coal plants
 Heavy carbon dioxide emissions Pollution control and environmental costs China major builder of coal plants")
35
Highly desirable fuel because of its high heat content and low sulfur content; supplies are limited in most areas Extensively used as a fuel because of its high heat content and large supplies; normally has a high sulfur content Low heat content; low sulfur content; limited supplies in most areas Partially decayed plant matter in swamps and bogs; low heat content Peat (not a coal) Lignite (brown coal) Bituminous (soft coal) Increasing heat and carbon content Increasing moisture content Heat Pressure Anthracite (hard coal) Fig. 13-9, p. 305

36
Stack Waste heat Cooling tower transfers waste heat to atmosphere Pulverizing mill TurbineCoal bunker Generator Cooling loop Condenser Boiler Filter Toxic ash disposal Fig. 13-10, p. 306 Coal burning power plant

37
TVA Coal fired power plant http://www.tva.com/power/coalart.htm http://www.newsweek.com/photo/2009/07/ 21/photos--the-worst-man-made- environmental-disasters.htmlhttp://www.newsweek.com/photo/2009/07/ 21/photos--the-worst-man-made- environmental-disasters.html

38
Fig. 13-10, p. 306

39
Coal-fired electricity 286% Synthetic oil and gas produced from coal 150% Coal100% Tar sand92% Oil86% Natural gas58% Nuclear power fuel cycle 17% Geothermal 10% Stepped Art Fig. 13-11, p. 306 CO2 Emissions per unit of electrical energy

40
Fig. 13-12, p. 307 Disadvantages Severe land disturbance, air pollution, and water pollution Severe threat to human health when burned Environmental costs not included in market price Large government subsidies High CO 2 emissions when produced and burned Radioactive particle and toxic mercury emissions Air pollution can be reduced with improved technology Well-developed technology Low cost High net energy yield Ample supplies (225–900 years) Trade-Offs Coal Advantages
 Trade-Offs Coal Advantages.")
41
Case Study: The Growing Problem of Coal Ash Highly toxic Often stored in ponds –Ponds can rupture Groundwater contamination EPA: in 2009 called for classifying coal ash as hazardous waste –Opposed by coal companies

42
TVA coal ash spill http://earthfirst.com/americas-top-10- worst-man-made-environmental-disasters/http://earthfirst.com/americas-top-10- worst-man-made-environmental-disasters/

43
Clean Coal Campaign Coal industry –Rich and powerful –Fought against labeling carbon dioxide a greenhouse gas “Clean coal” touted by coal industry –Mining harms the environment –Burning creates carbon dioxide and toxic chemicals Plan to capture and store carbon dioxide

44
Converting Coal into Gaseous and Liquid Fuels Synfuels Coal gasification –Synthetic natural gas (SNG) Coal liquefaction –Methanol or synthetic gasoline Extracting and burning coal more cleanly
 Coal liquefaction –Methanol or synthetic gasoline Extracting and burning coal more cleanly")
45
Fig. 13-13, p. 309 Disadvantages Low to moderate net energy yield Higher cost than coal Requires mining 50% more coal Environmental costs not included in market price High environmental impact Large government subsidies High water use Higher CO 2 emissions than coal Large potential supply Vehicle fuel Moderate cost Lower air pollution than coal when burned Trade-Offs Synthetic Fuels Advantages

46
13-3 What Are the Advantages and Disadvantages of Nuclear Energy? Concept 13-3 The nuclear power fuel cycle has a low environmental impact and a very low accident risk, but its use has been limited because of high costs, a low net energy yield, long-lived radioactive wastes, vulnerability to sabotage, and the potential for spreading nuclear weapons technology.

47
How Does a Nuclear Fission Reactor Work? Nuclear fission Light-water reactors Boil water to produce steam to turn turbines to generate electricity Radioactive uranium as fuel Control rods, coolant, and containment vessels

48
TVA http://www.tva.gov/power/nuclear/watt sbar_howworks.htmhttp://www.tva.gov/power/nuclear/watt sbar_howworks.htm http://www.tvakids.com/videos/pressu rized_water_animation.htmhttp://www.tvakids.com/videos/pressu rized_water_animation.htm

49
Cool water input Small amounts of radioactive gases Periodic removal and storage of radioactive wastes and spent fuel assemblies Periodic removal and storage of radioactive liquid wastes Control rods Heat exchanger Containment shell Steam Water Uranium fuel input (reactor core) Hot coolant Coolant Moderator Coolant passage Shielding Waste heat Water source (river, lake, ocean) Useful electrical energy About 25% GeneratorTurbine Hot water output Condenser Pressure vessel Fig. 13-14, p. 310 Pump Waste heat Pump

50
Fig. 13-14, p. 310

51
Safety and Radioactive Wastes On-site storage of radioactive wastes Safety features of nuclear power plants Nuclear fuel cycle Reactor life cycle Large amounts of very radioactive wastes

52
Fig. 13-15, p. 311

54
Fuel assemblies Fuel fabrication Enrichment of UF 6 Temporary storage of spent fuel assemblies underwater or in dry casks Low-level radiation with long half-life Geologic disposal of moderate and high-level radioactive wastes (conversion of enriched UF 6 to UO 2 and fabrication of fuel assemblies) Uranium-235 as UF6 Plutonium- 239 as PuO 2 Decommissioning of reactor Reactor Spent fuel reprocessing Conversion of U 3 O 8 to UF 6 Fig. 13-16, p. 312 Open fuel cycle today Recycling of nuclear fuel Mining uranium ore (U 3 O 8 ) Nuclear Fuel Cycle
 Nuclear Fuel Cycle.")
55
What Happened to Nuclear Power? Optimism of 1950s is gone Comparatively expensive source of power No new plants in U.S. since 1978 Disposing of nuclear waste is difficult Three Mile Island (1979)
.")
57
Japan’s Nuclear Disaster http://www.guardian.co.uk/world/video/201 1/mar/14/japan-tsunami-amateur-footage- videohttp://www.guardian.co.uk/world/video/201 1/mar/14/japan-tsunami-amateur-footage- video

58
Case Study: Chernobyl Disaster Ukraine (1986) Explosions and partial meltdown Huge radioactive release to atmosphere Estimated death toll: 9,000–212,000 Radioactive fallout and long-term health effects Lesson – worldwide consequences
 Explosions and partial meltdown Huge radioactive release to atmosphere Estimated death toll: 9,000–212,000 Radioactive fallout and long-term health effects Lesson – worldwide consequences")
59
Fig. 13-17, p. 313 Conventional Nuclear Fuel Cycle Cannot compete economically without huge government subsidies Low net energy yield High environmental impact (with major accidents) Environmental costs not included in market price Risk of catastrophic accidents No widely acceptable solution for long-term storage of radioactive wastes Subject to terrorist attacks Spreads knowledge and technology for building nuclear weapons Large fuel supply Low environmental impact (without accidents) Emits 1/6 as much CO 2 as coal Moderate land disruption and water pollution (without accidents) Moderate land use Low risk of accidents because of multiple safety systems (except for Chernobyl-type reactors) Trade-Offs Disadvantages Advantages
 Environmental costs not included in market price Risk of catastrophic accidents No widely acceptable solution for long-term storage of radioactive wastes Subject to terrorist attacks Spreads knowledge and technology for building nuclear weapons Large fuel supply Low environmental impact (without accidents) Emits 1/6 as much CO 2 as coal Moderate land disruption and water pollution (without accidents) Moderate land use Low risk of accidents because of multiple safety systems (except for Chernobyl-type reactors) Trade-Offs Disadvantages Advantages.")
60
Fig. 13-18, p. 314 Coal vs. Nuclear Ample supply of uranium Low net energy yield Low air pollution Lower CO 2 emissions Much lower land disruption from surface mining Moderate land use High cost (even with huge subsidies) Ample supply High net energy yield Very high air pollution High CO 2 emissions High land disruption from surface mining High land use Low cost (with huge subsidies) CoalNuclear Trade-Offs
 Ample supply High net energy yield Very high air pollution High CO 2 emissions High land disruption from surface mining High land use Low cost (with huge subsidies) CoalNuclear Trade-Offs.")
61
Nuclear Power Is Vulnerable to Terrorist Acts Insufficient security On-site storage facilities U.S.: 161 million people live within 75 miles of an above-ground nuclear storage site

62
Dealing with Radioactive Wastes High-level radioactive wastes Long-term storage: 10,000–240,000 years Deep burial Detoxify wastes?

63
Case Study: Dealing with Radioactive Wastes in the United States Yucca Mountain, Nevada Concerns over groundwater contamination Possible seismic activity Transportation accidents and terrorism 2009: Obama ends Yucca funding

64
What Do We Do with Worn-Out Nuclear Power Plants? Decommissioning old nuclear power plants Dismantle power plant and store materials Install physical barriers Entomb entire plant

65
What Is the Future for Nuclear Power? Reduce dependence on foreign oil Reduce global warming Advanced light-water reactors Nuclear fusion How to develop relatively safe nuclear power with a high net energy yield?

66
13-4 Why Is Energy Efficiency an Important Energy Source? Concept 13-4 The United States could save as much as 43% of all the energy it uses by improving the energy efficiency of industrial operations, motor vehicles, and buildings.

67
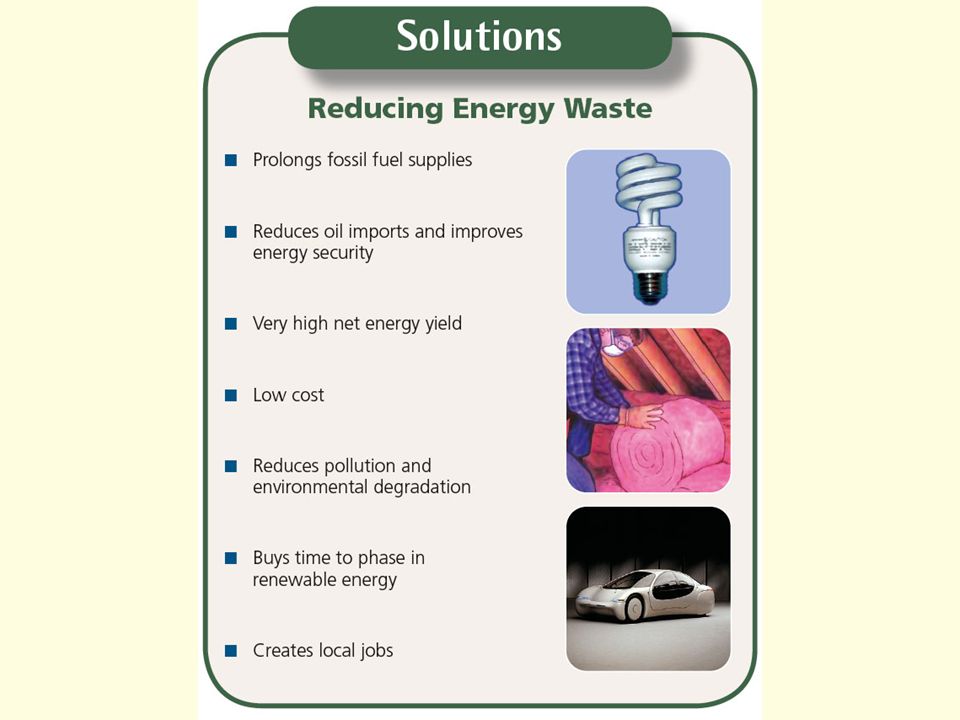
Improving Energy Efficiency Energy efficiency –How much work we get from each unit of energy we use Reducing energy waste –41% of all commercial energy in U.S. is wasted unnecessarily Numerous economic and environmental advantages

68
OutputsSystemEnergy Inputs 43% 7% 9% 3% 4% 41% 85% 8% U.S. economy Fig. 13-19, p. 319 Nonrenewable fossil fuels Nonrenewable nuclear Hydropower, geothermal, Wind, solar Biomasss Useful energy Petrochemicals Unavoidable energy waste Unnecessary energy

69
Examples of Energy-Wasting Devices Incandescent light bulb Internal combustion engine Nuclear power plants Coal-burning power plants

71
Saving Energy and Money in Industry Cogeneration/Combined Heat and Power (CHP) systems Recycling Energy-saving electric motors Fluorescent lighting Smart grid electricity
 systems Recycling Energy-saving electric motors Fluorescent lighting Smart grid electricity")
72
Saving Energy and Money in Transportation 2/3 of U.S. oil consumption Low fuel-efficiency standards for vehicles Hidden costs: $12/gallon of gas Raise gasoline taxes/cut payroll and income taxes Tax breaks for fuel-efficient vehicles

73
Hybrid and Fuel-Cell Cars Super-efficient and ultralight cars Gasoline-electric hybrid car Plug-in hybrid electric car Hydrogen fuel cells Accessible mass-transit systems as alternative

74
Stepped Art Fig. 13-21, p. 320 25 Cars 20 Cars, trucks, and SUVs Trucks and SUVs 15 Average fuel economy (miles per gallon) 10 19751980 1985 1990199520002005 Year 50 45 Europe 40 Japan 35 China Miles per gallon (mpg) (converted to U.S. test equivalents) 30 Canada 25 United States 20 2002 20042006 2008 Year
 Year Europe 40 Japan 35 China Miles per gallon (mpg) (converted to U.S. test equivalents) 30 Canada 25 United States Year.")
75
Stepped Art Conventional hybridFuel tank Battery Internal combustion engine TransmissionElectric motor Plug-in hybrid Fuel tank Battery Internal combustion engine Transmission Electric motor Fig. 13-22, p. 321

76
Saving Energy and Money in New Buildings Green architecture Solar cells, fuel cells, eco-roofs, recycled materials Super insulation Straw bale houses

77
Saving Energy in Existing Buildings Insulate and plug leaks Use energy-efficient windows Heat houses more efficiently Heat water more efficiently Use energy-efficient appliances Use energy-efficient lighting

78
Fig. 13-23, p. 322

79
Fig. 13-24, p. 324 Outside Plant deciduous trees to block summer sun and let in winter sunlight. Other rooms Use compact fluorescent lightbulbs or LEDs and avoid using incandescent bulbs wherever possible. Turn off lights, computers, TV, and other electronic devices when they are not in use. Use high efficiency windows; use insulating window covers and close them at night and on sunny, hot days. Set thermostat as low as you can in winter and as high as you can in summer. Weather-strip and caulk doors, windows, light fixtures, and wall sockets. Keep heating and cooling vents free of obstructions. Keep fireplace damper closed when not in use. Use fans instead of, or along with, air conditioning. Bathroom Install water-saving toilets, faucets, and shower heads. Repair water leaks promptly. Stepped Art Attic Hang reflective foil near roof to reflect heat. Use house fan. Be sure attic insulation is at least 30 centimeters (12 inches). Kitchen Use microwave rather than stove or oven as much as possible. Run only full loads in dishwasher and use low- or no-heat drying. Clean refrigerator coils regularly. Basement or utility room Use front-loading clothes washer. If possible run only full loads with warm or cold water. Hang clothes on racks for drying. Run only full loads in clothes dryer and use lower heat setting. Set water heater at 140° if dishwasher is used and 120° or lower if no dishwasher is used. Use water heater thermal blanket. Insulate exposed hot water pipes. Regularly clean or replace furnace filters.
. Kitchen Use microwave rather than stove or oven as much as possible. Run only full loads in dishwasher and use low- or no-heat drying. Clean refrigerator coils regularly. Basement or utility room Use front-loading clothes washer. If possible run only full loads with warm or cold water. Hang clothes on racks for drying. Run only full loads in clothes dryer and use lower heat setting. Set water heater at 140° if dishwasher is used and 120° or lower if no dishwasher is used. Use water heater thermal blanket. Insulate exposed hot water pipes. Regularly clean or replace furnace filters..")
80
Why Are We Still Wasting So Much Energy? Energy costs relatively little Lack of government support and economic incentives Inadequate building codes Inadequate appliance standards Lack of information about saving energy

81
13-5 What Are Advantages/Disadvantages of Renewable Energy Resources? Concept 13-5 Using a mix of renewable energy sources – especially sunlight, wind, flowing water, sustainable biomass, and geothermal energy – can drastically reduce pollution, greenhouse gas emissions, and biodiversity losses.

82
Renewable Energy Sustainability mostly depends on solar energy –Direct form: from the sun Indirect forms –Wind –Moving water –Biomass Geothermal

83
Benefits of Shifting to Renewable Energy Resources (1) More decentralized, less vulnerable Improve national security Reduce trade deficits Reduce air pollution
 More decentralized, less vulnerable Improve national security Reduce trade deficits Reduce air pollution")
84
Benefits of Shifting to Renewable Energy Resources (2) Create jobs Save money Renewable energy handicapped by –Unbalanced, intermittent subsidies –Inaccurate pricing
 Create jobs Save money Renewable energy handicapped by –Unbalanced, intermittent subsidies –Inaccurate pricing")
85
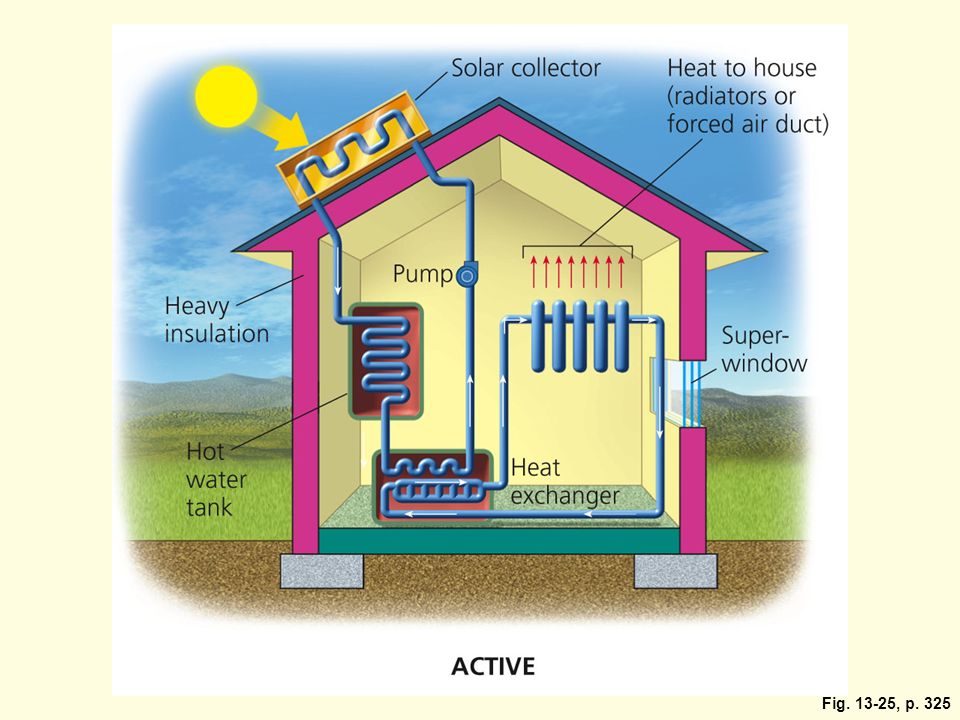
Using Solar Energy to Heat Buildings and Water Passive solar heating system Active solar heating system

86
Fig. 13-25, p. 325

88
PASSIVE Summer sun Winter sun Vent allows hot air to escape in summer Superwindow Stone floor and wall for heat storage Heavy insulation Fig. 13-25, p. 325

89
Supplement 9, Fig. 5, p. S41

90
Fig. 13-26, p. 326 Passive or Active Solar Heating Need access to sun 60% of time Sun can be blocked by trees and other structures Environmental costs not included in market price Need heat storage system High cost (active) Active system needs maintenance and repair Active collectors unattractive Energy is free Net energy is moderate (active) to high (passive) Quick installation No CO 2 emissions Very low air and water pollution Very low land disturbance (built into roof or windows) Moderate cost (passive) Advantages Disadvantages Trade-Offs
 Active system needs maintenance and repair Active collectors unattractive Energy is free Net energy is moderate (active) to high (passive) Quick installation No CO 2 emissions Very low air and water pollution Very low land disturbance (built into roof or windows) Moderate cost (passive) Advantages Disadvantages Trade-Offs.")
91
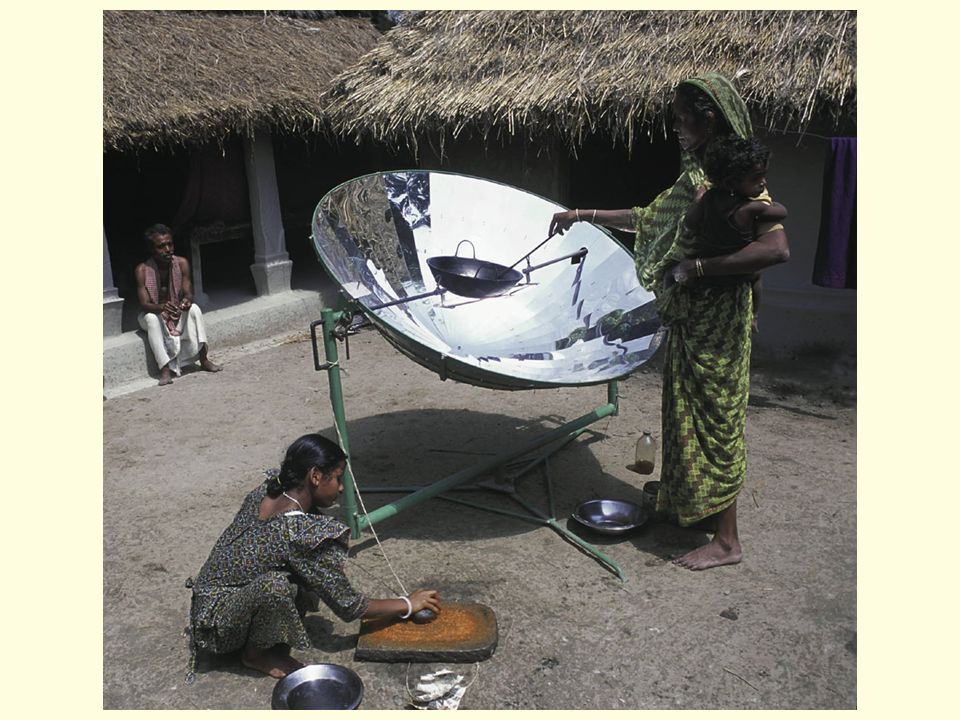
Solar Energy for High- Temperature Heat and Electricity Solar thermal systems Solar thermal plant Solar cookers Photovoltaic (solar) cells
 cells")
92
Fig. 13-27, p. 326 Trade-Offs Low efficiency Low net energy High costs Environmental costs not included in market price Needs backup or storage system Needs access to sun most of the time May disturb desert areas Costs reduced with natural gas turbine backup No CO 2 emissions Fast construction (1–2 years) Moderate environmental impact AdvantagesDisadvantages Solar Energy for High-Temperature Heat and Electricity
 Moderate environmental impact AdvantagesDisadvantages Solar Energy for High-Temperature Heat and Electricity.")
94
Boron- enriched silicon Phosphorus- enriched silicon Junction Single solar cell Solar-cell roof Panels of solar cells Solar shingles Roof options Fig. 13-29, p. 328

95
Fig. 13-30, p. 328

96
Fig. 13-31, p. 328 Solar Cells Need access to sun Low efficiency Need electricity storage system or backup Environmental costs not included in market price High costs (but should be competitive in 5–15 years) High land use (solar-cell power plants) could disrupt desert areas DC current must be converted to AC Reduces dependence on fossil fuels Low land use (if on roof or built into walls or windows) Last 20–40 years Low environmental impact No CO 2 emissions Easily expanded or moved Quick installation Work on cloudy days Fairly high net energy yield Trade-Offs DisadvantagesAdvantages
 High land use (solar-cell power plants) could disrupt desert areas DC current must be converted to AC Reduces dependence on fossil fuels Low land use (if on roof or built into walls or windows) Last 20–40 years Low environmental impact No CO 2 emissions Easily expanded or moved Quick installation Work on cloudy days Fairly high net energy yield Trade-Offs DisadvantagesAdvantages.")
97
Producing Electricity from Flowing Water Hydropower –Leading renewable energy source –Much unused capacity Dams and reservoirs –Turbines generate electricity –Eventually fill with silt Micro-hydro generators

98
Fig. 13-32, p. 329 Large-Scale Hydropower High construction costs High environmental impact from flooding land to form a reservoir Environmental costs not included in market price High CH 4 emissions from rapid biomass decay in shallow tropical reservoirs Danger of collapse Uproots people Decreases fish harvest below dam Decreases flow of natural fertilizer (silt) to land below dam Moderate to high net energy High efficiency (80%) Large untapped potential Low-cost electricity Long life span No CO 2 emissions during operation in temperate areas Can provide flood control below dam Provides irrigation water Reservoir useful for fishing and recreation DisadvantagesAdvantages Trade-Offs
 to land below dam Moderate to high net energy High efficiency (80%) Large untapped potential Low-cost electricity Long life span No CO 2 emissions during operation in temperate areas Can provide flood control below dam Provides irrigation water Reservoir useful for fishing and recreation DisadvantagesAdvantages Trade-Offs.")
99
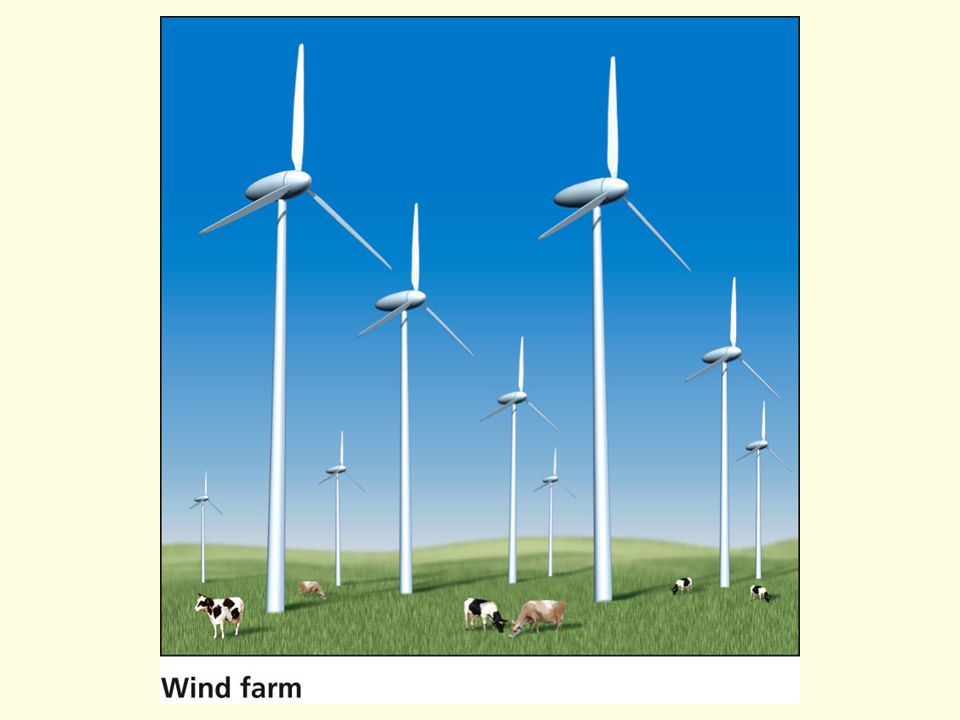
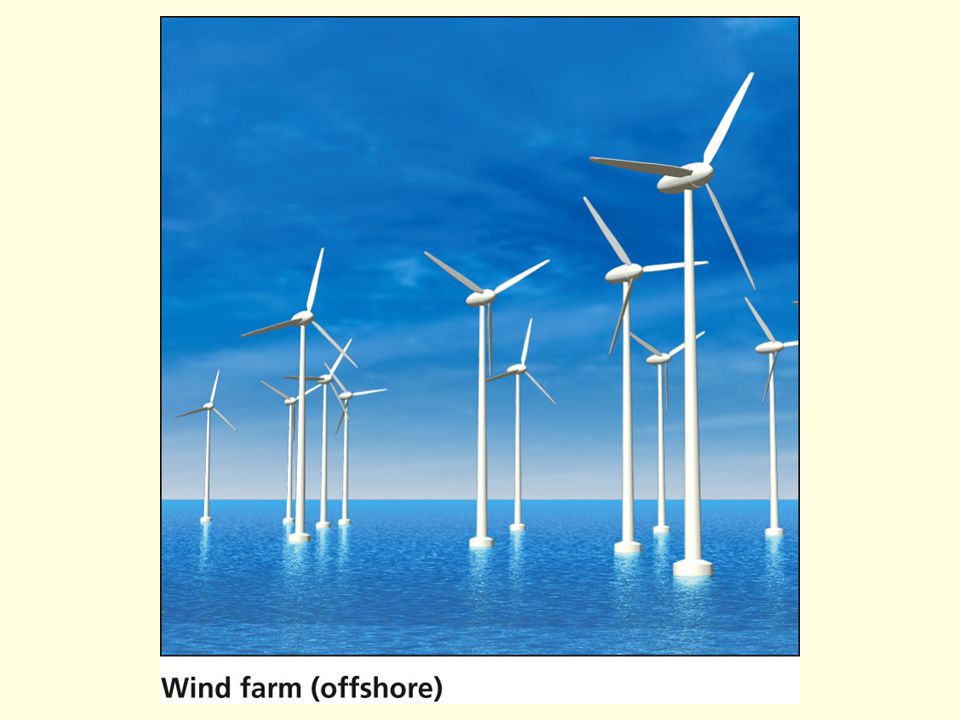
Producing Electricity from Wind Indirect form of solar energy World’s second fastest-growing source of energy Vast potential –Land –Offshore

103
Supplement 9, Fig. 8, p. S43

104
Fig. 13-34, p. 331 Trade-Offs Steady winds needed Backup systems needed when winds are low Plastic components produced from oil Environmental costs not included in market price High land use for wind farm Visual pollution Noise when located near populated areas Can kill birds and interfere with flights of migratory birds if not sited properly Moderate to high net energy yield High efficiency Moderate capital cost Low electricity cost (and falling) Very low environmental impact No CO 2 emissions Quick construction Easily expanded Can be located at sea Land below turbines can be used to grow crops or graze livestock Advantages Disadvantages Wind Power
 Very low environmental impact No CO 2 emissions Quick construction Easily expanded Can be located at sea Land below turbines can be used to grow crops or graze livestock Advantages Disadvantages Wind Power.")
105
Energy from Burning Biomass Biomass –Wood –Agricultural waste –Plantations –Charcoal –Animal manure Common in developing countries Carbon dioxide increase in atmosphere

106
Converting Plant Matter to Liquid Biofuel Biofuels –Ethanol and biodiesel –Crops can be grown in most countries –No net increase in carbon dioxide emissions –Available now Sustainability

107
Fig. 13-35, p. 333 Increased NO x emissions and more smog Higher cost than regular diesel Environmental costs not included in market price Low net energy yield for soybean crops May compete with growing food on cropland and raise food prices Loss and degradation of biodiversity from crop plantations Can make engines hard to start in cold weather Reduced CO emissions Reduced CO 2 emissions (78%) High net energy yield for oil palm crops Moderate net energy yield for rapeseed crops Reduced hydrocarbon emissions Better gas mileage (40%) Potentially renewable Trade-Offs AdvantagesDisadvantages Biodiesel
 High net energy yield for oil palm crops Moderate net energy yield for rapeseed crops Reduced hydrocarbon emissions Better gas mileage (40%) Potentially renewable Trade-Offs AdvantagesDisadvantages Biodiesel.")
108
Fig. 13-36, p. 334

109
Fig. 13-37, p. 335 Lower driving range Low net energy yield (corn) Higher CO 2 emissions (corn) Much higher cost Environmental costs not included in market price May compete with growing food and raise food prices Higher NO x emissions and more smog Corrosive Can make engines hard to start in cold weather High octane Some reduction in CO 2 emissions (sugarcane bagasse) High net energy yield (bagasse and switchgrass) Can be sold as a mixture of gasoline and ethanol or as pure ethanol Potentially renewable Trade-Offs AdvantagesDisadvantages Ethanol Fuel
 Higher CO 2 emissions (corn) Much higher cost Environmental costs not included in market price May compete with growing food and raise food prices Higher NO x emissions and more smog Corrosive Can make engines hard to start in cold weather High octane Some reduction in CO 2 emissions (sugarcane bagasse) High net energy yield (bagasse and switchgrass) Can be sold as a mixture of gasoline and ethanol or as pure ethanol Potentially renewable Trade-Offs AdvantagesDisadvantages Ethanol Fuel.")
110
http://articles.cnn.com/2008-04- 01/tech/algae.oil_1_algae-research-fossil- fuels-nrel?_s=PM:TECH

111
Energy by Tapping the Earth’s Internal Heat Geothermal energy Geothermal heat pumps Hydrothermal reservoirs –Steam –Hot water Deep geothermal energy

112
Supplement 9, Fig. 9, p. S43

113
Supplement 9, Fig. 10, p. S44

114
Fig. 13-38, p. 336 Very high efficiency Scarcity of suitable sites Can be depleted if used too rapidly Environmental costs not included in market price CO 2 emissions Moderate to high local air pollution Noise and odor (H 2 S) High cost except at the most concentrated and accessible sources Moderate environmental impact Low land use and disturbance Low cost at favorable sites Lower CO 2 emissions than fossil fuels Moderate net energy at accessible sites Trade-Offs AdvantagesDisadvantages Geothermal Energy
 High cost except at the most concentrated and accessible sources Moderate environmental impact Low land use and disturbance Low cost at favorable sites Lower CO 2 emissions than fossil fuels Moderate net energy at accessible sites Trade-Offs AdvantagesDisadvantages Geothermal Energy.")
115
Can Hydrogen Replace Oil? Hydrogen is environmentally friendly Problems –Most hydrogen is in water –Net energy yield is negative –Fuel is expensive –Air pollution depends on production method –Storage

116
Fig. 13-39, p. 337 Not found as H 2 in nature Energy is needed to produce fuel Negative net energy CO 2 emissions if produced from carbon-containing compounds Environmental costs not included in market price Nonrenewable if generated by fossil fuels or nuclear power High costs (that may eventually come down) Will take 25 to 50 years to phase in Short driving range for current fuel-cell cars No fuel distribution system in place Excessive H 2 leaks may deplete ozone in the atmosphere Can be produced from plentiful water Low environmental impact Renewable if produced from renewable energy resources No CO 2 emissions if produced from water Good substitute for oil Competitive price if environmental and social costs are included in cost comparisons Easier to store than electricity Safer than gasoline and natural gas Nontoxic High efficiency (45–65%) in fuel cells Trade-Offs AdvantagesDisadvantages Hydrogen Fuel cell
 Will take 25 to 50 years to phase in Short driving range for current fuel-cell cars No fuel distribution system in place Excessive H 2 leaks may deplete ozone in the atmosphere Can be produced from plentiful water Low environmental impact Renewable if produced from renewable energy resources No CO 2 emissions if produced from water Good substitute for oil Competitive price if environmental and social costs are included in cost comparisons Easier to store than electricity Safer than gasoline and natural gas Nontoxic High efficiency (45–65%) in fuel cells Trade-Offs AdvantagesDisadvantages Hydrogen Fuel cell.")
117
Science Focus: The Quest to Make Hydrogen Workable Bacteria and Algae Electricity from solar, wind, geothermal Storage: liquid and solid Preventing explosions

118
13-6 How Can We Make the Transition to a More Sustainable Energy Future? Concept 13-6 We can make a transition to a more sustainable energy future by greatly improving energy efficiency, using a mix of renewable energy resources, and including environmental costs of energy resources in their market prices.

119
Transition to a More Sustainable Energy Future (1) For each energy alternative: –How much available next 25-50 years? –Estimated net energy yield –Total costs –Necessary subsidies and tax breaks –How affect economic and military security –Vulnerability to terrorism –Environmental effects

120
Bioenergy power plants Smart electrical and distribution system Small solar-cell power plants Solar-cell rooftop systems Commercial Fuel cells Rooftop solar- cell arrays Residential Small wind turbine Stepped Art Industrial Microturbines Wind farm Fig. 13-40, p. 339 Decentralized Power System

121
Transition to a More Sustainable Energy Future (2) Gradual shift from centralized macropower to decentralized micropower Greatly improved energy efficiency Temporary use of natural gas Decrease environmental impact of fossil fuels
 Gradual shift from centralized macropower to decentralized micropower Greatly improved energy efficiency Temporary use of natural gas Decrease environmental impact of fossil fuels")
122
Fig. 13-41, p. 340 Increase fuel-efficiency standards for vehicles, buildings, and appliances Mandate government purchases of efficient vehicles and other devices Provide large tax credits or feebates for buying efficient cars, houses, and appliances Offer large tax credits for investments in energy efficiency Reward utilities for reducing demand for electricity Greatly increase energy efficiency research and development Improve Energy Efficiency Making the Transition to a More Sustainable Energy Future Solutions Phase out nuclear power subsidies, tax breaks, and loan guarantees More Renewable Energy Greatly increase use of renewable energy Provide large subsidies and tax credits for use of renewable energy Include environmental costs in prices for all energy resources Encourage government purchase of renewable energy Greatly increase renewable energy research and development Reduce Pollution and Health Risk Cut coal use 50% by 2020 Phase out coal subsidies and tax breaks Levy taxes on coal and oil use

123
Economic, Political, and Educational Strategies to Sustainable Energy Requires government strategies Keep prices low in selected resource to encourage use –Same strategy for fossil fuels and nuclear power Keep prices high in selected resource to discourage use Emphasize consumer education

124
Three Big Ideas from This Chapter - #1 Energy resources should be evaluated on the basis of their potential supplies, how much net useful energy they provide, and the environmental impact of using them.

125
Three Big Ideas from This Chapter - #2 Using a mix of renewable energy – especially sunlight, wind, flowing water, sustainable biofuels, and geothermal energy – can drastically reduce pollution, greenhouse gas emissions, and biodiversity losses.

126
Three Big Ideas from This Chapter - #3 Making the transition to a more sustainable energy future requires sharply reducing energy waste, using a mix of environmentally friendly renewable energy resources, and including the harmful environmental costs of energy resources in their market prices.

Similar presentations


. Where does our energy come from?>")


 1984: home and office building in Snowmass,>")
