Download presentation
Presentation is loading. Please wait.

1
Eric D. Stolen InoMedic Health Applications, Ecological Program, Kennedy Space Center, Florida NASA Environmental Management Branch

2
We h ve inv st d a l t of t m nd eff rt in cr at ng R, pl s c te it wh n us ng it f r d t n lys s.

3
We have invested a lot of time and effort in creating R, please cite it when using it for data analysis.

4
“The human understanding, once it has adopted an opinion, collects any instances that confirm it, and though the contrary instances may be more numerous and more weighty, it either does not notice them or else rejects them, in order that this opinion will remain unshaken.” - Francis Bacon (1620)
")
5
Science issues The method of multiple working hypotheses Statistical models as science tools Making inference in science Information-theoretic model selection Multi-model inference

6
What is it?

7
Science is the organized process of creating testable explanations of how the natural world works.

9
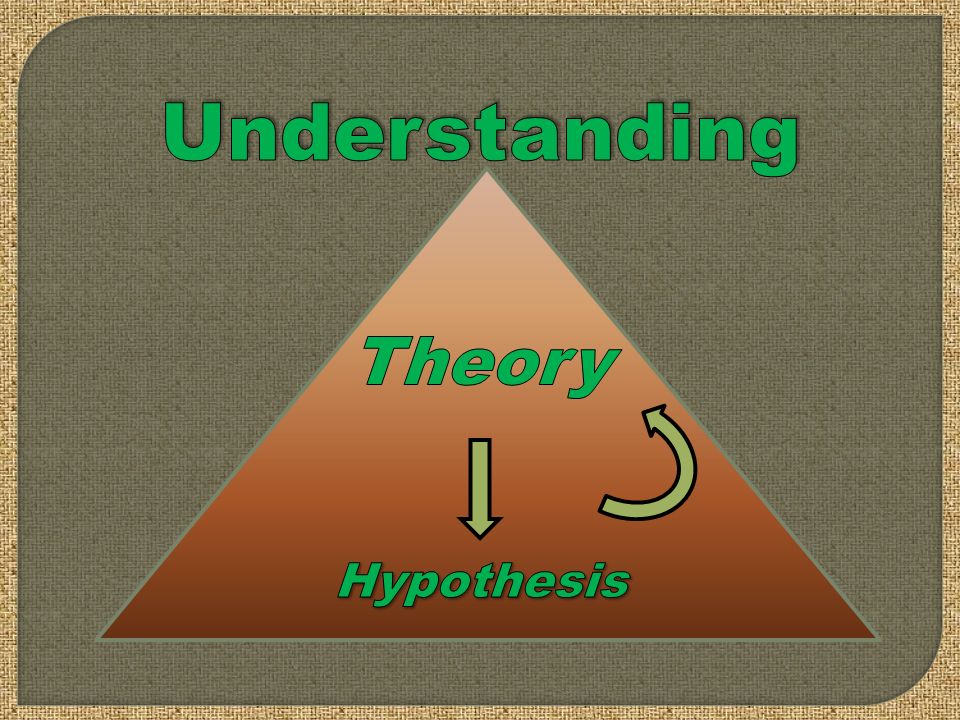
Generate hypothesis (from theory) Make a prediction from the hypothesis Conduct experiment to test prediction Decide whether or not the theory is supported
 Make a prediction from the hypothesis Conduct experiment to test prediction Decide whether or not the theory is supported")
10
Taught in Primary through graduate-school education Not the way science is done in many fields Modern science is largely inductive

11
H 0 : No effect H A : Effect of interest Probability{ data | H 0 } Is this what we want to know?

12
Known as the frequentist approach Not what Fisher, Neyman nor Pearson intended! R. A. Fisher (1890 – 1962) Jerzy Neyman (1894 – 1981) Karl Pearson (1857 – 1936)
 Jerzy Neyman (1894 – 1981) Karl Pearson (1857 – 1936).")
13
(c) Ian Britton - FreeFoto.com
 Ian Britton - FreeFoto.com")
14
Some problems: Silly nulls Slow progress Many systems not amenable Inference dependent upon the sample space Fosters unthinking approaches

15
Probability{ H A | data }

16
Thomas C. Chamberlin (1843-1928) -Geologist -President University of Wisconsin -Director Walker Museum and Chair Dept. of Geology at the University of Chicago -President of the American Association for the Advancement of Science Chamberlin, T. C. 1890. The method of multiple working hypotheses. Science 15:92-96 (reprinted 1965, Science 148:754-759
 -Geologist -President University of Wisconsin -Director Walker Museum and Chair Dept. of Geology at the University of Chicago -President of the American Association for the Advancement of Science Chamberlin, T. C The method of multiple working hypotheses. Science 15:92-96 (reprinted 1965, Science 148:")
17
Alternative Hypotheses Reality Theory Data

19
Wading bird group foraging H 1 : No effect H 2 : Group effect same for all species H 3 : Group effect differs by species H 4 : (Group by species) + prey density H 5 : Group + prey density H 6 : (Group by species) + prey + habitat
 + prey density H 5 : Group + prey density H 6 : (Group by species) + prey + habitat")
20
“Nature's great book is written in mathematics.” - Galileo Galilei

21
Empirical Models Mechanistic Models Ecology Chemistry in 19 th Century Climatology Physics Modern Chemistry Molecular biology

22
Three parts Probability distribution (error) Y i ~ N( i, 2 ) Link function E( Y i ) = i linear equation i = n(x i1, x i2, x i3, … x iq )
 Y i ~ N( i, 2 ) Link function E( Y i ) = i linear equation i = n(x i1, x i2, x i3, … x iq )")
23
Linear regression and ANOVA Link function – Identity link linear equation error distribution – Normal Distribution (Gaussian) Y = + 1 X 1 + 2 X 2 +
 Y = + 1 X 1 + 2 X 2 + ")
24
Logistic Regression Link function - Logit link: ln ( / (1- ) ) linear equation error distribution – Binomial Distribution Logit( ) = + 1 X 1 + 2 X 2 +
 ) linear equation error distribution – Binomial Distribution Logit( ) = + 1 X 1 + 2 X 2 + ")
25
R. A. Fisher (1980-1962) The parameter estimates that are most likely, given the data and the model Example Receive a cookie from the cafeteria 11 days Observe 7 chocolate chip and 4 oatmeal raisin What is the best estimate of p = proportion chocolate chip (given the observed data)
 The parameter estimates that are most likely, given the data and the model Example Receive a cookie from the cafeteria 11 days Observe 7 chocolate chip and 4 oatmeal raisin What is the best estimate of p = proportion chocolate chip (given the observed data).")
26
“CC” “CC” “OR” “CC” “CC” “OR” “OR” “CC” “OR” “CC” “CC”

28
Proportion Chocolate Chip

34
Wading bird group foraging H 1 : No effect H 2 : Group effect same for all species H 3 : Group effect differs by species H 4 : (Group by species) + prey density H 5 : Group + prey density H 6 : (Group by species) + prey + habitat
 + prey density H 5 : Group + prey density H 6 : (Group by species) + prey + habitat")
35
Wading bird group foraging H 1 : Foraging rate = b 0 + H 2 : Group effect same for all species H 3 : Group effect differs by species H 4 : (Group by species) + prey density H 5 : Group + prey density H 6 : (Group by species) + prey + habitat
 + prey density H 5 : Group + prey density H 6 : (Group by species) + prey + habitat")
36
Wading bird group foraging H 1 : No effect H 2 : FR = b 0 + Group * b 1 + H 3 : Group effect differs by species H 4 : (Group by species) + prey density H 5 : Group + prey density H 6 : (Group by species) + prey + habitat
 + prey density H 5 : Group + prey density H 6 : (Group by species) + prey + habitat")
37
Observational Study Experimental Study Strength of Inference

38
What is the effect of a particular treatment (or series of treatments) on a particular aspect of the system
 on a particular aspect of the system")
39
CD control BA 7,22,21,54,67, 81 6,29,33,61,77, 79 11,12, 69,74, 91,92 10,15, 41,44, 88 1,4,5, 38,62, 99 Treatments: A, B, C, D Treatments: A, B, C, D Replicates: 1,2,3,…,n Replicates: 1,2,3,…,n

40
CD control BA 7,22,21,54,67, 81 6,29,33,61,77, 79 11,12, 69,74, 91,92 10,15, 41,44, 88 1,4,5, 38,62, 99 Treatments: A, B, C, D Treatments: A, B, C, D Replicates: 1,2,3,…,n Replicates: 1,2,3,…,n Randomization

41
CD control BA 7,22,21,54,67, 81 6,29,33,61,77, 79 11,12, 69,74, 91,92 10,15, 41,44, 88 1,4,5, 38,62, 99 Treatments: A, B, C, D Treatments: A, B, C, D Replicates: 1,2,3,…,n Replicates: 1,2,3,…,n Bias

42
Observational Study Experimental Study Strength of Inference Confirmatory Study

43
Make predictions a priori Design collection of observational data including as much replication and control as possible Weakness is still lack of randomization (not assigning treatment)
")
44
Science is a process to postulate and refine reliable descriptions (explanations) of reality The method of multiple working hypotheses is a particularly useful science tool Mathematics is the language of science Experiments are golden, confirmatory studies are helpful
 of reality The method of multiple working hypotheses is a particularly useful science tool Mathematics is the language of science Experiments are golden, confirmatory studies are helpful")
45
Statistical model selection theory Information-theoretic tools R Model selection in practice Multi-model inference

46
Precision-Bias Trade-off Bias 2 Model Complexity – increasing number of Parameters Y = + 1 X 1 + 2 X 2 +

47
Precision-Bias Trade-off variance Model Complexity – increasing number of Parameters Y = + 1 X 1 + 2 X 2 +

48
Precision-Bias Trade-off Bias 2 variance Model Complexity – increasing number of Parameters Y = + 1 X 1 + 2 X 2 +

49
Kullback, S., and R. A. Leibler. 1951. On Information and Sufficiency The Annals of Mathematical Statistics 22:79-86 (1907-1994)(1914-2003)
( ).")
50
Kullback-Leibler information divergence Full Truth G 1 (best model in set) G2G2 G3G3
 G2G2 G3G3")
51
Kullback-Leibler information divergence G 1 (best model in set) G2G2 G3G3 Full Truth
 G2G2 G3G3 Full Truth")
52
Kullback-Leibler information divergence G 1 (best model in set) G2G2 G3G3 The relative difference between models is constant Full Truth
 G2G2 G3G3 The relative difference between models is constant Full Truth")
53
I(f,g) = information lost when model g is used to approximate f (full reality)
 = information lost when model g is used to approximate f (full reality)")
54
Figured out how to estimate the relative Kullback-Leibler distance between models in a set of models Figured out how to link maximum likelihood estimation theory with expected K-L information An Information Criterion

55
AIC = -2 ln ( L {model i }| data) + 2K Hirotugu Akaik. 1974. A new look at the statistical model identification. IEEE Transactions on Automatic Control 19 (6): 716–723.
: 716–723..")
56
AIC = -2 ln ( L {model i }| data) + 2K Log-likelihood (from software)
 + 2K Log-likelihood (from software)")
57
AIC = -2 ln ( L {model i }| data) + 2K Log-likelihood (from software) Parameters estimated
 + 2K Log-likelihood (from software) Parameters estimated")
58
AIC = -2 ln ( L {model i }| data) + 2K AIC c = AIC + 2*K*(K+1)/(n-K-1) QAIC c = -2ln L /c + 2K + 2*K*(K+1)/(n-K-1) BIC = -2ln L + K ln(n) DIC = -2ln L (for nested models) Etc…
 + 2K AIC c = AIC + 2*K*(K+1)/(n-K-1) QAIC c = -2ln L /c + 2K + 2*K*(K+1)/(n-K-1) BIC = -2ln L + K ln(n) DIC = -2ln L (for nested models) Etc…")
59
Open source version of S (Bell Labs) Developed by Ross Ihaka and Robert Gentleman A true data analysis environment Object-oriented and data-centric programming language Maintained by “The R Foundation” http://www.r-project.org/
 Developed by Ross Ihaka and Robert Gentleman A true data analysis environment Object-oriented and data-centric programming language Maintained by The R Foundation ")
61
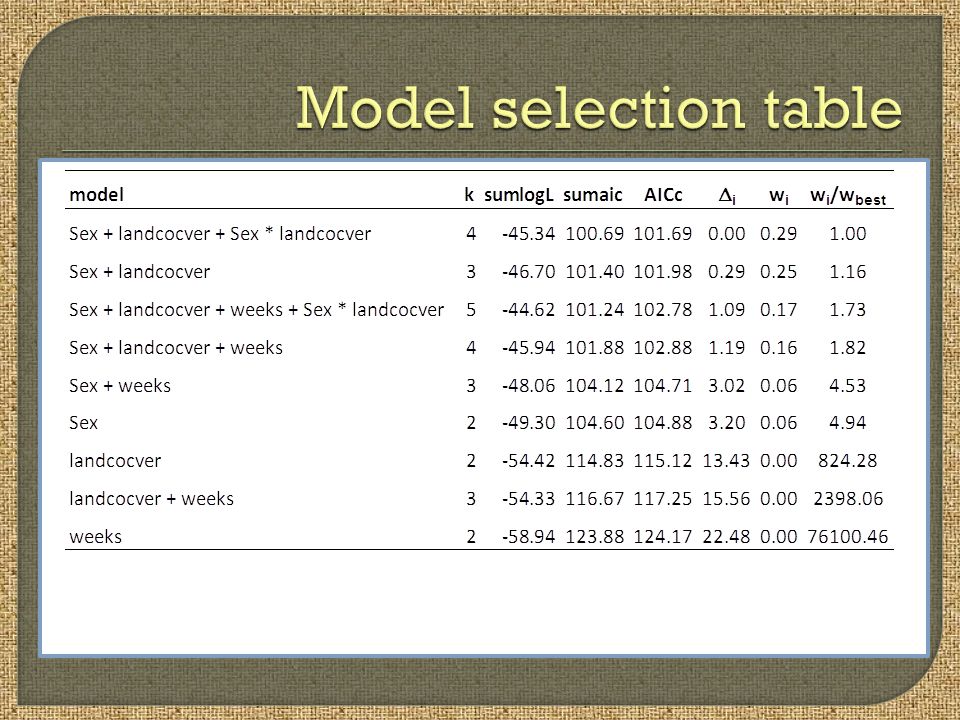
Model Probability Evidence ratio of model i to model j = w i / w j

63
Sometimes there is a clearly best model. If not, why choose one?

64
Problems arise when we use the same data to both select a model and to estimate parameters. Chatfield, C. 1995. Model uncertainty, data mining and statistical inference. Journal of the Royal Statistical Society. Series A (Statistics in Society) 158:419-466. We need to account for the information used in weighting models in our estimates of the model parameter uncertainty
 158: We need to account for the information used in weighting models in our estimates of the model parameter uncertainty.")
66
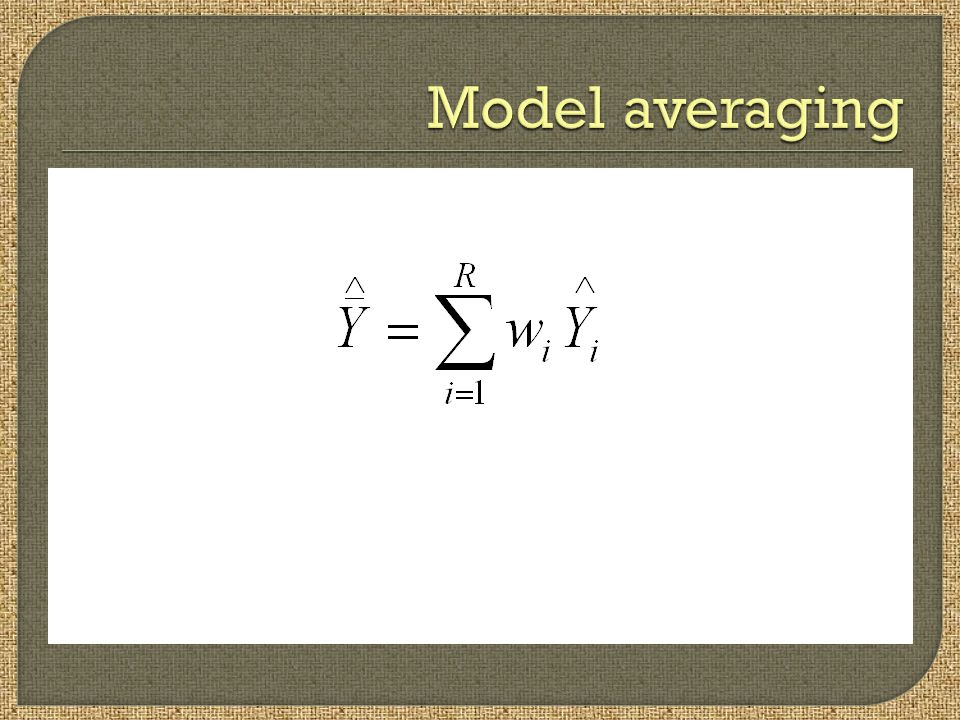
Model-averaged Prediction

67
Model i weight

68
Model i prediction

69
Model-averaged Parameter estimate

73
Science is a process (we never arrive at the destination) Multiple hypotheses approach superior What we’re after is evidence for alternative hypotheses ( Pr{ H a |data } ) Information-theoretic model selection is a powerful new tool in this approach to inference Multi-model averaging acknowledges model-selection uncertainty
 Multiple hypotheses approach superior What we’re after is evidence for alternative hypotheses ( Pr{ H a |data } ) Information-theoretic model selection is a powerful new tool in this approach to inference Multi-model averaging acknowledges model-selection uncertainty")
74
Dan Hunt, IHA David R. Anderson, Colorado State University Model-based Inference Working Group (MBIG) Dave Breininger, Geoff Carter, John Drese, Brean Duncan, Carlton Hall,, Dan Hunt, Tim Kozusko, Eric Stolen eric.d.stolen@nasa.gov
 Dave Breininger, Geoff Carter, John Drese, Brean Duncan, Carlton Hall,, Dan Hunt, Tim Kozusko, Eric Stolen ")
Similar presentations


 and likelihood ratio (LR) test>")


 and likelihood ratio (LR) test>")


>")