Download presentation
Presentation is loading. Please wait.

1
Metabolic Syndrome, Diabetes and Cardiovascular Disease: Strategies for Management Nathan D. Wong, PhD, FACC, FAHA Professor and Director, Heart Disease Prevention Program, Division of Cardiology, University of California, Irvine Past President, American Society of Preventive Cardiology

2
Global Distribution of Diabetes, WHO 2011

3
Diabetes: A Growing Challenge Prevalence in the United States
Diagnosed Diabetes % of Population # of Patients in Millions Diabetes Mellitus: Prevalence in the US Beginning in 1958, the noninstitutionalized United States population has been sampled annually through interviews from 36,000 to 49,000 randomly selected households. Data from the National Health Interview Survey reveal a steady increase in both the prevalence rate and number of people with diabetes. Several explanations to explain this increase in prevalence include: an aging United States population and higher rates of diabetes in older adults; reduction in mortality of people with diabetes; and modifications to the criteria used to diagnose diabetes, which were based on glycosuria prior to the mid-1950’s. These explanations may account for some of the increase in the prevalence rate, however, the growing number of overweight and physically inactive individuals is also likely to contribute to the elevated numbers. All ages 23.6 million 7.8% of population 17.9 million diagnosed 5.7 million undiagnosed > 20 years old: 23.5 million 10.7% of age group > 60 years old: 12.2 million 23.1% of population Men: 12.0 million 11.2% of those > 20 years old Women: 11.5 million 10.2% of those > 20 years old Reference Kenny SJ, Aubert RE, Geiss LS. Prevalence and incidence of non-insulin-dependent diabetes. In: Diabetes in America. 2nd ed. Bethesda, Md: National Diabetes Data Group, National Institutes of Diabetes and Digestive and Kidney Diseases, National Institutes of Health; 1995: NIH Publication No Centers for Disease Control and Prevention, Division of Diabetes Translation. National Diabetes Surveillance System. Available at 3

4
Age-Adjusted Prevalence of Type 2 DM: California Adults Aged >18 Including Hispanic and Asian Subgroups 2009 N.D. Wong, California Health Interview Survey (unpublished)
")
5
Diabetes Mellitus: Lifetime Risk
Advancing age is a strong predictor of developing diabetes mellitus in men and women alike. Narayan et al. JAMA 2003;290: 5

6
Microvascular complications Macrovascular complications
Natural History of Type II Diabetes Mellitus Years from diagnosis -10 -5 5 10 15 Onset Diagnosis Insulin resistance Postprandial glucose Insulin secretion Type II diabetes mellitus increases the risk of microvascular and macrovascular complications. Improved glycemic control can help to minimize these complications over time. Fasting glucose Microvascular complications Macrovascular complications Pre-diabetes Type II diabetes Ramlo-Halsted BA et al. Prim Care. 1999;26: Nathan DM et al. NEJM 2002;347:

7
Diagnostic Criteria for Glycemic Abnormalities
FPG 126 mg/dL 100 mg/dL 7.0 mmol/L 5.6 mmol/L Prediabetes Normal Diabetes Mellitus 2-Hour PG on OGTT 200 mg/dL 140 mg/dL 11.1 mmol/L 7.8 Impaired Glucose Tolerance Hemoglobin A1C 6.5% 6.0% Criteria for the diagnosis of diabetes mellitus include: (a) a fasting glucose >126 mg/dl or (b) a two hour plasma glucose of >200mg/dl after a 75 gram oral glucose load. An International Committee recently added the hemoglobin A1C assay as an alternative diagnostic test, with a level ≥6.5% indicating diabetes and a level between 6.0 and 6.5% indicating high risk for progression to diabetes. To convert mg/dL to mmol/L multiply mg/dl by 0.055 FPG=Fasting plasma glucose, PG=Plasma glucose, OGTT=Oral glucose tolerance test The Expert Committee on the Diagnosis and Classification of Diabetes Mellitus. Diabetes Care 2001;24:S5-S20 American Diabetes Association. Diabetes Care 2010;33:S11-61
 a fasting glucose >126 mg/dl or (b) a two hour plasma glucose of >200mg/dl after a 75 gram oral glucose load. An International Committee recently added the hemoglobin A1C assay as an alternative diagnostic test, with a level ≥6.5% indicating diabetes and a level between 6.0 and 6.5% indicating high risk for progression to diabetes. To convert mg/dL to mmol/L multiply mg/dl by FPG=Fasting plasma glucose, PG=Plasma glucose, OGTT=Oral glucose tolerance test. The Expert Committee on the Diagnosis and Classification of Diabetes Mellitus. Diabetes Care 2001;24:S5-S20. American Diabetes Association. Diabetes Care 2010;33:S")
8
Causes of Mortality in Patients With Diabetes
Cardiovascular disease is the most common cause of death among patients with diabetes, according to data from death certificates. Heart disease accounts for approximately 55% of all deaths and cerebrovascular disease is responsible for another 10% of deaths. Acute diabetes-related complications are the next most common cause of death, accounting for 13% of deaths. Pneumonia/influenza, malignant neoplasms, and other causes account for the remaining deaths. Renal disease is not listed as a separate category, because dialysis and transplantation have made renal failure an uncommon immediate cause of death. However, cardiovascular disease is a common cause of death in patients on long-term dialysis. In patients with type 2 diabetes, the relative contribution of cardiovascular disease as a cause of death is greater in younger-age and younger-age-at-onset patients than in older-age and older-age-at-onset patients. Geiss LS, et al. Mortality in non-insulin-dependent diabetes. In: Diabetes in America. 2nd ed. Bethesda, Md: National Institute of Diabetes and Digestive and Kidney Diseases, National Institutes of Health; 1995: NIH Publication No

9
Diabetes and CVD Atherosclerotic complications responsible for
80% of mortality among patients with diabetes 75% of cases due to coronary artery disease (CAD) Results in >75% of all hospitalizations for diabetic complications 50% of patients with type 2 diabetes have preexisting CAD. (This number may be less now that more younger people are diagnosed with diabetes.) 1/3 of patients presenting with myocardial infarction have undiagnosed diabetes mellitus Diabetes: Atherosclerotic Complications Atherosclerotic cardiovascular disease is the primary cause of death in people with diabetes. In addition, most hospitalizations resulting from diabetes-associated complications are a consequence of atherosclerotic cardiovascular disease. Incidence of atherosclerotic cardiovascular disease is 2- to 4-fold higher in individuals with diabetes than without the disease. A likely explanation for the elevated post-infarction mortality rate among individuals with diabetes is the diffuse pattern of atherosclerosis generally observed in this patient population. . Dyslipidemia correlates with elevated risk for coronary artery disease (CAD) in patients with and without diabetes. It is therefore suggested that aggressive management of lipid level abnormalities may dramatically decrease the incidence of CAD in the diabetic patient population. The “50% with CAD” is likely an overestimate, given the prevalence of T2DM now in children and young adults Reference Lewis GF. Diabetic dyslipidemia: a case for aggressive intervention in the absence of clinical trial and cost effective data. Can J Cardiol. 1995;11(suppl C):24C-28C. Lewis GF. Can J Cardiol. 1995;11(suppl C):24C-28C Norhammar A, et.al. Lancet 2002;359; 9
 Results in >75% of all hospitalizations for diabetic complications. 50% of patients with type 2 diabetes have preexisting CAD. (This number may be less now that more younger people are diagnosed with diabetes.) 1/3 of patients presenting with myocardial infarction have undiagnosed diabetes mellitus. Diabetes: Atherosclerotic Complications. Atherosclerotic cardiovascular disease is the primary cause of death in people with diabetes. In addition, most hospitalizations resulting from diabetes-associated complications are a consequence of atherosclerotic cardiovascular disease. Incidence of atherosclerotic cardiovascular disease is 2- to 4-fold higher in individuals with diabetes than without the disease. A likely explanation for the elevated post-infarction mortality rate among individuals with diabetes is the diffuse pattern of atherosclerosis generally observed in this patient population. . Dyslipidemia correlates with elevated risk for coronary artery disease (CAD) in patients with and without diabetes. It is therefore suggested that aggressive management of lipid level abnormalities may dramatically decrease the incidence of CAD in the diabetic patient population. The 50% with CAD is likely an overestimate, given the prevalence of T2DM now in children and young adults. Reference. Lewis GF. Diabetic dyslipidemia: a case for aggressive intervention in the absence of clinical trial and cost effective data. Can J Cardiol. 1995;11(suppl C):24C-28C. Lewis GF. Can J Cardiol. 1995;11(suppl C):24C-28C. Norhammar A, et.al. Lancet 2002;359;")
10
Most Cardiovascular Patients Have Abnormal Glucose Metabolism
GAMI n = 164 EHS n = 1920 CHS n = 2263 18% 27% 35% 31% 37% 37% 45% 36% 34% Prediabetes Type 2 Diabetes Normoglycemia GAMI = Glucose Tolerance in Patients with Acute Myocardial Infarction study; EHS = Euro Heart Survey; CHS = China Heart Survey Anselmino M, et al. Rev Cardiovasc Med. 2008;9:29-38. 10

11
Subclinical Atherosclerosis Atherosclerotic Clinical Events
Mechanisms by which Diabetes Mellitus Leads to Coronary Heart Disease Hyperglycemia Insulin Resistance HTN Endothelial dysfunction Inflammation Dyslipidemia LDL TG HDL AGE Oxidative stress Infection IL-6 CRP SAA Thrombosis PAI-1 TF tPA Defense mechanisms Pathogen burden Subclinical Atherosclerosis Disease Progression Infection, inflammation, hyperglycemia, insulin resistance, dyslipidemia, and thrombosis have all been implicated in the development of atherosclerosis and subsequent adverse CV events in patients with diabetes mellitus. Atherosclerotic Clinical Events AGE=Advanced glycation end products, CRP=C-reactive protein, CHD=Coronary heart disease HDL=High-density lipoprotein, HTN=Hypertension, IL-6=Interleukin-6, LDL=Low-density lipoprotein, PAI-1=Plasminogen activator inhibitor-1, SAA=Serum amyloid A protein, TF=Tissue factor, TG=Triglycerides, tPA=Tissue plasminogen activator Biondi-Zoccai GGL et al. JACC 2003;41: 11

12
Risk of Cardiovascular Events in Patients with Diabetes: Framingham Study
_________________________________________________________________ Age-adjusted Biennial Rate Age-adjusted Per Risk Ratio Cardiovascular Event Men Women Men Women Coronary Disease ** *** Stroke *** 2.6*** Peripheral Artery Dis *** 6.4*** Cardiac Failure *** 7.8*** All CVD Events *** 3.7*** Subjects year Follow-up **P<.001,***P<.0001 _________________________________________________________________ 12

13
Cardiovascular Risk Factors are the Top 6 Leading Causes of Death

15
Metabolic Syndrome: Clustering of Interconnected Metabolic Risk Factors
Insulin Resistance + Hyperglycemia Obesity Hypertension Atherogenic Dyslipidemia

16
IDF/IAS/NHLBI/AHA/WHF Joint Scientific Statement on Diagnosis of Metabolic Syndrome (Alberti et al. Circulation 2009) (>=3 criteria required for diagnosis)
 (>=3 criteria required for diagnosis).")
17
Alberti et al. Circulation 2009

18
Intra-abdominal (Visceral) Fat The dangerous inner fat!
Front Visceral AT Subcutaneous AT Back 3

19
To measure waist circumference, 1) locate the upper hip bone and the top of the right iliac crest, 2) place the measuring tape in a horizontal plane around the abdomen at the iliac crest, 3) ensure that the tape is snug but does not compress the skin, 4) the tape should be parallel to floor, and 5) record the measurement at the end of a normal expiration. Men are at increased relative risk if they have a waist circumference greater than 40 inches (102 cm); women are at an increased relative risk if they have a waist circumference greater than 35 inches (88 cm). There are ethnic- and age-related differences in body fat distribution that may affect the predictive validity of waist circumference as a surrogate for abdominal fat. Heterogeneity of composition of abdominal tissues, in particular adipose tissue and skeletal muscle, and their location-specific and changing relations with metabolic factors and CV risk factors in different ethnic groups do not allow a simple definition of abdominal obesity that could be applied uniformly. In particular, Asians appear to have higher morbidity at lower cutoff points for waist circumference than do white Caucasians. National Institutes of Health, National Heart, Lung, and Blood Institute, NHLBI Obesity Education Initiative, North American Association for the Study of Obesity. The practical guide to the identification, evaluation, and treatment of overweight and obesity in adults. NIH Publication Number October 2000. Misra A, Wasir JS, Vikram NK. Waist circumference criteria for the diagnosis of abdominal obesity are not applicable uniformly to all populations and ethnic groups. Nutrition. 2005;21:
; women are at an increased relative risk if they have a waist circumference greater than 35 inches (88 cm). There are ethnic- and age-related differences in body fat distribution that may affect the predictive validity of waist circumference as a surrogate for abdominal fat. Heterogeneity of composition of abdominal tissues, in particular adipose tissue and skeletal muscle, and their location-specific and changing relations with metabolic factors and CV risk factors in different ethnic groups do not allow a simple definition of abdominal obesity that could be applied uniformly. In particular, Asians appear to have higher morbidity at lower cutoff points for waist circumference than do white Caucasians. National Institutes of Health, National Heart, Lung, and Blood Institute, NHLBI Obesity Education Initiative, North American Association for the Study of Obesity. The practical guide to the identification, evaluation, and treatment of overweight and obesity in adults. NIH Publication Number October Misra A, Wasir JS, Vikram NK. Waist circumference criteria for the diagnosis of abdominal obesity are not applicable uniformly to all populations and ethnic groups. Nutrition. 2005;21:")
20
Abdominal Adiposity Is Associated With Increased Risk of Diabetes
P value for trend <0.001 Relative Risk of Diabetes Circling back to the discussion of abdominal adiposity, data regarding waist circumference and diabetes illustrate its health impact. These are age-adjusted data from the Nurses’ Health Study, analyzing responses from 43,581 subjects who provided information on weight and body measurements in These subjects had no history of cancer, heart disease, stroke, or any type of diabetes. An 8-year follow-up in this population showed a strong positive association between waist circumference and the incidence of diabetes. At the far end of the spectrum, women with a waist circumference >38 inches had a diabetes risk of 22.4, relative to women in the normal waist circumference range of <28 inches. Other obesity measures studied included body mass index and waist-to-hip ratio; both of these were also found to be independent determinants of type 2 diabetes in this population. The sharpest risk gradient was documented with waist circumference, indicating that it is a powerful independent predictor of type 2 diabetes in women. (WC was measured at the high point of the iliac crest at minimal respiration to the nearest 0.1 cm.) Carey VJ, Walters EE, Colditz GA, et al. Body fat distribution and risk of non-insulin-dependent diabetes mellitus in women: the Nurses’ Health Study. Am J Epidemiol. 1997;145: Waist Circumference (in) Carey VJ, et al. Am J Epidemiol. 1997;145: 20
 Carey VJ, Walters EE, Colditz GA, et al. Body fat distribution and risk of non-insulin-dependent diabetes mellitus in women: the Nurses’ Health Study. Am J Epidemiol. 1997;145: Waist Circumference (in) Carey VJ, et al. Am J Epidemiol. 1997;145:")
21
Metabolic Syndrome and Diabetes in Relation to CHD, CVD, and Total Mortality: U.S. Men and Women Ages 30-74 (Risk-factor Adjusted Cox Regression) NHANES II Follow-up (n=6255) *** *** *** *** *** *** *** *** * ** *** *** Malik and Wong, et al., Circulation 2004. * p<.05, ** p<.01, **** p<.0001 compared to none 21
 NHANES II. Follow-up (n=6255) *** *** *** *** *** *** *** *** * ** *** *** Malik and Wong, et al., Circulation * p<.05, ** p<.01, **** p<.0001 compared to none. 21.")
22
Metabolic Syndrome and CVD Risk: Meta-Analysis: Mottillo et al
Metabolic Syndrome and CVD Risk: Meta-Analysis: Mottillo et al. JACC 2010 951,083 pts in 83 studies Little variation in risk between definitions Relative risk: 2.35 ( ) for CVD events 2.40 ( ) for CVD mortality 1.58 ( ) for all-cause mortality 1.99 ( ) for myocardial infarction 2.27 ( ) for stroke Those with metabolic syndrome, without diabetes, maintained high CVD risk (RR=1.75, 95% CI= )
 for CVD events ( ) for CVD mortality ( ) for all-cause mortality ( ) for myocardial infarction ( ) for stroke. Those with metabolic syndrome, without diabetes, maintained high CVD risk (RR=1.75, 95% CI= )")
23
7-Year Incidence Rate of MI
Type 2 Diabetes and CHD 7-Year Incidence of Fatal/Nonfatal MI (East West Study) P<0.001 P<0.001 45.0% 20.2% 7-Year Incidence Rate of MI 18.8% 3.5% Type 2 Diabetes and CHD 7-Year Incidence of Fatal/Nonfatal MI (East West Study) Prior to completion of this study, little data existed to compare mortality rates from coronary heart disease (CHD) in patients with diabetes, but without prior myocardial infarction (MI), and patients without diabetes, but with a history of MI. To sort out the risks among the groups and determine whether patients with diabetes and no MI history should be treated as aggressively for cardiovascular (CV) risk factors as patients who have had an MI, the 7-year incidence MI in 2432 patients (1059 with diabetes, 1373 without diabetes) was quantified. Results indicate, the 7-year incidence of MI in patients with diabetes was 45.0% for those with a previous MI, and 20.2% for patients without an MI at baseline (P<0.001). Among patients without diabetes, but with a positive history for prior MI, 7-year incidence of MI was 18.8%. Kaplan-Meier estimates that the probability of death from CHD reveals similar outcomes for patients with diabetes/no history of MI and no diabetes/history of MI. The hazard ratio for death from CHD for the 2 groups was not significantly different from 1.0 (hazard ratio, 1.4; 95% confidence interval [CI]) of 0.7 to 2.6). This hazard ratio remained close to 1.0 even after adjustment for total cholesterol, hypertension, and smoking. These data support that treatment of CV risk factors in patients with diabetes and no history of MI should be as aggressively treated as with patients without diabetes, but with a history of previous MI. Reference Haffner SM, Lehto S, Ronnemaa T, Pyorala K, Laakso M. Mortality from coronary heart disease in subjects with type 2 diabetes and in nondiabetic subjects with and without prior myocardial infarction. N Engl J Med. 1998;339: No Diabetes Diabetes CHD=coronary heart disease; MI=myocardial infarction; DM=diabetes mellitus Haffner SM et al. N Engl J Med. 1998;339: 23
 P< P< % 20.2% 7-Year Incidence Rate of MI. 18.8% 3.5% Type 2 Diabetes and CHD 7-Year Incidence of Fatal/Nonfatal MI (East West Study) Prior to completion of this study, little data existed to compare mortality rates from coronary heart disease (CHD) in patients with diabetes, but without prior myocardial infarction (MI), and patients without diabetes, but with a history of MI. To sort out the risks among the groups and determine whether patients with diabetes and no MI history should be treated as aggressively for cardiovascular (CV) risk factors as patients who have had an MI, the 7-year incidence MI in 2432 patients (1059 with diabetes, 1373 without diabetes) was quantified. Results indicate, the 7-year incidence of MI in patients with diabetes was 45.0% for those with a previous MI, and 20.2% for patients without an MI at baseline (P<0.001). Among patients without diabetes, but with a positive history for prior MI, 7-year incidence of MI was 18.8%. Kaplan-Meier estimates that the probability of death from CHD reveals similar outcomes for patients with diabetes/no history of MI and no diabetes/history of MI. The hazard ratio for death from CHD for the 2 groups was not significantly different from 1.0 (hazard ratio, 1.4; 95% confidence interval [CI]) of 0.7 to 2.6). This hazard ratio remained close to 1.0 even after adjustment for total cholesterol, hypertension, and smoking. These data support that treatment of CV risk factors in patients with diabetes and no history of MI should be as aggressively treated as with patients without diabetes, but with a history of previous MI. Reference. Haffner SM, Lehto S, Ronnemaa T, Pyorala K, Laakso M. Mortality from coronary heart disease in subjects with type 2 diabetes and in nondiabetic subjects with and without prior myocardial infarction. N Engl J Med. 1998;339: No Diabetes. Diabetes. CHD=coronary heart disease; MI=myocardial infarction; DM=diabetes mellitus. Haffner SM et al. N Engl J Med. 1998;339:")
25
Is DM really a CHD Risk Equivalent
Is DM really a CHD Risk Equivalent? Meta-Analysis of 38,578 subjects (Bulugahapitiya et al. Diabetic Med 2008) DM without prior MI has a 43% lower risk of developing total CHD events compared to those without DM with prior MI, suggesting DM is not a coronary risk equivalent.
 DM without prior MI has a 43% lower risk of developing total CHD events compared to those without DM with prior MI, suggesting DM is not a coronary risk equivalent.")
26
32% of men and 48% of women are at calculated low to intermediate risk
Global Risk Assessment in DM: US adults year Total CVD Risk by Gender (Wong ND et al., Diab Vas Dis Res 2012) 32% of men and 48% of women are at calculated low to intermediate risk
 32% of men and 48% of women are at calculated low to intermediate risk.")
27
2013 Prevention Guidelines ASCVD Risk Estimator
Available at

28
Screening for Coronary Disease in Diabetes: When and How (Ali and Maron, Clinical Diabetes 2006)
“ Screening patients according to traditional risk factors and current guidelines alone will frequently fail to identify CHD, thus losing the opportunity for early diagnosis and intensified management” “A more aggressive approach to identifying asymptomatic coronary disease should therefore be considered in this (diabetic) patient population”
 patient population")
29
Coronary Heart Disease
Annual CHD Event Rates (in %) by Calcium Score Events by CAC Categories in Subjects with DM, MetS, or Neither Disease (Malik and Wong et al., Diabetes Care 2011) Coronary Heart Disease Coronary Artery Calcium Score ACCF/AHA 2010 Guideline: CAC Scoring for CV risk assessment in asymptomatic adults aged 40 and over with diabetes (Class IIa-B)
 by Calcium Score Events by CAC Categories in Subjects with DM, MetS, or Neither Disease (Malik and Wong et al., Diabetes Care 2011) Coronary Heart Disease. Coronary Artery Calcium Score. ACCF/AHA 2010 Guideline: CAC Scoring for CV risk assessment in asymptomatic adults aged 40 and over with diabetes (Class IIa-B)")
30
DIAD Randomized Clinical Trial of Stress MPI Screening (Young, Inzucchi et al. JAMA 2009)
Randomized NIH multicenter trial examining whether screening for myocardial ischemia using adenosine-stress MPI in 1123 persons with type 2 DM and no symptoms of CAD. Only 22% were positive for myocardial ischemia with only 6% have moderate or large defects 5-year 2.9% cumulative event rate (0.6% per year), much lower than expected Event rates similar in those screening (2.7%) vs. not screened (3.0%) (p=0.73) (authors note the study only had 20% power to detect a 20% difference between groups)
, much lower than expected Event rates similar in those screening (2.7%) vs. not screened (3.0%) (p=0.73) (authors note the study only had 20% power to detect a 20% difference between groups)")
31
DIAD Study (continued)
The authors conclude that screening for inducible ischemia in asymptomatic patients with T2DM cannot be advocated for 4 reasons: The yield of significant inducible ischemia is very low Overall cardiac event rates are low Routine screening does not appear to affect overall outcome Routine screening would be prohibitively expensive The much lower than expected event rates makes the study inconclusive in demonstrating the lack of efficacy of screening for subclinical CVD

32
But should we be using stress MPI to screen for CVD in all pts with DM?
Stress MPI is meant to identify short-term risk due to functional deficit, rather than long-term prognosis such as that identified by a test to quantify atherosclerotic burden such as coronary calcium The radiation and costs are much higher for MPI as compared to coronary calcium, suggesting MPI might be best reserved for those DM at highest risk

33
ADA 2007 Consensus Statement (Bax et al. Diab Care 2007)
“If coronary calcium testing is performed, it appears reasonable to proceed with further testing in diabetic patients with calcium scores >400…….using single photon emission tomography to assess myocardial perfusion or stress echocardiography to assess ischemic wall motion abnormalities”

34
Prevalence of Inducible Ischemia Associated with Presence of Metabolic Abnormality and Coronary Calcium Score (Wong et al., Diabetes Care 2005; 28: ) P=0.032 P=0.018 P< for trend across CCS groups for both metabolic abnormality present and absent; similar relation for those with metabolic syndrome excluding diabetes ACCF/AHA 2010 Guideline: Stress MPI may be considered for advanced CV risk assessment in asymptomatic adults with diabetes or when previous risk assessment testing suggests a high risk of CHD, such as a CAC score of 400 or greater (Class IIb – Level of Evidence C) Lipid Management in Clinical Practice - Section 1
 Lipid Management in Clinical Practice - Section 1.")
35
Does Screening for CVD Improve Outcomes
Does Screening for CVD Improve Outcomes? Beneficial Role of Coronary Multidetector CT Screening for 5-Year All-Cause Mortality among Asymptomatic DM Patients (H Kyung Yang et al., ADA 2014) Asymptomatic T2DM subjects 774 received coronary MDCT and 1548 matched controls did not get screened Groups similar except longer duration DM and higher A1c in screened group After 31 month median follow-up, greater lipid decreases and statin prescription in screened group Coronary angiography and revascularization higher in MDCT group
 Asymptomatic T2DM subjects. 774 received coronary MDCT and 1548 matched controls did not get screened. Groups similar except longer duration DM and higher A1c in screened group. After 31 month median follow-up, greater lipid decreases and statin prescription in screened group. Coronary angiography and revascularization higher in MDCT group.")
36
Beneficial Role of Coronary Multidetector CT Screening for 5-Year All-Cause Mortality among Asymptomatic DM Patients (Yang et al., ADA 2014) All cause mortality at 5 years lower in the MDCT (4.5%) vs. non-MDCT (6.8%) group, p=0.02 Authors conclude “MDCT may play a beneficial role as a screening test to detect advanced macrovascular complications in asymptomatic T2DM patients and to increase survival rate”
 vs. non-MDCT (6.8%) group, p=0.02. Authors conclude MDCT may play a beneficial role as a screening test to detect advanced macrovascular complications in asymptomatic T2DM patients and to increase survival rate")
37
Coronary Artery Calcium and Cardiovascular Events in Diabetes: Implications for Primary Prevention Therapies: The Multi-Ethnic Study of Atherosclerosis (MESA) Michael G. Silverman1, Michael J. Blaha1, Matthew J. Budoff2, Ron Blankstein3, Roger S. Blumenthal1, Harlan Krumholz4, Juan J. Rivera5, Arthur Agatston6, Nathan D. Wong7, Steven Shea8, John McEvoy1, Khurram Nasir1, 6 1 Johns Hopkins Ciccarone Center for Prevention of Heart Disease, Baltimore, MD 2 Division of Cardiology, Harbor-UCLA Medical Center, Torrance, CA 3 Brigham and Women's Hospital Non-invasive CV Imaging Program, Boston, MA 4 Yale University School of Medicine, New Haven, CT 5 Division of Cardiology, University of Miami, Miami, FL 6 Center for Prevention and Wellness, Baptist Health South Florida, Miami, FL 7 UC Irvine Heart Disease Prevention Program, Irvine, CA 8 College of Physicians and Surgeons, Columbia University, New York, NY Presented at AHA 2012 Presented by: Michael Silverman April 20, 2017

38
Estimated 5 year NNT with Statin
CAC Group Estimated CHD event rate at 7.6 years Estimated CVD event rate at 7.6 years 5-year NNT CHD 5-year NNT CVD CAC = 0 1.49% 5.47% 486 132 CAC 1-100 12.08% 16.33% 60 44 CAC > 100 18.77% 26.57% 39 27 NNT calculated using 21% RR reduction Chen Y-H, Feng R, Chen Z-W. Exp Clin End Diab 2012; 120: Cholesterol Treatment Trialists’ Collaboration, Lancet 2008; 371: April 20, 2017

39
Summary of Care: ABC's for Providers
A1c Target Aspirin Daily B Blood Pressure Control C Cholesterol Management Cigarette Smoking Cessation D Diabetes and Pre-Diabetes Management E Exercise F Food Choices

40
Treating the ABCs Reduces Diabetic Complications
Strategy Complication Reduction of Complication Blood glucose control Heart attack 37%1 Blood pressure control Cardiovascular disease Heart failure Stroke Diabetes-related deaths 51%2 56%3 44%3 32%3 Lipid control Coronary heart disease mortality Major coronary heart disease event Any atherosclerotic event Cerebrovascular disease event 35%4 55%5 37%5 53%4 1 UKPDS Study Group (UKPDS 33). Lancet. 1998;352: 2 Hansson L, et al. Lancet. 1998;351: 3 UKPDS Study Group (UKPDS 38). BMJ. 1998;317: 4 Grover SA, et al. Circulation. 2000;102: 5 Pyŏrälä K, et al. Diabetes Care. 1997;20:
. Lancet. 1998;352: Hansson L, et al. Lancet. 1998;351: UKPDS Study Group (UKPDS 38). BMJ. 1998;317: Grover SA, et al. Circulation. 2000;102: Pyŏrälä K, et al. Diabetes Care. 1997;20:")
41
Benefit of Comprehensive, Intensive Management: STENO 2 Study
Primary End Point=CV events (%) 60 Treatment Goals: Intensive TLC HgbA1c <6.5% Cholesterol <175 Triglycerides <150 BP <130/80 50 Conventional Therapy n =80 Intensive Therapy 40 30 20 n =80 10 12 24 36 48 60 72 84 96 Months of Follow Up Gaede, P. et al, NEJM 2003;348:
 60. Treatment Goals: Intensive TLC. HgbA1c <6.5% Cholesterol <175. Triglycerides <150. BP <130/ Conventional Therapy. n =80. Intensive Therapy n = Months of Follow Up. Gaede, P. et al, NEJM 2003;348:")
42
Percent of CHD Events Over 10 Years Prevented in US Adults with T2DM, According to Individual and Composite Risk Factor Control (Wong ND, et al., Am J Cardiol 2014) Goal(ADA Guidelines) Nominal Aggressive HbA1C* 7% 1% AR 2% AR Systolic Blood Pressure 130mmHg 10% RR 20% RR Total Cholesterol 170mg/dl (4.4mmol/L) 25% RR 50% RR HDL-Cholesterol 40mg/dl(M), 50 mg/dl(F) 10% relative increase 20% relative increase RR-Relative Reduction; AR- Absolute Reduction; HbA1C levels were not allowed to be reduced further than 6.5%
 Nominal. Aggressive. HbA1C* 7% 1% AR. 2% AR. Systolic Blood Pressure. 130mmHg. 10% RR. 20% RR. Total Cholesterol. 170mg/dl (4.4mmol/L) 25% RR. 50% RR. HDL-Cholesterol. 40mg/dl(M), 50 mg/dl(F) 10% relative increase. 20% relative increase. RR-Relative Reduction; AR- Absolute Reduction; HbA1C levels were not allowed to be reduced further than 6.5%")
43
Achieving Risk Factor Targets and CVD Event Risk in Diabetes (Wong et al. ADA 2014)
Potential effects of multifactorial risk factor control are not well-quantitated. We examined if being at target for LDL-C, HbA1c, and BP, individually and together, is associated with lower CHD/CVD rates. 2,160 multiethnic adults with DM without prior CVD from the ARIC, Jackson, and MESA prospective studies followed for 11 years. We examined event risk in those at target for LDL-C (<100 mg/dl), HbA1c (<7%), and blood pressure (BP) (<130/80 mmHg) according to American Diabetes Association guidelines. Overall, 39.0%, 42.8%, 30.5%, and 6.8% of subjects were at target for LDL-C, HbA1c, and BP, and all three factors Being at composite target (vs one or more factors not at target) was associated with a significantly reduced risk of CHD (HR=0.46, 95% CI = ) and CVD (HR=0.66, 95% CI= ) events. Optimal levels of lipids, blood pressure, and glucose control together are uncommon in persons with DM, but are associated with substantially lower CHD and CVD risks.
, HbA1c (<7%), and blood pressure (BP) (<130/80 mmHg) according to American Diabetes Association guidelines. Overall, 39.0%, 42.8%, 30.5%, and 6.8% of subjects were at target for LDL-C, HbA1c, and BP, and all three factors. Being at composite target (vs one or more factors not at target) was associated with a significantly reduced risk of CHD (HR=0.46, 95% CI = ) and CVD (HR=0.66, 95% CI= ) events. Optimal levels of lipids, blood pressure, and glucose control together are uncommon in persons with DM, but are associated with substantially lower CHD and CVD risks.")
44
Control of DM Risk Factors in a Large Multipayer Outpatient Population in Northern California (n=15,826) (Holland et al., J Diab Complic 2013) Individual control of HbA1c, BP, and LDL ranged from 42-78% in Asians Composite control of HbA1c, BP, and LDL ranged from 21-27% in Asians

45
Diabetes Mellitus: Effect of Aspirin NS=Not Significant
Endpoint yr MI yr MI yr MCE yr CV Death 4 yr MCE 7yr MCE yr MCE # Events 26 vs vs vs vs vs vs vs 68 p<0.002 p=NS p < 0.001 p=.04 p<0.05 p=NS p=NS Aspirin provides varying degrees of CV risk reduction in diabetes mellitus. NS=Not Significant 1. Steering Committee of the Physicians' Health Study Research Group. NEJM 1989;321:129-35 2. ETDRS Investigators. JAMA 1992;268:1292 3. Antiplatelet Trialists' Collaboration. BMJ 1994; 308:81 4. Harpaz D et al. Am J Med 1998;105:494 3. Sacco M et al. Diabetes Care 2003;26:3264 4. Belch J et al. BMJ 2008; 337:a1840 5. Ogawa H et al. JAMA 2008; 300: 2134

46
Recommendations: Antiplatelet Agents (1)
Consider aspirin therapy (75–162 mg/day) (C) As a primary prevention strategy in those with type 1 or type 2 diabetes at increased cardiovascular risk (10-year risk >10%) Includes most men >50 years of age or women >60 years of age who have at least one additional major risk factor Family history of CVD Hypertension Smoking Dyslipidemia Albuminuria Recommendations for the use of antiplatelet agents1 are summarized in three slides Slide 1 of 3 Low-dose (75–162 mg/day) aspirin use for primary prevention is reasonable for adults with diabetes and no previous history of vascular disease who are at increased CVD risk (10-year risk of CVD events >10%) and who are not at increased risk for bleeding This generally includes most men over age 50 years and women over age 60 years who also have one or more of the following major risk factors: smoking, hypertension, dyslipidemia, family history of premature CVD, or albuminuria In 2010, a position statement of the ADA, AHA, and the American College of Cardiology Foundation (ACCF) updated prior joint recommendations for primary prevention2 ADA. VI. Prevention, Management of Complications. Diabetes Care 2013;36(suppl 1):S32-S33. References Pignone M, Alberts MJ, Colwell JA, et al.; American Diabetes Association; American Heart Association; American College of Cardiology Foundation. Aspirin for primary prevention of cardiovascular events in people with diabetes: a position statement of the American Diabetes Association, a scientific statement of the American Heart Association, and an expert consensus document of the American College of Cardiology Foundation. Diabetes Care 2010;33: American Diabetes Association. Standards of medical care in diabetes—2013. Diabetes Care 2013;36(suppl 1):S32-S33.
 (C) As a primary prevention strategy in those with type 1 or type 2 diabetes at increased cardiovascular risk (10-year risk >10%) Includes most men >50 years of age or women >60 years of age who have at least one additional major risk factor. Family history of CVD. Hypertension. Smoking. Dyslipidemia. Albuminuria. Recommendations for the use of antiplatelet agents1 are summarized in three slides. Slide 1 of 3. Low-dose (75–162 mg/day) aspirin use for primary prevention is reasonable for adults with diabetes and no previous history of vascular disease who are at increased CVD risk (10-year risk of CVD events >10%) and who are not at increased risk for bleeding. This generally includes most men over age 50 years and women over age 60 years who also have one or more of the following major risk factors: smoking, hypertension, dyslipidemia, family history of premature CVD, or albuminuria. In 2010, a position statement of the ADA, AHA, and the American College of Cardiology Foundation (ACCF) updated prior joint recommendations for primary prevention2. ADA. VI. Prevention, Management of Complications. Diabetes Care 2013;36(suppl 1):S32-S33. References. Pignone M, Alberts MJ, Colwell JA, et al.; American Diabetes Association; American Heart Association; American College of Cardiology Foundation. Aspirin for primary prevention of cardiovascular events in people with diabetes: a position statement of the American Diabetes Association, a scientific statement of the American Heart Association, and an expert consensus document of the American College of Cardiology Foundation. Diabetes Care 2010;33: American Diabetes Association. Standards of medical care in diabetes—2013. Diabetes Care 2013;36(suppl 1):S32-S33.")
47
Recommendations: Antiplatelet Agents (2)
Aspirin should not be recommended for CVD prevention for adults with diabetes at low CVD risk, since potential adverse effects from bleeding likely offset potential benefits (C) 10-year CVD risk <5%: men <50 and women <60 years of age with no major additional CVD risk factors In patients in these age groups with multiple other risk factors (10-year risk 5–10%), clinical judgment is required (E) Recommendations for the use of antiplatelet agents are summarized in three slides Slide 2 of 3 Aspirin should not be recommended for CVD prevention for adults with diabetes at low CVD risk (10-year CVD risk <5%, such as in men <50 and women <60 years of age with no major additional CVD risk factors), since the potential adverse effects from bleeding likely offset the potential benefits (C) In patients in these age groups with multiple other risk factors (e.g., 10-year risk 5%-10%) clinical judgment is required (E) However, aspirin is no longer recommended for those at low CVD risk (women under age 60 years and men under age 50 years with no major CVD risk factors; 10-year CVD risk <5%), as the low benefit is likely to be outweighed by the risks of significant bleeding Clinical judgment should be used for those at intermediate risk (younger patients with one or more risk factors, or older patients with no risk factors; those with 10-year CVD risk of 5–10%) until further research is available. Use of aspirin in patients under the age of 21 years is contraindicated due to the associated risk of Reye syndrome ADA. VI. Prevention, Management of Complications. Diabetes Care 2013;36(suppl 1):S33. Reference American Diabetes Association. Standards of medical care in diabetes—2013. Diabetes Care 2013;36(suppl 1):S33.
 10-year CVD risk <5%: men <50 and women <60 years of age with no major additional CVD risk factors. In patients in these age groups with multiple other risk factors (10-year risk 5–10%), clinical judgment is required (E) Recommendations for the use of antiplatelet agents are summarized in three slides. Slide 2 of 3. Aspirin should not be recommended for CVD prevention for adults with diabetes at low CVD risk (10-year CVD risk <5%, such as in men <50 and women <60 years of age with no major additional CVD risk factors), since the potential adverse effects from bleeding likely offset the potential benefits (C) In patients in these age groups with multiple other risk factors (e.g., 10-year risk 5%-10%) clinical judgment is required (E) However, aspirin is no longer recommended for those at low CVD risk (women under age 60 years and men under age 50 years with no major CVD risk factors; 10-year CVD risk <5%), as the low benefit is likely to be outweighed by the risks of significant bleeding. Clinical judgment should be used for those at intermediate risk (younger patients with one or more risk factors, or older patients with no risk factors; those with 10-year CVD risk of 5–10%) until further research is available. Use of aspirin in patients under the age of 21 years is contraindicated due to the associated risk of Reye syndrome. ADA. VI. Prevention, Management of Complications. Diabetes Care 2013;36(suppl 1):S33. Reference. American Diabetes Association. Standards of medical care in diabetes—2013. Diabetes Care 2013;36(suppl 1):S33.")
48
Recommendations: Antiplatelet Agents (3)
Use aspirin therapy (75–162 mg/day) Secondary prevention strategy in those with diabetes with a history of CVD (A) For patients with CVD and documented aspirin allergy Clopidogrel (75 mg/day) should be used (B) Combination therapy with aspirin (75–162 mg/day) and clopidogrel (75 mg/day) Reasonable for up to a year after an acute coronary syndrome (B) Recommendations for the use of antiplatelet agents1 are summarized in three slides Slide 3 of 3 Use aspirin therapy ( mg/day) as a secondary prevention strategy in those with diabetes with a history of CVD (A) For patients with CVD and documented aspirin allergy, clopidogrel (75 mg/day) should be used (B) Combination therapy with ASA ( mg/day) and clopidogrel (75 mg/day) is reasonable for up to a year after an acute coronary syndrome (B) Clopidogrel has been demonstrated to reduce CVD events in diabetic individuals2 It is recommended as adjunctive therapy in the first year after an acute coronary syndrome or as alternative therapy in aspirin-intolerant patients ADA. VI. Prevention, Management of Complications. Diabetes Care 2013;36(suppl 1):S33-S34. References American Diabetes Association. Standards of medical care in diabetes—2013. Diabetes Care 2013;36(suppl 1):S33-S34. Bhatt DL, Marso SP, Hirsch AT, Ringleb PA, Hacke W, Topol EJ. Amplified benefit of clopidogrel versus aspirin in patients with diabetes mellitus. Am J Cardiol 2002;90:
 Secondary prevention strategy in those with diabetes with a history of CVD (A) For patients with CVD and documented aspirin allergy. Clopidogrel (75 mg/day) should be used (B) Combination therapy with aspirin (75–162 mg/day) and clopidogrel (75 mg/day) Reasonable for up to a year after an acute coronary syndrome (B) Recommendations for the use of antiplatelet agents1 are summarized in three slides. Slide 3 of 3. Use aspirin therapy ( mg/day) as a secondary prevention strategy in those with diabetes with a history of CVD (A) For patients with CVD and documented aspirin allergy, clopidogrel (75 mg/day) should be used (B) Combination therapy with ASA ( mg/day) and clopidogrel (75 mg/day) is reasonable for up to a year after an acute coronary syndrome (B) Clopidogrel has been demonstrated to reduce CVD events in diabetic individuals2. It is recommended as adjunctive therapy in the first year after an acute coronary syndrome or as alternative therapy in aspirin-intolerant patients. ADA. VI. Prevention, Management of Complications. Diabetes Care 2013;36(suppl 1):S33-S34. References. American Diabetes Association. Standards of medical care in diabetes—2013. Diabetes Care 2013;36(suppl 1):S33-S34. Bhatt DL, Marso SP, Hirsch AT, Ringleb PA, Hacke W, Topol EJ. Amplified benefit of clopidogrel versus aspirin in patients with diabetes mellitus. Am J Cardiol 2002;90:")
49
Diabetes Mellitus (Type II): Effect of Intensive Glycemic Control
United Kingdom Prospective Diabetes Study (UKPDS) Year Follow-Up Sulphonylurea vs Conventional Therapy Insulin vs Conventional Therapy Intensive glycemic control in DM reduces the long-term risk of myocardial infarction Holman RR et al. NEJM 2008;359:
 10-Year Follow-Up. Sulphonylurea vs. Conventional Therapy. Insulin vs. Conventional Therapy. Intensive glycemic control in DM reduces the long-term risk of myocardial infarction. Holman RR et al. NEJM 2008;359:")
50
Glycemic Legacy? N Engl J Med 2008;359:

51
Recent Trials Show No Reduction in CV Events with More Intensive Glycemic Control
ACCORD: Primary Outcome ADVANCE: Primary Outcome 25 20 15 10 5 Years Standard therapy Intensive therapy 25 20 15 10 5 Standard therapy Intensive therapy Patients with events (%) Cumulative incidence (%) Months of follow-up Number at Risk Intensive Standard Number at Risk Intensive Standard 1ACCORD Study Group. N Engl J Med. 2008;358: 2ADVANCE Collaborative Group. N Engl J Med. 2008;358: 51
 Cumulative incidence (%) Months of follow-up. Number at Risk. Intensive Standard Number at Risk. Intensive Standard ACCORD Study Group. N Engl J Med. 2008;358: ADVANCE Collaborative Group. N Engl J Med. 2008;358:")
52
Was Intensive Glycemic Control Harmful
Was Intensive Glycemic Control Harmful? A closer look at ACCORD AND ADVANCE ACCORD was discontinued early due to increased total and CVD mortality in the intensive arm. VA Diabetes Trial showed severe hypoglycemia to be a powerful predictor of CVD events. A recent analysis of ACCORD (Diabetes Care, May 2010) showed deaths related to unsuccessful intensive therapy where A1c remained high. But in both ACCORD AND ADVANCE, those without macrovascular disease at baseline had an actual benefit in the primary endpoint.
 showed deaths related to unsuccessful intensive therapy where A1c remained high. But in both ACCORD AND ADVANCE, those without macrovascular disease at baseline had an actual benefit in the primary endpoint.")
53
Metabolic Memory and Glycemic Legacy
UKPDS vs. VADT Start of intensive therapy in VADT Start of intensive therapy in UKPDS 9.5 Drives risk of Complications 9.0 8.5 8.0 Risk of complications continues despite glycemic control A1C (%) Bad Glycemic Legacy Reference Del Prato S. Diabetalogia. 2009;52: Key Points and Additional Details This figure is a hypothetical representation of the natural history of patients with T2DM in the VADT study. The upper dashed line represents the time course of HbA1c estimated by the average glucose profile in the UKPDS, based on the premise that duration of diabetes in VADT would be similar to that in UKPDS. The lower dashed line represents the ideal time course of glycemic control (early and sustained at time of diagnosis). The solid line to the right represents the time course of HbA1c in the VADT (mean time between diagnosis and start of intensive treatment in VADT = 11.4 years). Intensive therapy implemented in VADT resulted in a rapid lowering of plasma glucose levels close to the ideal target. However, this time course is far from the ideal (ie, the achievement and maintenance of near-normal glycemia from the time of diagnosis). The difference between the ideal and the actual time course of glycemic control represents a time period that may have had some impact on the effect of subsequent tight glycemic control (ie, the glycemic legacy). 7.5 7.0 Ideal course = early and sustained glycemic control 6.5 6.0 1 2 3 4 5 6 7 8 9 10 11 12 13 14 15 16 17 Time Since Diagnosis (years) Del Prato S. Diabetalogia. 2009;52:
 Bad Glycemic Legacy. Reference. Del Prato S. Diabetalogia. 2009;52: Key Points and Additional Details. This figure is a hypothetical representation of the natural history of patients with T2DM in the VADT study. The upper dashed line represents the time course of HbA1c estimated by the average glucose profile in the UKPDS, based on the premise that duration of diabetes in VADT would be similar to that in UKPDS. The lower dashed line represents the ideal time course of glycemic control (early and sustained at time of diagnosis). The solid line to the right represents the time course of HbA1c in the VADT (mean time between diagnosis and start of intensive treatment in VADT = 11.4 years). Intensive therapy implemented in VADT resulted in a rapid lowering of plasma glucose levels close to the ideal target. However, this time course is far from the ideal (ie, the achievement and maintenance of near-normal glycemia from the time of diagnosis). The difference between the ideal and the actual time course of glycemic control represents a time period that may have had some impact on the effect of subsequent tight glycemic control (ie, the glycemic legacy) Ideal course = early and sustained glycemic control Time Since Diagnosis (years) Del Prato S. Diabetalogia. 2009;52:")
54
American Diabetes Association 2012 Standards of Medical Care: HbA1c Goals
A reasonable A1C goal for many nonpregnant adults is <7% due to efficacy in reducing microvascular complications. Consider more stringent A1C goals (such as <6.5%) for selected patients, if this can be achieved without significant hypoglycemia or other adverse effects of treatment. Less stringent A1C goals (such as <8%) may be appropriate for patients with a history of severe hypoglycemia, limited life expectancy, advanced microvascular or macrovascular complications, and extensive comorbid conditions and for those with longstanding diabetes in whom the general goal is difficult to attain.
 for selected patients, if this can be achieved without significant hypoglycemia or other adverse effects of treatment. Less stringent A1C goals (such as <8%) may be appropriate for patients with a history of severe hypoglycemia, limited life expectancy, advanced microvascular or macrovascular complications, and extensive comorbid conditions and for those with longstanding diabetes in whom the general goal is difficult to attain.")
56
ADA Treatment Algorithm

57
Effects of α/γ PPAR Activation
Nuclear receptors that function as transcription factors regulating the expression of genes ↑ Insulin sensitivity a Primary g effect is to improve insulin sensitivity g ↑ Fatty acid oxidation ↓ VLDL-TG ↑ Fatty acid uptake Anti-inflammatory ↑ apo AI, HDL Primary a effect is to improve plasma lipid profile ↑ Beta cell function ↑ fatty acid uptake ↑ Adiponectin secretion Anti- inflammatory heart, liver, muscle, vasculature Adipocytes Muscle

58
Pioglitazone - PPAR g Activator
Lincoff et al. JAMA 2007;298: Meta-Analysis Death, MI, or Stroke – 16,390 Pts HR = 0.82 (95% CI, ) p = 0.005 PERISCOPE Trial Coronary Intravascular Ultrasound Nissen et al. JAMA 2008;299:1561. p <0.001 p = 0.44 p = between groups 58
 p = PERISCOPE Trial. Coronary Intravascular Ultrasound. Nissen et al. JAMA 2008;299:1561. p < p = p = between groups. 58.")
59
Aleglitazar - Balanced PPAR a/g Agonist
SYNCHRONY Phase 2 Trial p<0.0001 p=0.006 HbA1c Absolute change from baseline p-values vs placebo Henry R et al. Lancet 2009;374:126.

60
Aleglitazar in ACS and T2DM
AleCardio trial Study Hypothesis: Aleglitazar, added to standard of care of pts with T2DM and recent acute coronary syndrome (ACS), would reduce cardiovascular mortality and morbidity. phase 3 superiority trial randomized, placebo-controlled, double-blind, multicenter
, would reduce cardiovascular mortality and morbidity. phase 3. superiority trial. randomized, placebo-controlled, double-blind, multicenter.")
61
Primary Efficacy Endpoint
Cardiovascular Death, Non-Fatal MI, Non-Fatal Stroke HR = 0.96 (95% CI, ) p = 0.57 No. at risk: Placebo Aleglitazar 61
 p = No. at risk: Placebo Aleglitazar")
62
Mechanisms of DPP-4 Inhibitor and GLP-1

63
Potential Mechanisms of reducing CV outcomes with DPP-4 inhibitors
Fadini,G, Cardiovascular effects of DPP-4 Inhibition, Vascular Pharm 2011

64
DPP-4 Inhibitors and CV Events: A Meta-analysis
First Author DPP4i Comparator Risk Ratio M-H, Random, 95% CI Events Total Weight Aschner 1 528 3 522 3.7% 0.33 (0.03, 3.16) Bosi E 300 2 294 3.3% 0.49 (0.04, 5.37) Chan 10 65 12 26 37.7% 0.33 (0.16, 0.67) Defronzo 264 64 2.1% 1.23 (0.06, 25.54) Foley 546 Not estimable Foley Je 29 30 NCT 4 291 74 8.6% 0.34 (0.08, 1.48) NCT 20 16 1.9% 0.27 (0.01, 6.21) NCT 284 2.2% 9.00 (0.49, ) NCT 107 106 NCT 5 391 83 2.3% 2.36 (0.13, 42.22) Pfuntzer 335 7 328 7.7% 0.28 (0.06, 1.34) Pi-Sunyer 262 92 Rosenstock 11 306 95 11.9% 1.14 (0.32, 4.00) Rosenstock J 396 202 Schweitzer 169 166 4.9% 0.98 (0.14, 6.89) Schweitzer A 526 254 2.0% 0.10 (0.00, 2.01) Williams-Herman 179 364 11.7% 0.55 (0.16, 1.96) Total (95% CI) 4998 3546 100.0% 0.48 (0.31,0.75) Total events 45 46 Heterogeneity: Tau2 = 0.00; Chi2 = 11.22, df = 12 (P = 0.51); I2 = 0% Test for overall effect: Z = 3.28 (P = 0.001) 0.001 0.1 1 10 1000 DPP4i better DPP4i worse 52% reduction in risk for CV events compared to other oral agents or placebo. Patil HR, et al. Am J Cardiol. 2012;110(6):
 Bosi E % 0.49 (0.04, 5.37) Chan % 0.33 (0.16, 0.67) Defronzo % 1.23 (0.06, 25.54) Foley Not estimable. Foley Je NCT % 0.34 (0.08, 1.48) NCT % 0.27 (0.01, 6.21) NCT % 9.00 (0.49, ) NCT NCT % 2.36 (0.13, 42.22) Pfuntzer % 0.28 (0.06, 1.34) Pi-Sunyer Rosenstock % 1.14 (0.32, 4.00) Rosenstock J Schweitzer % 0.98 (0.14, 6.89) Schweitzer A % 0.10 (0.00, 2.01) Williams-Herman % 0.55 (0.16, 1.96) Total (95% CI) % 0.48 (0.31,0.75) Total events Heterogeneity: Tau2 = 0.00; Chi2 = 11.22, df = 12 (P = 0.51); I2 = 0% Test for overall effect: Z = 3.28 (P = 0.001) DPP4i better. DPP4i worse. 52% reduction in risk for CV events compared to other oral agents or placebo. Patil HR, et al. Am J Cardiol. 2012;110(6):")
65
(pnoninferiority < 0.001)
SAVOR-TIMI 53 Trial design: Patients with type 2 diabetes mellitus (DM2) and established CV disease or multiple risk factors were randomized to either saxagliptin 5 mg daily or placebo. Patients were followed for a median of 2.1 years. Results (pnoninferiority < 0.001) Primary endpoint (CV death/MI/stroke) for saxagliptin vs. placebo: 7.3% vs. 7.2%; HR 1.00, 95% CI ; pnoninferiority < for, psuperiority = 0.99 CV death: 3.2 vs. 2.9%, p = 0.72; MI: 3.2% vs. 3.4%, p = 0.52; all-cause mortality: 4.9% vs. 4.2%, p = 0.15 HbA1c at 2 years: 7.5% vs. 7.8%, p < 0.001 10 7.3 7.2 % 5 Conclusions Saxagliptin, a DPP-4 inhibitor, is not associated with an excess of CV events as compared with placebo in patients with DM2 and either established CV disease or risk factors The upper margin of 95% CI of 1.12 for the primary endpoint was lower than the threshold set by the FDA (1.3) for postmarketing trial, supporting its CV safety in diabetic patients Primary endpoint Saxagliptin (n = 8,280) Placebo (n = 8,212) Scirica BM. N Engl J Med 2013;Sep 2:[Epub]
 and established CV disease or multiple risk factors were randomized to either saxagliptin 5 mg daily or placebo. Patients were followed for a median of 2.1 years. Results. (pnoninferiority < 0.001) Primary endpoint (CV death/MI/stroke) for saxagliptin vs. placebo: 7.3% vs. 7.2%; HR 1.00, 95% CI ; pnoninferiority < for, psuperiority = CV death: 3.2 vs. 2.9%, p = 0.72; MI: 3.2% vs. 3.4%, p = 0.52; all-cause mortality: 4.9% vs. 4.2%, p = HbA1c at 2 years: 7.5% vs. 7.8%, p < % 5. Conclusions. Saxagliptin, a DPP-4 inhibitor, is not associated with an excess of CV events as compared with placebo in patients with DM2 and either established CV disease or risk factors. The upper margin of 95% CI of 1.12 for the primary endpoint was lower than the threshold set by the FDA (1.3) for postmarketing trial, supporting its CV safety in diabetic patients. Primary endpoint. Saxagliptin. (n = 8,280) Placebo. (n = 8,212) Scirica BM. N Engl J Med 2013;Sep 2:[Epub]")
66
(pnoninferiority < 0.001)
EXAMINE Trial design: Patients with type 2 diabetes mellitus (DM2) and recent ACS were randomized to either alogliptin 25 mg daily or placebo. Patients were followed for 3 years. Results (pnoninferiority < 0.001) Primary endpoint (CV death/MI/stroke) for alogliptin vs. placebo: 11.3% vs. 11.8%; HR 0.96, upper boundary of 95% CI = 1.16; pnoninferiority < 0.001; psuperiority = 0.32 CV death: 3.3% vs. 4.1%, p = 0.10; MI: 6.9% vs. 6.5%, p = 0.47; all-cause mortality: 5.7% vs. 6.5%, p = 0.23 HbA1c ↓ at 3 years: -0.33% vs. 0.03%, p < 0.001 20 11.8 11.3 % 10 Conclusions Alogliptin, a DPP-4 inhibitor, is not associated with an excess of CV events as compared with placebo in patients with DM2 and recent ACS The upper margin of 95% CI of 1.16 for the primary endpoint was lower than the threshold set by the FDA (1.3) for postmarketing trial, supporting its CV safety in diabetic patients Primary endpoint Alogliptin (n = 2,701) Placebo (n = 2,679) White WB. N Engl J Med 2013;Sep 2:[Epub]
 and recent ACS were randomized to either alogliptin 25 mg daily or placebo. Patients were followed for 3 years. Results. (pnoninferiority < 0.001) Primary endpoint (CV death/MI/stroke) for alogliptin vs. placebo: 11.3% vs. 11.8%; HR 0.96, upper boundary of 95% CI = 1.16; pnoninferiority < 0.001; psuperiority = CV death: 3.3% vs. 4.1%, p = 0.10; MI: 6.9% vs. 6.5%, p = 0.47; all-cause mortality: 5.7% vs. 6.5%, p = HbA1c ↓ at 3 years: -0.33% vs. 0.03%, p < % 10. Conclusions. Alogliptin, a DPP-4 inhibitor, is not associated with an excess of CV events as compared with placebo in patients with DM2 and recent ACS. The upper margin of 95% CI of 1.16 for the primary endpoint was lower than the threshold set by the FDA (1.3) for postmarketing trial, supporting its CV safety in diabetic patients. Primary endpoint. Alogliptin. (n = 2,701) Placebo. (n = 2,679) White WB. N Engl J Med 2013;Sep 2:[Epub]")
67
week weight reduction exenatide 67 REQUIRED DISCUSSION POINTS:
Weight: 25% of the patients lost on average 26.2 lbs (11.4% of baseline body weight) Overall, 81% of patients had reductions in body weight SLIDE BACKGROUND: Patients in this analysis received either 5 or 10 mcg BYETTA BID in the 30-week placebo- controlled trials, followed by 5 mcg BID for 4 weeks and 10 mcg BID thereafter All patients continued any pre-existing treatment regimens of MET and/or SFU throughout the trials The 82-week completer cohort (n = 314) consisted of those patients who were treated with BYETTA for 82 weeks by the time of this analysis Weight-change quartiles consisted of 4 subgroups with approximately equal numbers of patients (n = 78 or 79) for each treatment arm, with Quartile 1 consisting of the 25% of patients with the greatest weight reductions, Quartile 4 consisting of the 25% of patients with the smallest weight reductions (or weight gains), and Quartiles 2 and 3 consisting of those with intermediate weight changes Baseline weights: Quartile 1: lbs, Quartile 2: lbs, Quartile 3: lbs, Quartile 4: lbs week weight reduction 67
 Overall, 81% of patients had reductions in body weight. SLIDE BACKGROUND: Patients in this analysis received either 5 or 10 mcg BYETTA BID in the 30-week placebo- controlled trials, followed by 5 mcg BID for 4 weeks and 10 mcg BID thereafter. All patients continued any pre-existing treatment regimens of MET and/or SFU throughout the trials. The 82-week completer cohort (n = 314) consisted of those patients who were treated with BYETTA for 82 weeks by the time of this analysis. Weight-change quartiles consisted of 4 subgroups with approximately equal numbers of patients (n = 78 or 79) for each treatment arm, with Quartile 1 consisting of the 25% of patients with the greatest weight reductions, Quartile 4 consisting of the 25% of patients with the smallest weight reductions (or weight gains), and Quartiles 2 and 3 consisting of those with intermediate weight changes. Baseline weights: Quartile 1: lbs, Quartile 2: lbs, Quartile 3: lbs, Quartile 4: lbs. week weight reduction. 67.")
68
Exenatide and CV outcomes- 430,000 patients-near 40,000 on exenatide
Risk of Cardiovascular Disease Events in Patients With Type 2 Diabetes Prescribed the Glucagon-Like Peptide 1 (GLP-1) Receptor Agonist Exenatide Twice Daily orOther Glucose-Lowering Therapies A retrospective analysis of the LifeLink database JENNIE H. BEST, PHD, Diabetes Care 34:90–95, 2011 1
 Receptor Agonist Exenatide Twice Daily orOther Glucose-Lowering Therapies A retrospective analysis of the LifeLink database. JENNIE H. BEST, PHD, Diabetes Care 34:90–95,")
70
Canagliflozin Efficacy

71
Other Meds with Glycemic Benefit
Fast-acting Bromocryptine- drop 0.5-1% central dopaminergic effect on decreasing peripheral sympathetic tone decreasing insulin resistance Decreases CV outcomes 50% in 1 year Colsevelam- drop 0.5% lipid benefit (Ranolazine) drop % Decrease angina ( or equivalent) Decreases arrhythmia Improves diastolic dysfunction, thus-decreases edema of Pio-, Decreases HgA1c, FBS in glucose dependent fashion , no hypoglycemia
 drop % Decrease angina ( or equivalent) Decreases arrhythmia. Improves diastolic dysfunction, thus-decreases edema of Pio-, Decreases HgA1c, FBS in glucose dependent fashion , no hypoglycemia.")
72
Nonfatal MI, nonfatal stroke, or CV death
Diabetes Mellitus: Effect of Blood Pressure Control Action to Control Cardiovascular Risk in Diabetes (ACCORD) Blood Pressure Trial 4,733 diabetic patients randomized to intensive BP control (target SBP <120 mm Hg) or standard BP control (target SBP <140 mm Hg) for 4.7 years Intensive BP control in DM does not reduce a composite of adverse CV events, but does reduce the rate of stroke HR=0.88 95% CI ( ) HR=0.59 95% CI ( ) Nonfatal MI, nonfatal stroke, or CV death Total Stroke BP=Blood pressure, DM=Diabetes mellitus, HR=Hazard ratio, SBP=Systolic blood pressure ACCORD study group. NEJM 2010
 Blood Pressure Trial. 4,733 diabetic patients randomized to intensive BP control (target SBP <120 mm Hg) or standard BP control (target SBP <140 mm Hg) for 4.7 years. Intensive BP control in DM does not reduce a composite of adverse CV events, but does reduce the rate of stroke. HR= % CI ( ) HR= % CI ( ) Nonfatal MI, nonfatal stroke, or CV death. Total Stroke. BP=Blood pressure, DM=Diabetes mellitus, HR=Hazard ratio, SBP=Systolic blood pressure. ACCORD study group. NEJM")
73
Treat if BP >140/90; Aim for <140/90
Recommendation #5 5. In patients aged ≥18 years with diabetes, initiate pharmacologic treatment at systolic BP ≥140mmHg or diastolic BP ≥90mmHg and treat to a goal systolic BP <140mmHg and goal diastolic BP <90mmHg. (Expert Opinion–Grade E) For Adults with diabetes aim for the same BP goals as in the general population Treat if BP >140/90; Aim for <140/90
 For Adults with diabetes aim for the same BP goals as in the general population. Treat if BP >140/90; Aim for <140/90.")
74
Statins reduce CV events 21% in diabetics (similar to non-diabetics)
Diabetes Mellitus: Effect of an HMG-CoA Reductase Inhibitor Meta-analysis of 18,686 patients with DM randomized to treatment with a HMG-CoA Reductase Inhibitor Statins reduce CV events 21% in diabetics (similar to non-diabetics) Cholesterol Treatment Trialists’ (CTT) Collaborators. Lancet 2008;37:117-25
 Cholesterol Treatment Trialists’ (CTT) Collaborators. Lancet 2008;37:")
77
High, Moderate and Low Intensity Statin Dosages

78
It has become well accepted that moderate weight loss improves cardiovascular and metabolic risk factors. In a study by Case and colleagues of obese individuals enrolled in a medically supervised rapid weight loss program study, 1 year of consecutive patients’ charts was reviewed to determine the response to diet-induced weight loss. Out of 185 individuals, 125 (68%) met the NCEP definition of the metabolic syndrome. At 4 weeks, a moderate decrease in weight (6.5%) induced by a very low calorie diet resulted in substantial reductions of systolic (11.1 mm Hg) and diastolic (5.8 mm Hg) blood pressure, glucose (17 mg/dL), triglycerides (94 mg/dL) and total cholesterol (37 mg/dL) (all P<0.001). These improvements were sustained at the end of active weight loss (average 16.7 weeks; total weight loss 15.1%), with further significant reductions in blood pressure and triglycerides. Weight loss was related to the changes in each criterion of the metabolic syndrome. The authors concluded that moderate weight loss markedly improved all aspects of the metabolic syndrome. Case CC, Jones PH, Nelson K, O’Brian Smith E, Ballantyne CM. Impact of weight loss on the metabolic syndrome. Diabetes Obes Metab. 2002;4:
 induced by a very low calorie diet resulted in substantial reductions of systolic (11.1 mm Hg) and diastolic (5.8 mm Hg) blood pressure, glucose (17 mg/dL), triglycerides (94 mg/dL) and total cholesterol (37 mg/dL) (all P<0.001). These improvements were sustained at the end of active weight loss (average 16.7 weeks; total weight loss 15.1%), with further significant reductions in blood pressure and triglycerides. Weight loss was related to the changes in each criterion of the metabolic syndrome. The authors concluded that moderate weight loss markedly improved all aspects of the metabolic syndrome. Case CC, Jones PH, Nelson K, O’Brian Smith E, Ballantyne CM. Impact of weight loss on the metabolic syndrome. Diabetes Obes Metab. 2002;4:")
79
Diabetes Prevention Program: Reduction in Diabetes Incidence
Lifestyle reduced the incidence of diabetes by 58% (95% CI, 48%-66%) and metformin reduced the incidence by 31% (95% CI, 17%-43%). The incidence of diabetes was 39% lower (95% CI, 24%-51%) in the lifestyle group than in the metformin group. Treatment effects did not differ significantly according to sex or to race or ethnic group. The lifestyle intervention was highly effective in all subgroups. Its effect was significantly greater among persons with lower base-line glucose concentrations two hours after a glucose load than among those with higher base-line glucose values. The advantage of lifestyle intervention over metformin was greater in older persons and those with a lower body-mass-index than in younger persons and those with a higher body-mass-index. The effect of metformin was less with a lower body-mass-index or a lower fasting glucose concentration than with higher values for those variables. The investigators concluded that, compared with placebo, 1 case of diabetes can be prevented for every 7 persons treated with lifestyle changes for 3 years and for every 14 persons treated with metformin for 3 years. Diabetes Prevention Program Research Group. N Engl J Med. 2002;346:
 and metformin reduced the incidence by 31% (95% CI, 17%-43%). The incidence of diabetes was 39% lower (95% CI, 24%-51%) in the lifestyle group than in the metformin group. Treatment effects did not differ significantly according to sex or to race or ethnic group. The lifestyle intervention was highly effective in all subgroups. Its effect was significantly greater among persons with lower base-line glucose concentrations two hours after a glucose load than among those with higher base-line glucose values. The advantage of lifestyle intervention over metformin was greater in older persons and those with a lower body-mass-index than in younger persons and those with a higher body-mass-index. The effect of metformin was less with a lower body-mass-index or a lower fasting glucose concentration than with higher values for those variables. The investigators concluded that, compared with placebo, 1 case of diabetes can be prevented for every 7 persons treated with lifestyle changes for 3 years and for every 14 persons treated with metformin for 3 years. Diabetes Prevention Program Research Group. N Engl J Med. 2002;346:")
80
Look AHEAD (Action for Health in Diabetes): Trial Halted Early
Intensive lifestyle intervention resulted in1 Average 8.6% weight loss Significant reduction of A1C Reduction in several CVD risk factors However, trial halted after 11 years of follow-up because there was no significant difference in primary cardiovascular outcome between weight loss, standard care group Look AHEAD (Action for HEAlth in Diabetes) is a large clinical trial designed to determine whether long-term weight loss will improve glycemia and prevent cardiovascular events in subjects with type 2 diabetes1 One-year results of the intensive lifestyle intervention in this trial show an average of 8.6% weight loss, significant reduction of A1C, and reduction in several cardiovascular disease (CVD) risk factors, with benefits sustained at 4 years2 At the time this article was going to press, the Look AHEAD trial was halted early, after 11 years of follow-up, because there was no significant difference in the primary cardiovascular outcome between the weight loss and standard care group ( Multiple cardiovascular risk factors were improved with weight loss, and those participants on average were on fewer medications to achieve these improvements HR=0.95 ( ), p=0.51 NEJM June 24, 2013 1, 2. Look AHEAD Research Group. Diabetes Care. 2007;30: and Arch Intern Med. 2010;170:1566–1575; References Pi-Sunyer X, Blackburn G, Brancati FL, et al, for the Look AHEAD Research Group. Reduction in weight and cardiovascular disease risk factors in individuals with type 2 diabetes: one-year results of the Look AHEAD trial. Diabetes Care. 2007;30: Wing RR, Egan C, Bahnson JL, et al, for the Look AHEAD Research Group. Long-term effects of a lifestyle intervention on weight and cardiovascular risk factors in individuals with type 2 diabetes mellitus: four-year results of the Look AHEAD trial. Arch Intern Med 2010;170:
 is a large clinical trial designed to determine whether long-term weight loss will improve glycemia and prevent cardiovascular events in subjects with type 2 diabetes1. One-year results of the intensive lifestyle intervention in this trial show an average of 8.6% weight loss, significant reduction of A1C, and reduction in several cardiovascular disease (CVD) risk factors, with benefits sustained at 4 years2. At the time this article was going to press, the Look AHEAD trial was halted early, after 11 years of follow-up, because there was no significant difference in the primary cardiovascular outcome between the weight loss and standard care group ( Multiple cardiovascular risk factors were improved with weight loss, and those participants on average were on fewer medications to achieve these improvements. HR=0.95 ( ), p=0.51. NEJM June 24, , 2. Look AHEAD Research Group. Diabetes Care. 2007;30: and Arch Intern Med. 2010;170:1566–1575; References. Pi-Sunyer X, Blackburn G, Brancati FL, et al, for the Look AHEAD Research Group. Reduction in weight and cardiovascular disease risk factors in individuals with type 2 diabetes: one-year results of the Look AHEAD trial. Diabetes Care. 2007;30: Wing RR, Egan C, Bahnson JL, et al, for the Look AHEAD Research Group. Long-term effects of a lifestyle intervention on weight and cardiovascular risk factors in individuals with type 2 diabetes mellitus: four-year results of the Look AHEAD trial. Arch Intern Med 2010;170:")
81
Look Ahead Trial Risk Factor Differences
Diminished differences between groups over time: 1) weight 2) physical fitness, 3) waist circumference ) HbA1c. This set of six slides summarize recommendations for screening, treatment, and goals for dyslipidemia/lipid management in patients with diabetes Slide 5 of 6 – Treatment Recommendations and Goals (Slide 4 of 5) If drug-treated patients do not reach the targets outlined on the previous slide (Slide 3 of 5) on maximal tolerated statin therapy, a reduction in LDL cholesterol of ~30-40% from baseline is an alternative therapeutic goal (A) Triglyceride levels <150 mg/dl (1.7 mmol/l) and HDL cholesterol >40 mg/dl (1.0 mm/l) in men and >50 mg/dl (1.3 mmol/l) in women, are desirable (C); however, LDL cholesterol-targeting statin therapy remains the preferred strategy (A) Reference American Diabetes Association. Standards of medical care in diabetes—2013. Diabetes Care 2013;36(suppl 1):S31.
 weight. 2) physical fitness, 3) waist circumference 4) HbA1c. This set of six slides summarize recommendations for screening, treatment, and goals for dyslipidemia/lipid management in patients with diabetes. Slide 5 of 6 – Treatment Recommendations and Goals (Slide 4 of 5) If drug-treated patients do not reach the targets outlined on the previous slide (Slide 3 of 5) on maximal tolerated statin therapy, a reduction in LDL cholesterol of ~30-40% from baseline is an alternative therapeutic goal (A) Triglyceride levels <150 mg/dl (1.7 mmol/l) and HDL cholesterol >40 mg/dl (1.0 mm/l) in men and >50 mg/dl (1.3 mmol/l) in women, are desirable (C); however, LDL cholesterol-targeting statin therapy remains the preferred strategy (A) Reference. American Diabetes Association. Standards of medical care in diabetes—2013. Diabetes Care 2013;36(suppl 1):S31.")
82
PREDIMED STUDY (n=7447): Primary Prevention of High Risk Pts with DM or 3+ Risk Factors Randomized to Mediterranean Diet with Extra Virgin Olive Oil or Nuts vs. AHA Diet

83
ADA Dietary Recommendations ) Individualized medical nutrition therapy (MNT) by dietitian 2) Balance energy expenditure with intake, reducing intake to promote weight loss 3) Optimal mix of macronutrients with a variety of eating patterns acceptable taking into account personal preferences and metabolic goals 4) Amount of carbohydrates may be most important factor influencing glycemic response after eating, so monitoring carbohydrate intake is a key strategy and choosing intake from vegetables, fruits, whole grains, legumes and dairy products 5) substitute low-glycemic load foods for higher glycemic load foods 6) Consumption of fiber and whole grains
 Individualized medical nutrition therapy (MNT) by dietitian 2) Balance energy expenditure with intake, reducing intake to promote weight loss 3) Optimal mix of macronutrients with a variety of eating patterns acceptable taking into account personal preferences and metabolic goals 4) Amount of carbohydrates may be most important factor influencing glycemic response after eating, so monitoring carbohydrate intake is a key strategy and choosing intake from vegetables, fruits, whole grains, legumes and dairy products 5) substitute low-glycemic load foods for higher glycemic load foods 6) Consumption of fiber and whole grains")
84
LDL-C: Advise adults who would benefit from LDL-C lowering* to:
IIa IIb III A Consume a dietary pattern that emphasizes intake of vegetables, fruits, and whole grains; includes low-fat dairy products, poultry, fish, legumes, nontropical vegetable oils and nuts; and limits intake of sweets, sugar-sweetened beverages, and red meats. Adapt this dietary pattern to appropriate calorie requirements, personal and cultural food preferences, and nutrition therapy for other medical conditions (including diabetes). Achieve this pattern by following plans such as the DASH dietary pattern, the U.S. Department of Agriculture (USDA) Food Pattern, or the AHA Diet. *Refer to 2013 Blood Cholesterol Guideline for guidance on who would benefit from LDL-C lowering.
. Achieve this pattern by following plans such as the DASH dietary pattern, the U.S. Department of Agriculture (USDA) Food Pattern, or the AHA Diet. *Refer to 2013 Blood Cholesterol Guideline for guidance on who would benefit from LDL-C lowering.")
85
Tobacco Cessation Algorithm
Ask and document tobacco use status Prevent Relapse Congratulate successes Encourage Discuss benefits experienced by patient Address weight gain, negative mood, and lack of support Recent Quitter (<6 months) Current User Advise Provide a strong, personalized message Assess Readiness to quit in next 30 days Not Ready Increase Motivation Relevance to personal situation Risks: short and long-term, environmental Rewards: potential benefits of quitting Roadblocks: identify barriers and solutions Repetition: repeat motivational intervention Reassess readiness to quit Ready Assist: Negotiate plan STAR** Discuss pharmacotherapy Social support Provide educational materials **STAR Set quit date Tell family, friends, and coworkers Anticipate challenges: withdrawal, breaks Remove tobacco from the house, car etc. This slide provides a simple approach to assisting patients with smoking cessation. Arrange Follow-up to check plan or adjust meds Call right before and after quit date Weekly follow-up x 2 weeks, then monthly x 6 months Ask about difficulties (withdrawal, depressed mood) Build upon successes Seek commitment to stay tobacco-free 85
 Current User. Advise Provide a strong, personalized message. Assess Readiness to quit in next 30 days. Not Ready. Increase Motivation. Relevance to personal situation. Risks: short and long-term, environmental. Rewards: potential benefits of quitting. Roadblocks: identify barriers and solutions. Repetition: repeat motivational intervention. Reassess readiness to quit. Ready. Assist: Negotiate plan. STAR** Discuss pharmacotherapy. Social support. Provide educational materials. **STAR. Set quit date. Tell family, friends, and coworkers. Anticipate challenges: withdrawal, breaks. Remove tobacco from the house, car etc. This slide provides a simple approach to assisting patients with smoking cessation. Arrange Follow-up to check plan or adjust meds. Call right before and after quit date. Weekly follow-up x 2 weeks, then monthly x 6 months. Ask about difficulties (withdrawal, depressed mood) Build upon successes. Seek commitment to stay tobacco-free. 85.")
86
Recommendations: Physical Activity
Advise people with or without diabetes to perform at least 150 min/week of moderate-intensity aerobic physical activity (50–70% of maximum heart rate), spread over at least 3 days per week with no more than 2 consecutive days without exercise (A) In absence of contraindications, adults with type 2 diabetes should be encouraged to perform resistance training at least twice per week (A) Exercise is an important part of the diabetes management plan Regular exercise has been shown to improve blood glucose control, reduce cardiovascular risk factors, contribute to weight loss, and improve well being1 Regular exercise may also prevent type 2 diabetes in high-risk individuals2-4 A joint position statement by ADA and the American College of Sports Medicine summarizes the evidence for the benefits of exercise in people with type 2 diabetes5 Recommendations for physical activity for people with diabetes1 are summarized on this slide People with diabetes should be advised to perform at least 150 minutes per week of moderate-intensity aerobic physical activity (50-70% of maximum heart rate) (A) In the absence of contraindications, people with type 2 diabetes should be encouraged to perform resistance training three times per week (A) ADA. V. Diabetes Care. Diabetes Care 2013;36(suppl 1):S24. References American Diabetes Association. Standards of medical care in diabetes—2013. Diabetes Care 2013;36(suppl 1):S24-S25. Knowler WC, Barrett-Connor E, Fowler SE, et al, for the Diabetes Prevention Program Research Group. Reduction in the incidence of type 2 diabetes with lifestyle intervention or metformin. N Engl J Med 2002;346: Tuomilehto J, Lindström J, Eriksson JG, et al.; Finnish Diabetes Prevention Study Group. Prevention of type 2 diabetes mellitus by changes in lifestyle among subjects with impaired glucose tolerance. N Engl J Med 2001;344: Pan XR, Li GW, Hu YH, et al. Effects of diet and exercise in preventing NIDDM in people with impaired glucose tolerance. The Da Qing IGT and Diabetes Study. Diabetes Care 1997;20: Colberg SR, Sigal RJ, Fernhall B, et al. Exercise and type 2 diabetes. The American Collegoe of Sports Medicine and the American Diabetes Association: joint position statement. Diabetes Care 2010;33:
, spread over at least 3 days per week with no more than 2 consecutive days without exercise (A) In absence of contraindications, adults with type 2 diabetes should be encouraged to perform resistance training at least twice per week (A) Exercise is an important part of the diabetes management plan. Regular exercise has been shown to improve blood glucose control, reduce cardiovascular risk factors, contribute to weight loss, and improve well being1. Regular exercise may also prevent type 2 diabetes in high-risk individuals2-4. A joint position statement by ADA and the American College of Sports Medicine summarizes the evidence for the benefits of exercise in people with type 2 diabetes5. Recommendations for physical activity for people with diabetes1 are summarized on this slide. People with diabetes should be advised to perform at least 150 minutes per week of moderate-intensity aerobic physical activity (50-70% of maximum heart rate) (A) In the absence of contraindications, people with type 2 diabetes should be encouraged to perform resistance training three times per week (A) ADA. V. Diabetes Care. Diabetes Care 2013;36(suppl 1):S24. References. American Diabetes Association. Standards of medical care in diabetes—2013. Diabetes Care 2013;36(suppl 1):S24-S25. Knowler WC, Barrett-Connor E, Fowler SE, et al, for the Diabetes Prevention Program Research Group. Reduction in the incidence of type 2 diabetes with lifestyle intervention or metformin. N Engl J Med 2002;346: Tuomilehto J, Lindström J, Eriksson JG, et al.; Finnish Diabetes Prevention Study Group. Prevention of type 2 diabetes mellitus by changes in lifestyle among subjects with impaired glucose tolerance. N Engl J Med 2001;344: Pan XR, Li GW, Hu YH, et al. Effects of diet and exercise in preventing NIDDM in people with impaired glucose tolerance. The Da Qing IGT and Diabetes Study. Diabetes Care 1997;20: Colberg SR, Sigal RJ, Fernhall B, et al. Exercise and type 2 diabetes. The American Collegoe of Sports Medicine and the American Diabetes Association: joint position statement. Diabetes Care 2010;33:")
87
RCT Trial Assessment of Pedometer Interventions
N=277; 8 Trials Pedometer increased steps by 2500/day Review of 26 studies (n=2767) 8 RCT, 18 obs, mean age 49, 85% female, BMI 30, normotensive, 18 week duration Inactive at baseline: 1385 steps/day Use of a pedometer increased PA over baseline by 2183 steps/day or 26.9% Having a step goal was key predictor of increased activity Those without a step diary did not increase activity Decrease BP by 3.8 mm Hg/.3 mm Hg Bravata, DM et al. JAMA 2007; 298:
 8 RCT, 18 obs, mean age 49, 85% female, BMI 30, normotensive, 18 week duration. Inactive at baseline: 1385 steps/day. Use of a pedometer increased PA over baseline by 2183 steps/day or 26.9% Having a step goal was key predictor of increased activity. Those without a step diary did not increase activity. Decrease BP by 3.8 mm Hg/.3 mm Hg. Bravata, DM et al. JAMA 2007; 298:")
88
Nutrition, physical activity and NCD prevention
Up to 80% of heart disease, stroke and type 2 diabetes and over a third of the most common cancers could be prevented by eliminating obesity, unhealthy diets and physical inactivity Call for commitments at the global and national level to address these risk factors including: Control food supply, food information and marketing and promotion of energy-dense, nutrient-poor foods that are high in saturated, trans-fat, salt or refined sugars

89
Summary Most persons with diabetes will suffer and die from cardiovascular consequences Few persons with diabetes are appropriately controlled for key measures of A1c, BP, lipids, and weight. Combined control of risk factors can result in up to 50% reductions in risk for cardiovascular disease Greater adherence to lifestyle modifications and use of guideline-based and newer therapies can help us address remaining residual risks.

90
THANK YOU! Now Available
American Society for Preventive Cardiology:

Similar presentations


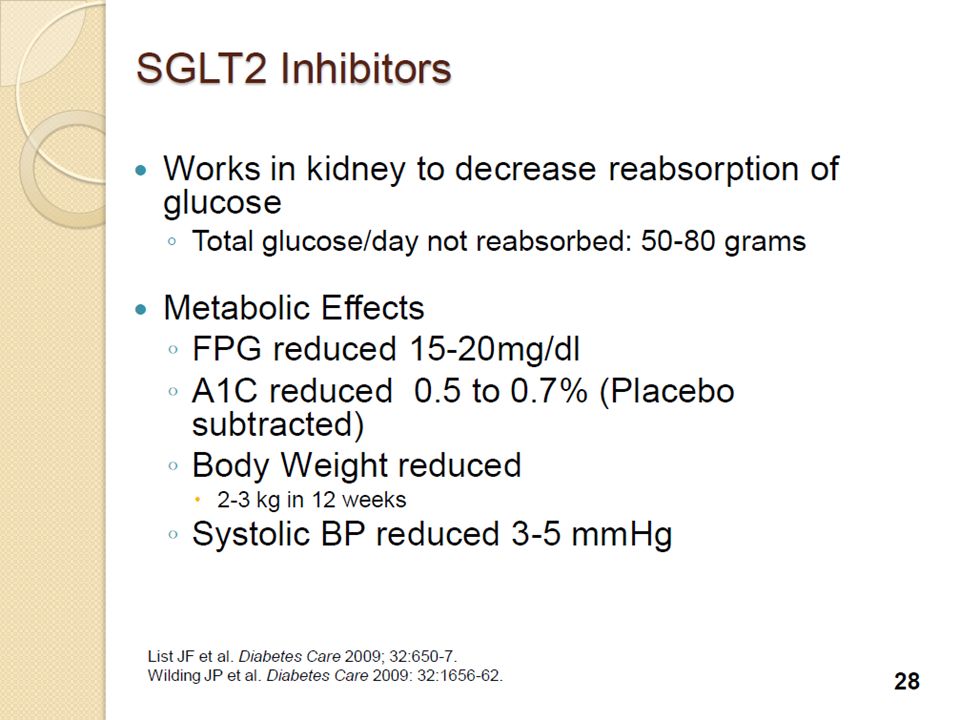


>")


