Download presentation
Presentation is loading. Please wait.

1
Decision making by AHP and ANP 東吳大學資訊管理學系 黃日鉦

2
The Theoretical Foundation of the AHP Analytic hierarchy process (AHP) was proposed by Saaty (1977, 1980) to model subjective decision-making processes in a hierarchical system. The applications of AHP can refer to corporate planning, portfolio selection, and benefit/cost analysis by government agencies for resource allocation purposes. All decision problems are considered as a hierarchical structure in the AHP

3
The general form of the AHP

4
The main four steps of the AHP Step 1. Set up the hierarchical system by decomposing the problem into a hierarchy of interrelated elements. Step 2. Compare the comparative weights between the attributes of the decision elements to form the reciprocal matrix. Step 3. Synthesize the individual subjective judgments and estimate the relative weights. Step 4. Aggregate the relative weights of the decision elements to determine the best alternatives/strategies.

5
, or If we wish to compare a set of n attributes pairwise according to their relative importance weights, where the attributes are denoted by and the weights are denoted by, then the pairwise comparisons can be represented as:, where By multiplying A by w yield

6
Since solving the above equation is the eigenvalue problem, we can derive the comparative weights by find the eigenvector w with respec to which satisfies, where is the largest eigenvalue of the matrix A. The ratio scale which is employed to compare the importance weight between criteria according to the linguistic meaning from 1 to 9 with respect to denote equal important to extreme important. Intensity135792,4,6,8 LinguisticEqualModerateStrongDemonstratedExtreme Intermediate value

7
Furthermore, in order to ensure the consistency of the subjective perception and the accuracy of the comparative weights, two indices, including the consistency indexes (C.I.) and the consistency ratio (C.R.), are suggested. The equation of the C.I. can be expressed as: C.I. = ( – n) / (n-1), where is the largest eigenvalue, and n denotes the numbers of the attributes. Saaty (1980) suggested that the value of the C.I. should not exceed 0.1 for a confident result. On the other hand, the C.R. can be calculated as: where R.I. refer to an random consistency index which is derived from a large sample of randomly generated reciprocal matrices using the scale
 / (n-1), where is the largest eigenvalue, and n denotes the numbers of the attributes. Saaty (1980) suggested that the value of the C.I. should not exceed 0.1 for a confident result. On the other hand, the C.R. can be calculated as: where R.I. refer to an random consistency index which is derived from a large sample of randomly generated reciprocal matrices using the scale.")
8
The R.I. with respect to different size matrix is shown as Number of elements 345678910111213 R.I.R.I. 0.520.891.111.251.351.401.45 1.49 1.511.541.56 The C.R. should be under 0.1 for a reliable result, and 0.2 is the maximum tolerated level.

9
Cogger and Yu ’ s method Let where Define the upper triangular matrix where Let D be the diagonal matrix where

10
From the above equations, we see that and

11
By incorporating the restriction of weights, we can obtain Inducing the above equation from bottom to top, we obtain

12
Mathematical programming method For the AHP, a near consistent matrix A with a small reciprocal multiplicative perturbation of a consistent matrix is given by:, where denotes the Hadamard product,is the matrix of weight ratios, and is the perturbation matrix, where From, it can be seen that and

13
On the other hand, the multiplicative perturbation can be transformed to an additive perturbation of a consistent matrix such that Since, where is the additive perturbation., we can rewrite the above equation as and On the basis of the equations above, it can be seen that = n if and only if all = 1 or = 0, which is equivalent to having all, indicates the consistent situation.

14
Therefore, the problem of finding weights and C.I. in the AHP is equivalent to solving the following mathematical programming problem

15
Applications and Limitations of the AHP Example (Saaty, 1996). A family of average income wanted to buy a house and identified eight criteria, that were important for them to select a best house. SIZE- Size of house TRANS- Transportation NGHBRHD- Neighborhood AGE- Age of house YARD- Yard space MOD- Modern facilities COND- General condition FINANCE- Financing

16
The hierarchical structure GOAL SIZETRANS NGHBRHD AGEYARDMODCOND FINANCE HOUSE AHOUSE BHOUSE C

17
FactorSizeTransNghbrhdAgeYardModCondFinanceEigenvector Size1537661/31/40.175 Trans1/511/35331/51/70.062 Nghbrhd1/3316341/21/50.103 Age1/71/51/611/31/41/71/80.019 Yard1/61/3 311/21/51/60.034 Mod1/61/31/44211/51/60.041 Cond35275511/20.221 Finance475866210.348

18
SizeABCPriorities A1590.743 B1/5140.194 C1/91/410.063 YardABCPriorities A1640.391 B1/611/30.091 C1/4310.218 TransABCPriorities A141/50.194 B1/411/90.063 C5910.743 MODABCPriorities A1960.770 B1/911/30.068 C1/6310.162 Nghbrhd ABCPriorities A1940.717 B1/911/40.066 C1/4410.217 ConABCPriorities A11/2 0.200 B2110.400 C211 AgeABCPriorities A1110.333 B111 C111 Finance ABCPriorities A11/71/50.072 B7130.650 C51/310.278

19
Synthesize the priorities CriteriaSizeTransNghbdAgeYardModCondFinance Weights0.1750.0620.1030.0190.0340.0410.2210.345 CriteriaSizeTransNghbdAgeYardModCondFinanceOverall A 0.7430.1940.7170.3330.6910.7700.2000.0720.346 B 0.1940.0630.0660.3330.0910.0680.4000.6490.369 C 0.0630.7430.2170.3330.2180.1620.4000.2790.285

20
Limitations of the AHP The problem of consistency ( if C.R.>0.1 ? ) Weighted geometric mean Weighted arithmetic mean
 Weighted geometric mean Weighted arithmetic mean.")
22
Limitations of the AHP The problem of scales [9,1] is evenly distributed; [1,1/9] is skewed to the right. Arrow’s independence of irrelevant alternatives (IIA) Weighting the reciprocal matrix with the largest number in each column for preserving the order (Belton and Gear, 1983).- A revised AHP
![Limitations of the AHP The problem of scales [9,1] is evenly distributed; [1,1/9] is skewed to the right.](http://images.slideplayer.com/21/6246874/slides/slide_22.jpg "Arrow’s independence of irrelevant alternatives (IIA) Weighting the reciprocal matrix with the largest number in each column for preserving the order (Belton and Gear, 1983).- A revised AHP.")
25
General Form of the AHP- the ANP The analytic network process (ANP) was proposed to overcome the MCDM problems with interdependence and feedback effects. Step 1- To derive the local weights using the AHP. Step 2- To formulate the supermatrix according to the results of the local weights and the network structure. Step 3- To raise the supermatrix to limiting powers for obtaining the final results.

26
The general form of the supermatrix,where C m denotes the mth cluster, e mn denotes the nth element in the mth cluster, and W ij is the local priority matrix of the influence of the elements compared in the jth cluster to the ith cluster. In addition, if the jth cluster has no influence to the ith cluster, then W ij =0.

27
There are several structures proposed by Saaty, including hierarchy, holarchy, suparchy, intarchy, etc., to demonstrate how the network structure affects the supermatrix. Here, two simple cases which both have three clusters are used to demonstrate how to form the supermatrix based on the specific network structure.

28
In Case 1, the supermatrix can be formed as the following matrix:

29
Then, the supermatrix of Case 2 can be expressed as

30
After forming the supermatrix, the weighted supermatrix can be derived by transforming all columns sum to unity exactly, i.e., form a stochastic matrix. Next, we raise the weighted supermatrix to limiting powers for obtaining the global priority vectors or called weights. If the supermatrix has the effect of cyclicity (i.e., exist two or more limiting supermatrices), the Cesaro sum would be calculated to get the priority weights
, the Cesaro sum would be calculated to get the priority weights.")
31
Applications of the ANP Example 1. The key to develop a successful system depending on the match of human and technology factors. Assume the human factor can be measured by the criteria of business culture (C), end-user demand (E), and management (M). On the other hand the technology factor can be measured by the criteria of employee ability (A), process (P), and resource (R). In addition, human and technology factors are affected each other as like as the following structure.
, end-user demand (E), and management (M). On the other hand the technology factor can be measured by the criteria of employee ability (A), process (P), and resource (R). In addition, human and technology factors are affected each other as like as the following structure..")
32
The first step of the ANP is to compare the relative importance between each criterion. For example, the first matrix below is to ask the question “For the criterion of employee ability, how much the importance does one of the human criteria than another.” The other matrices can easily be formed with the same procedures. The next step is to calculate the influence (i.e., calculate the principal eigenvector) of the elements (criterion) in each component (matrix).
 of the elements (criterion) in each component (matrix)..")
33
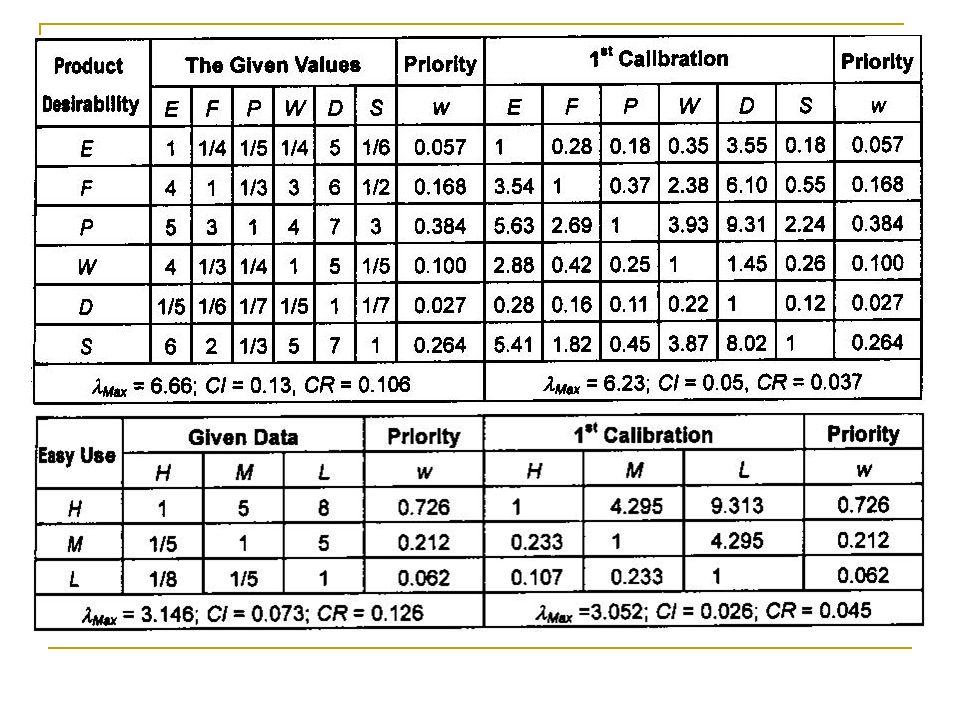
AbilityCultureEnd-UserManagementEigenvector Culture1340.634 End-User1/3110.192 Management1/4110.174 ProcessCultureEnd-UserManagementEigenvector Culture111/20.250 End-User111/20.250 Management2210.500 ResourceCultureEnd-UserManagementEigenvector Culture1210.400 End-User1/21 0.200 Management1210.400

34
CultureAbilityProcessResourceEigenvector Ability1530.637 Process1/511/30.105 Resource1/3310.258 End-UserAbilityProcessResourceEigenvector Ability1520.582 Process1/511/30.109 Resource1/2310.309 ManagementAbilityProcessResourceEigenvector Ability11/51/30.136 Process5130.654 Resource31/310.210

35
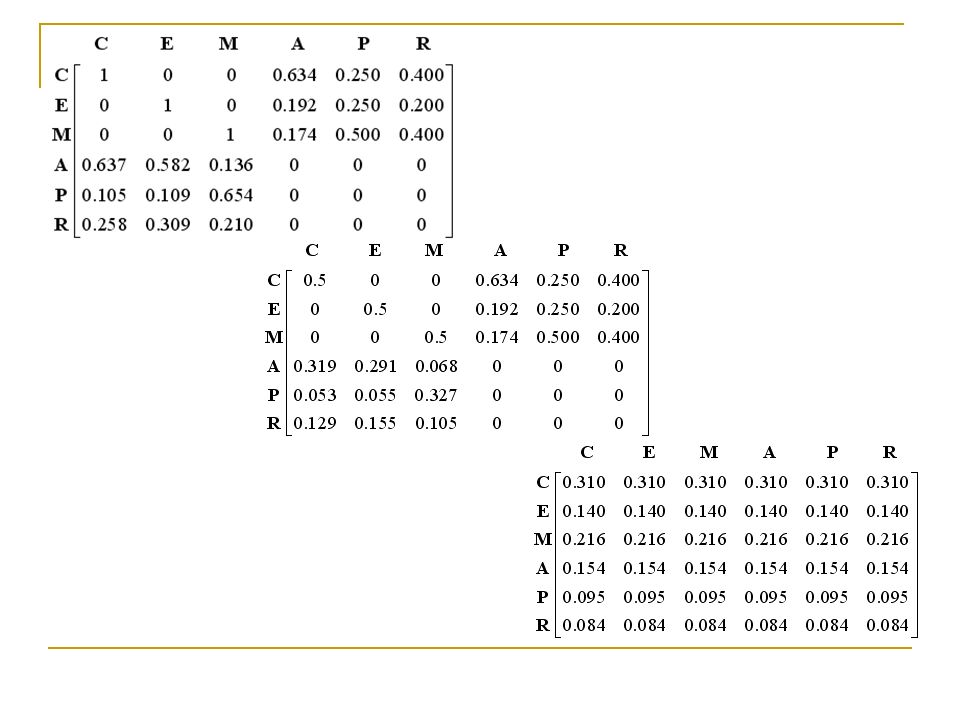
Now, we can form the supermatrix based on the above eigenvectors and the previous structure. Since the human factor can affect the technology factor, and vise versa, the supermatrix is formed as follows:

36
Finally, by calculating the limiting power of the weighted supermatrix, the limiting supermatrix can be obtained as follows:

37
As we see, the supermatrix has the effect of cyclicity, and in this situation the Cesaro sum (i.e., add the two matrices and dividing by two) is used here to obtain the final priorities as follows: In this example, the criterion of culture has the highest priority (0.233) in system development and the criterion of end-user has the least priority (0.105).
 is used here to obtain the final priorities as follows: In this example, the criterion of culture has the highest priority (0.233) in system development and the criterion of end-user has the least priority (0.105).")
38
Example 2. In order to show the effect of the structure in the ANP, the other structure, which has the feedback effect on human factors, is considered as follows:

39
There are two methods to deal with the self- feedback effect. The first method simply place 1 in diagonal elements and the other method performs a pairwise comparison of the criteria on each criterion. In this example, we use the first method. With the same steps above, the unweighted supermatrix, the weighted supmatrix, and the limiting supermatrix can be obtained as follows, respectively:

41
Since the effect of cyclicity does not exist in this example, the final priorities are directly obtained by limiting the power to converge. Although the criterion of culture also has the highest priority, the priority changes from 0.233 to 0.310. On the other hand, the least priority is resource (0.084) instead of end-user. Compare to the priorities of the two examples, the structures play the key to both the effects and the results. In addition, it should be highlighted that when we raise the weighted matrix to limiting power, the weighted matrix should always be the stochastic matrix.
 instead of end-user. Compare to the priorities of the two examples, the structures play the key to both the effects and the results. In addition, it should be highlighted that when we raise the weighted matrix to limiting power, the weighted matrix should always be the stochastic matrix..")
42
Forming Structural Modeling (Fuzzy) Interpretive structural modeling (ISM) method DEMATEL (Decision Making Trial and Evaluation Laboratory) Method (Fuzzy) Cognition Maps Structural equation model (SEM) Bayesian network Formal concept analysis
 Interpretive structural modeling (ISM) method DEMATEL (Decision Making Trial and Evaluation Laboratory) Method (Fuzzy) Cognition Maps Structural equation model (SEM) Bayesian network Formal concept analysis")
43
Interpretive structural modeling ISM is a computer-assisted methodology to construct and to understand the fundamental relationships of the elements in complex systems or situations. The theory of ISM is based on discrete mathematics, graph theory, social sciences, group decision-making, and computer assistance. The procedures of ISM are begun through individual or group mental models to calculate binary matrix, also called relation matrix, to present the relations of the elements.

44
The concepts of ISM A relation matrix can be formed by asking the question like “Does the feature inflect the feature ?” If the answer is “Yes” then, otherwise. The general form of the relation matrix can be presented as follows: where is the ith element in the system, between the ith and the jth elements, and D is the relation matrix. denotes the relation

45
After constructing the relation matrix, we can calculate the reachability matrix as follows: where I is the unit matrix, k denotes the powers, and is the reachability matrix. Note that the reachability matrix is under the operators of the Boolean multiplication and addition (i.e., and ).
..")
46
Next, we can calculate the reachability set and the priority set base, respectively, using the following two equations: where denotes the value of the ith row and the jth column of the reachability matrix. Finally, the levels and the relationships between the elements can be determined and the structure of the elements’ relationships can also be expressed using the following equation:

47
Example Assume the ecosystem consist of water (W), fish (F), hydrophytes (H), and fisherman (M), and the relationships of the elements above can be expressed as the following relation graph and relation matrix:
, fish (F), hydrophytes (H), and fisherman (M), and the relationships of the elements above can be expressed as the following relation graph and relation matrix:")
48
The relation matrix adds the identity matrix to form the M matrix can be formed as follows: The reachability matrix can be obtained by powering the matrix M as: where the symbol (*) indicates the derivative relation which does not emerge in the original relation matrix.
 indicates the derivative relation which does not emerge in the original relation matrix.")
49
In order to determine the levels of the elements in a hierarchical structure, the reachability set and the priority set are derived as: 11,41,2,31 21,2,42,32 31,2,3,433 44 4 Level 1Fisherman Level 2Water Level 3Fish Level 4Hydrophytes

50
The final results of the relationships of the elements, based on the rechability matrix and the level information, can be depicted as shown in the following graph:

51
The End

Similar presentations


 - by Saaty>")


