Download presentation
Presentation is loading. Please wait.

1
www.brightindex.co.uk Copyright © Bright UK Ltd Creating self-correcting customer service organisations Twickenham Stadium, July 2015 @MRennstam

2
www.brightindex.co.uk You would normally hear me speaking about how are we doing in three key areas...

3
www.brightindex.co.uk PERFORMANCEPERFORMANCE STAFF ENGAGEMENT V.O.C.

4
www.brightindex.co.uk C-SAT scores over the last 4 years. Average CSAT scores (scale 1-5) over the last four years.
 over the last four years..")
5
www.brightindex.co.uk Creating self-correcting organisations. "All is connected... no one thing can change by itself." — Paul Hawken “Slowness to change usually means fear of the new” – Philip Crosby “Change is hard because people overestimate the value of what they have and underestimate what they may gain by giving that up” – Belasco & Stayer “If you do what you’ve always done, you’ll get what you’ve always got” – Henry Ford

6
V.O.C: a powerful first building block for your self-correcting organisation. Build a real-time solution enabling you to not just measure C-SAT, but drive it! ON 4 LEVELS

7
www.brightindex.co.uk Level 1: Self developing agents Make it accountable J. Smith | Team | Dept. | Division | Company | Benchmark

8
www.brightindex.co.uk Level 2: Clued up and focused team leaders. Make it accountable NPS Advisor engagement Focus where it matters the most

9
www.brightindex.co.uk Level 3: Centre managers driving relevant KPIs. Measuring metrics in parallel with general satisfaction (or NPS), will tell you what affects satisfaction the most.
, will tell you what affects satisfaction the most..")
10
www.brightindex.co.uk How do we drive change in the rest of your organisation? Contact Centre Marketing Product Dev. Logistics Anti churn team WebCEO

11
Current top gripes Top negative customer comments Resolution Broken processes Lack of knowledge Service quality Third party agreements Broken promises No empowerment Timeliness Transfers Queue length and info Hold lengths Systems Personal details wrong Customer history wrong

12
www.brightindex.co.uk Verbatim mining and CEO sessions.

13
www.brightindex.co.uk Cover the whole customer journey

14
www.brightindex.co.uk What about costs?

15
www.brightindex.co.uk The power of linking data Cost per advisor 40k / 270 days = £148 / 90 calls and 60 calls. C-SAT Contacts per day Teams with £1 lower cost per call, yet scores higher on CSAT. Move 500 advisors in red to green = £12M cost saving annually!

16
www.brightindex.co.uk AHTAHT Product Knowledge V.O.C. 2.0: Mix with C-SAT with performance stats Why does Bob spend 60 seconds longer per call compared to Mary? And at the same time, customers score Mary’s competence higher!

17
www.brightindex.co.uk Recognition (employee) Engagement (customer) V.O.C. 2.0: Mix with C-SAT with Employee scores These team leaders score much higher on ”Recognition” by advisors AND (thus) customers find their advisors much more engaged.
 customers find their advisors much more engaged..")
18
Benchmark performance

19
www.brightindex.co.uk How do we find our strategic sweet spot? QUALITY EFFICIENCY Public Sector Logistics Retail Utilities Service Desks Telecoms Bright Index Insurance Travel Retail banking Premier Banking Best Practice

20
www.brightindex.co.uk DO start monitoring Social media, however.. ContactBabel Excluding communities / FAQ

21
www.brightindex.co.uk Resolving issues on the first attempt, by channel Target response time – email Actual response time – email 24 HOURS! 20 HOURS! © OVUM

22
www.brightindex.co.uk Monitor & Manage the three key areas. Build an organisation that keeps improving regardless of management changes.

23
www.brightindex.co.uk Mats Rennstam mats@brightindex.co.uk www.brightindex.co.uk Further reading: www.brightindex.co.uk/Research - You CAN prove the value of customer service! - Best Practice for Customer Satisfaction Surveying - Bright warns good customer service may be too good! - Five steps to achieving a 30% C-Sat increase - Proving contact centres’ contribution to the business - Is self-service for you? - Focus on what matters, and where the money is! www.brightindex.co.uk www.goldstandard.cc

24
www.brightindex.co.uk Copyright © Bright UK Ltd Contact Centre Trends & Raising the game Where are we at present and how do we raise the game for the entire industry? @MRennstam

25
www.brightindex.co.uk C-SAT scores over the last 4 years. Average CSAT scores (scale 1-5) over the last four years.
 over the last four years..")
26
www.brightindex.co.uk Do we make it easy for our staff to help customers? Percentage of agents that said “the technology in place hinders me helping the customer” UK Benchmark 62%

27
www.brightindex.co.uk Other drivers..

28
www.brightindex.co.uk Other drivers..

29
Benchmarking performance

30
www.brightindex.co.uk Speed to answer, within 20 seconds Highest: 98.00% Lowest: 25.00% SectorLowestHighest Finance55.0%89.4% Retail53.0%98.0% Telecoms47.0%86.7%

31
www.brightindex.co.uk Speed to answer, within120 seconds CSAT breaking point for speed of answer. “the average wait time is now..”

32
www.brightindex.co.uk BrightIndex ™ Highest: Lowest: Average response time - email Definition: Actual response time for emails, regardless of opening hours. 57h 2h

33
www.brightindex.co.uk BrightIndex ™ Highest: Lowest: Short term absence - advisor Definition: Average number of days of short term absence per advisor during the period. 11.12 0.88

34
www.brightindex.co.uk BrightIndex ™ Highest: Lowest: Lost calls in self service Definition: Proportion of calls lost during self service in the IVR. 65.00% 11.60%

35
Benchmarking performance

36
www.brightindex.co.uk Advisors per Team leader Definition: Number of advisors divided by number of team leader FTEs Highest: Lowest: 22 3 8-15 advisors / team leader = 10% higher ready time 5% higher availability 5% higher FCR Lower absence More satisfied advisors Higher competency

37
www.brightindex.co.uk BrightIndex ™ Highest: Lowest: Call time per advisor and day (hours) Definition: Logged call hours / FTE for calls / 110 337min 56min
 Definition: Logged call hours / FTE for calls / min 56min")
38
www.brightindex.co.uk Utilisation, Autumn 2014 60% 18% 13% 9% 42% 19% 12% 27% Bright IndexTop performers Definition: Breakdown of an average workday for a Telephony FTE, based on one day (450 minutes) Talk Time Idle Wrap Other Talk Time Idle Wrap Other
 Talk Time Idle Wrap Other Talk Time Idle Wrap Other")
39
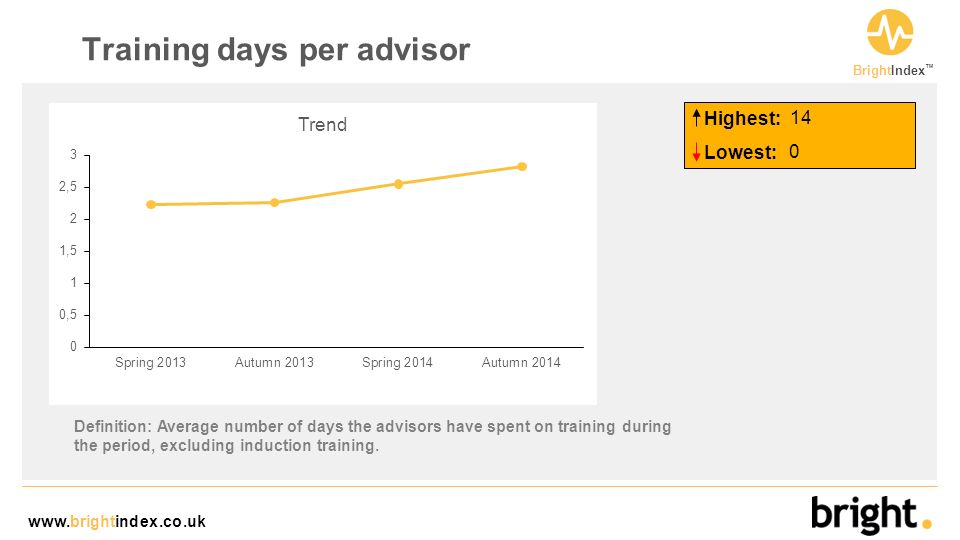
www.brightindex.co.uk BrightIndex ™ Highest: Lowest: Training days per advisor Definition: Average number of days the advisors have spent on training during the period, excluding induction training. 14 0
40
www.brightindex.co.uk BrightIndex ™ Highest: Lowest: Average length of employment Definition: Average length of employment in years. Permanent employees only. 19.00 0.75

41
Benchmarking performance

42
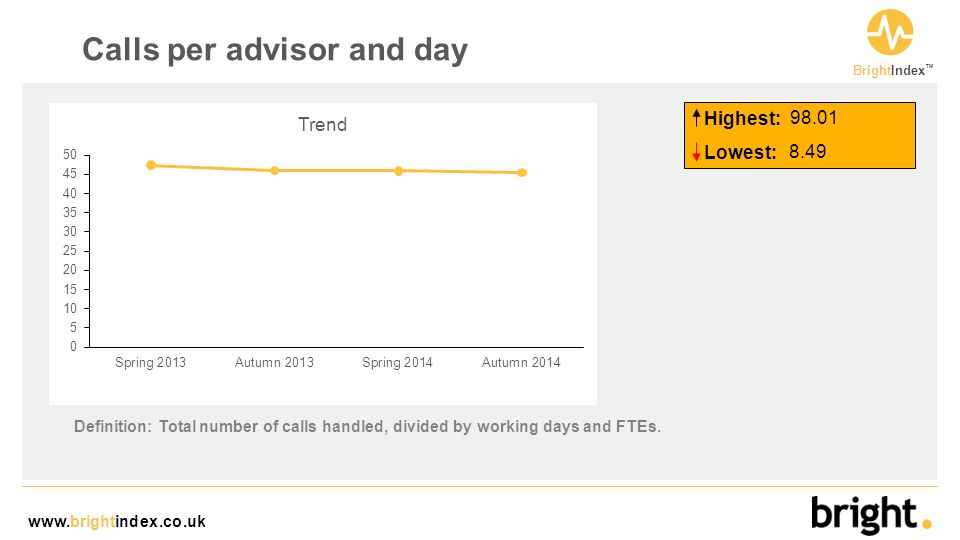
www.brightindex.co.uk BrightIndex ™ Highest: Lowest: Calls per advisor and day Definition: Total number of calls handled, divided by working days and FTEs. 98.01 8.49
43
www.brightindex.co.uk BrightIndex ™ Highest: Lowest: Average call duration Definition: Average talk time per call in seconds, excluding IVR and wrap time. 753s 129s

44
www.brightindex.co.uk BrightIndex ™ Highest: Lowest: Direct cost per call Definition: Direct cost (salaries + rent) for your call handling advisors, divided by answered incoming calls. £19.62 £0.85

45
www.brightindex.co.uk BrightIndex ™ Highest: Lowest: First call resolution Definition: Proportion of queries resolved in the first call, according to the advisor. 99.48% 39.03%

46
www.brightindex.co.uk Q&D Return on investment Metric (per advisor) Bright Index (cross sector avg) Top performersDiff.WORTH (500 seat centre) Annual cost£38,000£23,000*- £15,000£7.5M Calls per day4593+ 48£9.5M Absence per annum 6 days0.2 days6 days£420k Avg. talk time per day 180 mins294 mins+ 114 mins£4.5M Attrition per annum 17%1.3%16%£400k £15-20M *excludes offshore (£6,900).
..")
47
www.brightindex.co.uk PERFORMANCEPERFORMANCE STAFF ENGAGEMENT CUSTOMER How do I think we’re going to significantly raise the game for the industry?

48
www.brightindex.co.uk Mats Rennstam mats@brightindex.co.uk www.brightindex.co.uk Further reading: www.brightindex.co.uk/Research - You CAN prove the value of customer service! - Best Practice for Customer Satisfaction Surveying - Bright warns good customer service may be too good! - Five steps to achieving a 30% C-Sat increase - Proving contact centres’ contribution to the business - Is self-service for you? - Focus on what matters, and where the money is! www.brightindex.co.uk www.goldstandard.cc

Similar presentations


 TweetChat.com Go to TweetChat.com & login using your.>")
 Prepared by Group 4: Andrew Molloy Amy Miller Mike Elicker.>")


 relationships and break-even analysis break-even chart – low fixed costs, high variable.>")