Download presentation
Presentation is loading. Please wait.

1
Chapter 9 Accuracy assessment in remotely sensed categorical information 遥感类别信息精度评估 Jingxiong ZHANG 张景雄 Chapter 9 Accuracy assessment in remotely sensed categorical information 遥感类别信息精度评估 Jingxiong ZHANG 张景雄

2
Thematic mapping based on mage classification 1) use spectral (radiometric) differences to distinguish spatial classes 2) supervised / unsupervised mode Change detection 1) binary maps of change or no-change 2) categorized change A quick review of Chapters 7 & 8
 use spectral (radiometric) differences to distinguish spatial classes 2) supervised / unsupervised mode Change detection 1) binary maps of change or no-change 2) categorized change A quick review of Chapters 7 & 8")
3
Figure 1. Simulation: studies: (a) and (b) mean areal- class maps, for time 1 and time 2; (c) and (d) distorted versions for (a) and (b), respectively.
 and (b) mean areal- class maps, for time 1 and time 2; (c) and (d) distorted versions for (a) and (b), respectively..")
6
We will discuss Why ? What ? How ? for accuracy assessment

7
Key points: to construct confusion matrix ( 混淆矩阵 ) to compute accuracy measures Difficult points: Statistics for sampling design and spatial analysis
 to compute accuracy measures Difficult points: Statistics for sampling design and spatial analysis")
8
Why do we bother accuracy assessment? Thematic maps of land cover, forest types, and others can be derived from classification of remotely sensed imagery in combination with ancillary data sets You need to tell map users how well it actually represents what’s out there “Without an accuracy assessment, a classified map is just a pretty picture.”

9
What is accuracy assessment? Assess how well a classifier works Interpret the usefulness of someone else’s classification

10
How do we do accuracy assessment? Collect reference data, i.e., “ground truth” determining class types at specific locations Compare a map with the reference to compute accuracy measures Interpretation of the results

11
Reference Data - possible sources Aerial photo interpretation Ground truthing with GPS GIS layers Make sure we can actually extract from the reference source the information needed For discriminating four species of grass, we may need ground surveys not aerial photographs

12
Determining size of reference plots Match spatial scale of reference plots and remotely-sensed data Ground plots (5 meters on a side) may not be useful for remotely-sensed imagery (1km) may need aerial photos or even other satellite imagery.
 may not be useful for remotely-sensed imagery (1km) may need aerial photos or even other satellite imagery.")
13
Take into account spatial frequencies of image consider photo reference plots that cover an area 3 pixels on a side Example 1: Low spatial frequency Homogeneous Example 2: High spatial frequency Heterogeneous

14
Implication for positional accuracy consider the situation where accuracy of position of the image is +/- one pixel Example 1: Low spatial frequency Example 2: High spatial frequency

15
Determining number and position of samples Make sure to adequately sample the landscape Variety of sampling schemes: Random, stratified random, systematic, etc. The more reference plots, the better You can estimate how many you need statistically In reality, you can never get enough Lillesand and Kiefer: suggest 50 per class as rule of thumb

16
Sample size (please see the references) n << N p = 0.5
 n << N p = 0.5")
17
Sampling Methods : Stratified Random Sampling a minimum number of observations are randomly placed in each stratum. observations are randomly placed. Simple Random Sampling

18
Sampling Methods

19
Cluster Sampling Randomly placed “centroids” used as a base of several nearby Observations, which can be Selected randomly or systematically

20
Accuracy assessment Collect reference data, i.e., “ground truth” determining class types at specific locations Compare a map with the reference to compute accuracy measures Interpretation of the results

21
Compare (through sample locations): class type on classified map = class type determined from reference ? Summarize (cross-tabulation) into an confusion matrix Compute accuracy measures: overall classification accuracy (percent correctly classified pixels, PCC) producer’s / user’s accuracy kappa coefficient of agreement (KHAT)
 into an confusion matrix Compute accuracy measures: overall classification accuracy (percent correctly classified pixels, PCC) producer’s / user’s accuracy kappa coefficient of agreement (KHAT).")
24
An example confusion matrix ( 混淆矩阵 ) Class types determined fromreference User’s Accuracy Class types determined from classified map # PlotsConiferdeciduousgrass Totals Conifer50525788% deciduous141302748% grass3581650% Totals 672310100 Producer’s Accuracy 75%57%80%Total ( PCC ): 71%
 Class types determined fromreference User’s Accuracy Class types determined from classified map # PlotsConiferdeciduousgrass Totals Conifer % deciduous % grass % Totals Producer’s Accuracy 75%57%80%Total ( PCC ): 71%")
25
Kappa coefficient of agreement Kappa of 0.463 means there is 46.3% better agreement than by chance alone (0.71 - 0.46) / (1 - 0.46) = 0.463 Chance agreement = [Product of row and column marginals for each class] 0.46 for the example
![Kappa coefficient of agreement Kappa of means there is 46.3% better agreement than by chance alone ( ) / ( ) = Chance agreement = [Product of row and column marginals for each class] 0.46 for the example](http://images.slideplayer.com/20/6228667/slides/slide_25.jpg "Kappa coefficient of agreement Kappa of means there is 46.3% better agreement than by chance alone ( ) / ( ) = Chance agreement = [Product of row and column marginals for each class] 0.46 for the example")
26
Accuracy assessment Collect reference data, i.e., “ground truth” determining class types at specific locations Compare reference to classified map class type on classified map = class type determined from reference ? Interpretation of the results

27
Interpreting results of accuracy assessment Misclassification in remotely-sensed data: Classes are land use, not land cover Classes not spectrally separable Spatial scale of remote sensing instrument does not match classification scheme Error in reference data: Interpreter error Subjectivity

28
Improving Classification Land use/land cover: incorporate other data Elevation, temperature, ownership, etc. Context Spectral inseparability Hyperspectral Multiple dates Scale Different sensor Aggregate pixels Classifiers Use HIERARCHICAL CLASSIFICATION scheme In Maximum Likelihood classification, use Prior Probabilities to weigh minority classes more

29
Summary Accuracy assessment to add value to remote sensing information products and to ensure their proper use Ground truth is itself difficult to acquire due to the non-trivial task of class definition Sampling design is important for cost- effectiveness in accuracy assessment Accuracy assessment as an integral component in the information process

30
References Cochran, W.G. 1977. Sampling techniques. Wiley, New York. Congalton, R. 1991. A review of assessing the accuracy of classifications of remotely sensed data. Remote Sensing of Environment 37:35-46. Nusser, S.M., and E.E. Klaas. 2002. Final performance report to EPA Region 7, Part II: GAP accuracy assessment pilot study. Environmental Protection Agency Contract X997387-01 Final Report. Iowa Cooperative Fish and Wildlife Research Unit, Iowa State University, Ames, Iowa. 77 pp. Stehman, S.V. 1997. Selecting and interpreting measures of thematic classification accuracy. Remote Sensing of Environment 62:77-89.

32
Questions: 1. The challenges of accuracy assessment in change detection include obtaining reference for: images taken in the past sampling sufficiently the areas that will change in the future Why is this? 2. Compute accuracy measures from the hypothetical example error matrix.

Similar presentations
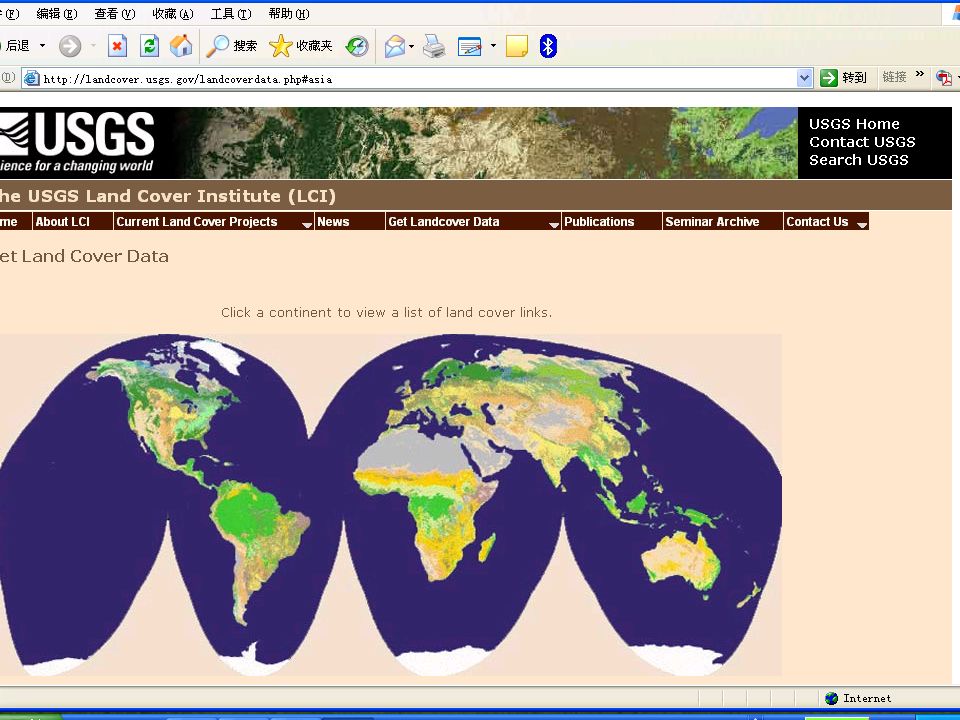

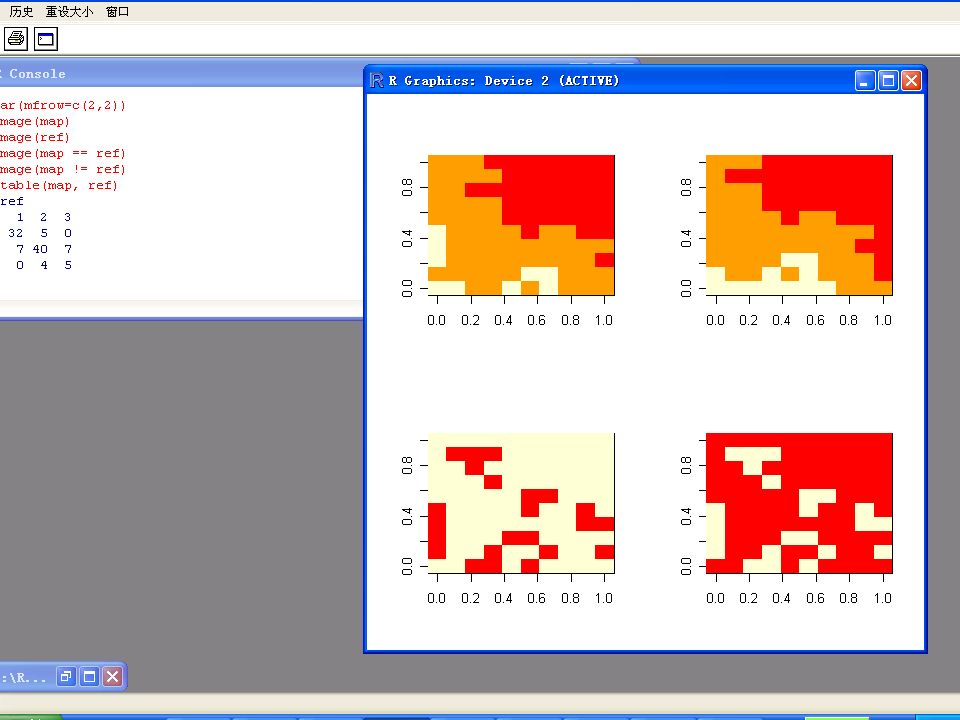
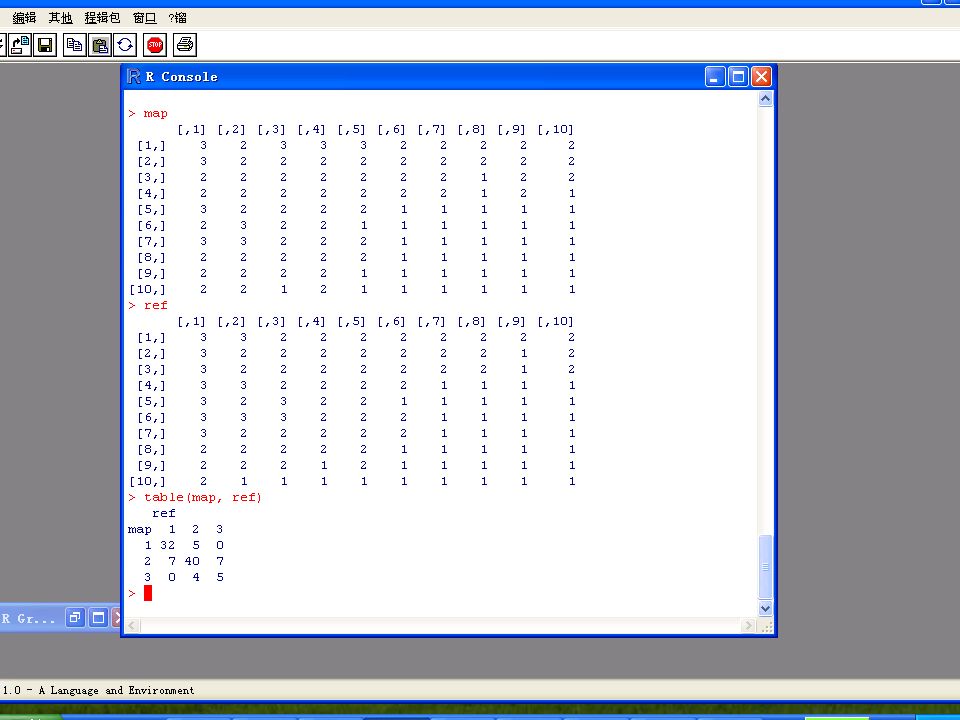

 Image Quality Assessment Radiometric Correction Geometric Correction Image Classification Introduction.>")


