Download presentation
Presentation is loading. Please wait.

1
Creative Regional Strategies February 14, 2010

2
A recent survey of college graduates found that 3 of 4 ranked location as more important than availability of a job when selecting a place to live.

3
Who Works in Creative Class? Creative Class: TAPE T = Technology and R&D Innovation A = Arts and Culture P = Professional and Managerial E = Educating and Training

4
Why Occupations? Among all people who either work in the IT industry or work in an IT occupation (or both): – 50.2% work in an IT occupation but not in the IT industry – 25.7% work in the IT industry but aren't in an IT occupation – Only 24.1% work in an IT occupation in the IT industry IT IndustryIT Occupations
: – 50.2% work in an IT occupation but not in the IT industry – 25.7% work in the IT industry but aren t in an IT occupation – Only 24.1% work in an IT occupation in the IT industry IT IndustryIT Occupations.")
5
The Rise of the Creative Class

7
7 Share of creativity-oriented jobs is increasing

8
What is the Creative Class ? What You Do (Job Occupation) vs. Where You Work (Industry) 10 Year Job Growth Estimate Working Class10% Service Class 14% Creative Class 20%
 10 Year Job Growth Estimate Working Class10% Service Class 14% Creative Class 20%.")
9
U.S. Creative Economy KnowledgeServiceWorking Workers (Talent)40,379,52059,769,27031,949,350 % of Workforce30.5%45.1%24.1% % of Wages48.8%30.4%20.6% 9
40,379,52059,769,27031,949,350 % of Workforce30.5%45.1%24.1% % of Wages48.8%30.4%20.6% 9.")
10
U.S. Creative Class 30 (% of the workforce) 40 (million people) 50 (% of the wages) 70 (% of the discretionary income)
 40 (million people) 50 (% of the wages) 70 (% of the discretionary income).")
11
Who are the 40,000,000? OccupationsWorkersSalary ($B) T Computer and mathematical3,076,200213.0 Architecture and engineering2,430,250160.9 Life, physical, and social science1,231,07073.4 Healthcare practitioners and technical6,713,780416.5 A Arts, design, entertainment, and media1,727,38079.6 P Management5,892,900541.7 Business and financial operations5,826,140349.6 Legal976,74083.4 Sales and related occupations4,298,620147.7 E Education, training, and library occupations8,206,440371.9 Total40,379,5202,437.7 11
 T Computer and mathematical3,076, Architecture and engineering2,430, Life, physical, and social science1,231, Healthcare practitioners and technical6,713, A Arts, design, entertainment, and media1,727, P Management5,892, Business and financial operations5,826, Legal976, Sales and related occupations4,298, E Education, training, and library occupations8,206, Total40,379,5202,")
12
U.S. Creative Growth OccupationsGrowth (2004-2014) New Jobs (000; by 2014) T Computer and mathematical30.7%1,389 Architecture and engineering17.1%876 Life, physical, and social science16.4%531 Healthcare practitioners and technical25.8%3,047 A Arts, design, entertainment, and media14.9%851 P Management11.3%2,757 Business and financial operations19.1%2,163 Legal15.9%336 Sales and related occupations9.6%408 E Education, training, and library occupations20.0%3,558 12
 New Jobs (000; by 2014) T Computer and mathematical30.7%1,389 Architecture and engineering17.1%876 Life, physical, and social science16.4%531 Healthcare practitioners and technical25.8%3,047 A Arts, design, entertainment, and media14.9%851 P Management11.3%2,757 Business and financial operations19.1%2,163 Legal15.9%336 Sales and related occupations9.6%408 E Education, training, and library occupations20.0%3,")
13
Workforce Structure - Classes ServiceCreativeWorking Canada 7,068,195 46.2% 4,317,125 28.2% 3,154,290 20.6% Ontario 2,700,563 45.6% 1,748,258 29.5% 1,239,065 20.9% Toronto 1,145,000 45.3% 840,718 33.3% 472,835 18.7%

14
Employment Structure of the Labour Market, 2008

17
17

18
-Creative jobs are more common in larger cities -Eastern Ontario somewhat higher mainly due to Ottawa Creative Ontario 18

19
Creative Jobs as a Percent of Total Employment 19

20
Service Class Jobs as a Percent of Total Employment 20

21
Working Class Jobs as a Percent of Total Employment 21

22
Agricultural Jobs as a Percent of Total Employment 22

23
City Size & the Creative Class 23

24
Service Occupations Occupation CanadaOntarioToronto B5 Clerical occupations21.90%22.92%26.01% G9 Sales and service occupations, n.e.c.17.38%16.99%14.75% G2 Retail salespersons and sales clerks9.74%10.08%10.21% A2 Managers in retail trade, food and accommodation services6.35%6.34%6.03% E2 Paralegals, social services workers and occupations in education and religion, n.e.c.4.98%4.66%4.51% B3 Administrative and regulatory occupations4.73%5.12%5.62% G1 Wholesale, technical, insurance, real estate sales specialists, and retail, wholesale and grain buyers4.71%5.13%6.31% G3 Cashiers4.34%4.20%3.87% G6 Occupations in protective services3.70%3.60%2.77% G5 Occupations in food and beverage service3.59%3.20%2.79% G8 Child care and home support workers3.47%3.23%3.12% D3 Assisting occupations in support of health services3.46%3.13%2.38% A3 Other managers, n.e.c.3.43%3.61%3.94% G4 Chefs and cooks3.30%2.80%2.59% G7 Occupations in travel and accommodation, including attendants in recreation and sport1.92%1.82% G0 Sales and service supervisors1.76%1.82%1.70% B4 Clerical supervisors1.24%1.34%1.58%

25
Service Occupations – Average Wage (full-time) Occupation CanadaOntarioToronto G5 Occupations in food and beverage service $ 18,761 17,995 19,816 G3 Cashiers 20,140 21,123 22,231 G8 Child care and home support workers 23,522 24,667 24,173 G4 Chefs and cooks 24,284 25,291 26,383 G9 Sales and service occupations, n.e.c. 26,160 27,915 28,994 D3 Assisting occupations in support of health services 30,909 33,006 35,284 E2 Paralegals, social services workers and occupations in education and religion, n.e.c. 31,723 34,573 36,811 G0 Sales and service supervisors 33,766 35,184 37,645 G7 Occupations in travel and accommodation, including attendants in recreation and sport 34,618 36,812 37,627 G2 Retail salespersons and sales clerks 34,959 38,365 41,287 B5 Clerical occupations 37,313 39,172 40,017 A2 Managers in retail trade, food and accommodation services 44,186 47,228 51,931 B4 Clerical supervisors 49,425 51,304 52,700 B3 Administrative and regulatory occupations 50,612 52,650 56,589 G6 Occupations in protective services 55,697 58,431 54,425 G1 Wholesale, technical, insurance, real estate sales specialists, and retail, wholesale and grain buyers 59,004 62,930 66,015 A3 Other managers, n.e.c. 81,331 88,495 101,177

26
Service Class Hours Worked (Ontario)
")
27
Workforce Structure – Part-Time Workforce ServiceCreativeWorking Canada 1,750,425 24.8% 590,970 13.7% 245,710 7.8% Ontario 677,750 25.1% 226,550 13.0% 95,615 7.7% Toronto 259,198 22.6% 98,903 11.8% 34,725 7.3%

28
Workforce Structure – Age Breakdown CanadaOntarioToronto % Workforce % Service % Workforce % Service % Workforce % Service 15-24 15.8%22.0%15.7%22.5%14.0%20.7% 25-65 81.6%75.7%81.7%75.0%83.5%76.8% Over 65 2.6%2.3%2.6%2.5%

29
Ratio: Service Class Industry Share to Regional Industry Share (Ontario)
")
30
Service Share Visible Minorities/Immigrants (vs. overall regional share) Visible Minorities Immigrants Canada16.1% (15.0%) 20.8% (21.2%) Ontario21.9% (21.4%) 29.3% (30.5%) Toronto41.3% (40.3%) 50.0% (50.9%)
 Visible Minorities Immigrants Canada16.1% (15.0%) 20.8% (21.2%) Ontario21.9% (21.4%) 29.3% (30.5%) Toronto41.3% (40.3%) 50.0% (50.9%).")
31
Service Class Education Share BA & Above Ratio SC to Workforce Canada 13.1%0.46 Ontario 15.4%0.47 Toronto 21.2%0.49

32
Service Class Education CanadaOntario % NoCert16.4%15.6% % HighSch33.3%34.3% % Apprentice10.5%6.9% % Coll CEGEP22.0%23.5% % Univ Below BA4.6%4.3% % BA9.9%11.3% % Masters3.1%4.0% % PhD0.2%

33
Employment Structure of the Labour Market, 2008

36
Upstate New York

37
Upstate New York Super-Region

39
Talent Measures

40
Talent Benchmarks

45
“ Future ” Talent

47
Regional Brain Drain

48
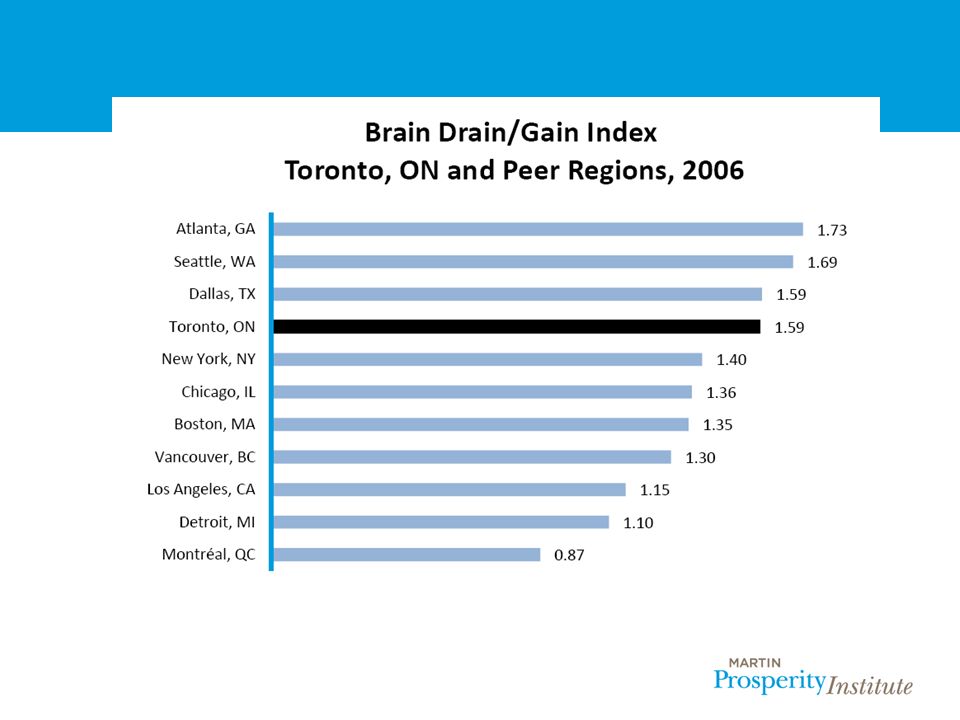
Brain Drain/Gain

50
Creative Workforce

54
Major Occupational Clusters

55
National Growth

56
Occupation Clusters by Growth

57
Occupational Cluster Strengths

58
Occupation Clusters

60
Source: U.S. Bureau of Labor Statistics, U.S. Bureau of the Census. Percentage of the employed population in the region in occupations in the following categories: – Computer and mathematical occupations – Architecture and engineering occupations – Life, physical and social science occupations – Education, training and library occupations – Arts, design, entertainment, and media occupations MSA-level data is directly calculated. County-level data is estimated based on industry and occupation employment data from the Census. (R2 of estimation equation is above 0.98.) Estimates generated from 2000 Census data. MSA data is from 2001 data. % Super Creative
 Estimates generated from 2000 Census data. MSA data is from 2001 data. % Super Creative.")
61
Source: U.S. Bureau of Labor Statistics, U.S. Bureau of the Census. Percentage of the employed population in the region in the Super Creative occupations (see above) and occupations in the following categories: – Management occupations – Business and financial operations occupations – Legal occupations – Healthcare practitioners and technical occupations (does not include healthcare support) – High-end sales and sales management MSA level data is directly calculated. County level data is estimated based on industry and occupation employment data from the Census. (R2 of estimation equation is above 0.98.) Estimates generated from 2000 Census data. MSA data is from 2001 data. % Creative
 and occupations in the following categories: – Management occupations – Business and financial operations occupations – Legal occupations – Healthcare practitioners and technical occupations (does not include healthcare support) – High-end sales and sales management MSA level data is directly calculated. County level data is estimated based on industry and occupation employment data from the Census. (R2 of estimation equation is above 0.98.) Estimates generated from 2000 Census data. MSA data is from 2001 data. % Creative.")
62
Source: U.S. Bureau of the Census. Percentage of the population age 25 and above in the region that has a bachelor's degree or above. Based on data from the 2000 census. Talent Index

63
Source: U.S. Bureau of the Census and proprietary data and calculations. Percentage of the workforce, age 25 and above, with at least a bachelor ’ s degree divided by the percentage of the population age 20 to 34 currently attending college. A value of 1.0 shows that the two percentages are equal – the region is retaining the college educated at the same rate at which it is educating them. A value greater than 1.0 is given to a region that not only keeps its own college graduates but also attracts them from other regions. A value less than 1.0 is given to a region that is keeping and attracting a lower percentage of the college educated than it is creating – the region is exporting its newly generated talent to other regions. Brain Drain/Gain Index

64
Toronto

70
Ontario Wages Creative Class Working Class Service Class Average$64,174$40,792$37,653

Similar presentations