Download presentation
Presentation is loading. Please wait.

4
Destructive Tropical Cyclones Affected Areas Regions Casualties (dead) Affected (family) Damages to Properties Typhoon Sendong (December 15-18)VI, VII, IX, XI, CARAGA & ARMM 1,257 113,651 1,382,008,527.00 Typhoon Pedring (September 24-28)I, II, III,IVA, IVB, V, VI, CAR & NCR 85 667,602 15,552,586,957.49 Typhoon Juaning (July 25-28)III, IVA, IVB, V, VI, VII, VIII & NCR 77 255,129 4,441,798,208.89 Typhoon Mina (August 21-29)I,II, V, VI, CAR, NCR 36 97,006 2,089,349,409.79 Ty Bebeng (May 6-11)III, IVA, IVB, NCR, V, VII & VIII 35 83,632 2,253,233,275.00 Typhoon Quiel (September 29-October 2)I, II, III & CAR 17 323,303 115,075,527.81 Typhoon Falcon (June 21-25)I, II, III & NCR 12 389,348 646,851,793.75 Typhoon Ramon (October 10-14)IVB, VI, VII, VIII, X, XII & CARAGA 10 17,971- Typhoon Kabayan (July 28-August 5)I, III, IVA, VI & NCR 8 23,238 2,500,000.00 Typhoon Chedeng (May 20-28)NCR, II, C, IX, X, XII & ARMM 4 91,767 18,933,499.00 1,541 2,062,647 26,502,337,199.73 Source of Data: National Disaster Risk Reduction and Management Council (NDRRMC)
 Affected (family) Damages to Properties Typhoon Sendong (December 15-18)VI, VII, IX, XI, CARAGA & ARMM 1, ,651 1,382,008, Typhoon Pedring (September 24-28)I, II, III,IVA, IVB, V, VI, CAR & NCR ,602 15,552,586, Typhoon Juaning (July 25-28)III, IVA, IVB, V, VI, VII, VIII & NCR ,129 4,441,798, Typhoon Mina (August 21-29)I,II, V, VI, CAR, NCR 36 97,006 2,089,349, Ty Bebeng (May 6-11)III, IVA, IVB, NCR, V, VII & VIII 35 83,632 2,253,233, Typhoon Quiel (September 29-October 2)I, II, III & CAR , ,075, Typhoon Falcon (June 21-25)I, II, III & NCR , ,851, Typhoon Ramon (October 10-14)IVB, VI, VII, VIII, X, XII & CARAGA 10 17,971- Typhoon Kabayan (July 28-August 5)I, III, IVA, VI & NCR 8 23,238 2,500, Typhoon Chedeng (May 20-28)NCR, II, C, IX, X, XII & ARMM 4 91,767 18,933, ,541 2,062,647 26,502,337, Source of Data: National Disaster Risk Reduction and Management Council (NDRRMC)")
6
Type of shockJob loss Decrease in income Asset loss Increase in expenses Typhoon34.669.234.645 Flood9.8623061.2 Note: This table includes estimates for households which reported the specific type of shock as one of the top 3 most severe shocks they experienced in the past 12 months. Source: CBMS Survey, 2011 Table 1. Impact of natural calamities (% of households)
.")
7
Type of shock Average decrease in income Average losses in assets Average increase in expenses Typhoon 8272,0423,305 Flood 1,1501,900869 Note: This table includes estimates for households which reported the specific type of shock as one of the top 3 most severe shocks they experienced in the past 12 months. Source: CBMS Survey, 2011 Table 2. Impact of natural calamities, amount (in Php)
.")
8
Source of basic data: CBMS Survey, 2011

9
Poverty status in 2010 Poverty status in 2011 Non-poorPoor Non-poor63.636.4 Poor15.085.0 Total37.063.0 Source of basic data: CBMS Survey, 2011 Poverty Transition Matrix among Households Affected by Typhoon/Flood

11
Source: Reyes, C., Sobrevinas, A. and de Jesus, J. (2010). The Impact of the Global Financial and Economic Crisis on Poverty in the Philippines, in C.M. Reyes and Baris, M. Jr., (eds.), Monitoring the Impacts of the Global Crisis at the Community Level (pp. 79-167), Manila, Philippines.
. The Impact of the Global Financial and Economic Crisis on Poverty in the Philippines, in C.M. Reyes and Baris, M. Jr., (eds.), Monitoring the Impacts of the Global Crisis at the Community Level (pp ), Manila, Philippines..")
13
Coping StrategyTotal Income Group Bottom 40Top 60 Reduced expensive food42.440.743.3 Recooked/reheated leftovers40.342.938.7 Shifted to cheaper food37.243.333.6 Consumed staple food only24.930.821.3 Bought from government stores23.831.419.3 Bought in retail22.626.520.4 Consumed same dish for days22.627.120 Lessened dining out21.816.225 Combined meals21.424.219.8 Reduced portion20.823.619.1 Consumed own harvest16.626.810.6 Skipped meals10.412.29.4 Reduced parents' share7.610.16.2 Source: CBMS Census 2009

14
Coping StrategyTotal Income Group Bottom 40Top 60 Used secondhand uniforms/shoes34.337.731.7 Used secondhand books26.928.625.7 Reduced allowance20.728.614.5 Shifted from private/school bus to commuting2.93.52.5 Planned to withdraw children from school2.63.81.7 Withdrawn children from school1.521.1 Members skipped classes1.41.81.1 Transferred children from private to public0.80.21.3 Planned to transfer children from private to public0.70.31 Transferred children from daycare to homecare0.710.4

15
Source: CBMS Census 2009 Coping StrategyTotal Income Group Bottom 40Top 60 Shifted to generic drugs/cheaper drug brands42.939.944.6 Used medicinal plants/herbal medicines35.843.531.3 Shifted to government health centers and hospitals31.737.728.1 Resorted to self-medication21.317.923.2 Did not buy medicine15.215.814.9 Shifted to alternative medicine14.221.210.3 Discontinued intake of prescribed medicine6.56.26.7 Lessened the availment of medical treatment65.96.1 Reduced prescribe drug intake66.95.5 Did not seek medical treatment5.46.54.7

16
Source: CBMS Census 2009 Coping StrategyTotal Income Group Bottom 40Top 60 Tapping Various Fund Sources Borrowed money37.139.735.4 Used savings13.815.512.7 Pawned assets4.134.8 Sold assets2.63.61.9 Seeking Additional Sources of Income Looked for additional work5.67.24.5 Did additional work4.55.93.6 Employed members not previously working1.62.11.3 Looked for work abroad1.40.71.8

17
Note: Poverty measures are based on poverty indices from the Foster, Greer and Thorbecke (FGT) (1984) class; Source of basic data: 2006 FIES, NSO 0.6 0.5 Poverty Severity Index 1.10.9 Poverty Gap Index 2.7 2.2 Headcount Index 2,277,2651,828,392 Magnitude of poor (popn) 2.52.0 Proportion of poor HHs (%) 5.24.1 % increase in general prices Estimation Based on I-O Tables Direct Estimation Based on CPI INDICATOR
 (1984) class; Source of basic data: 2006 FIES, NSO Poverty Severity Index Poverty Gap Index Headcount Index 2,277,2651,828,392 Magnitude of poor (popn) Proportion of poor HHs (%) % increase in general prices Estimation Based on I-O Tables Direct Estimation Based on CPI INDICATOR")
18
Major Household Coping Strategies Coping Strategies RuralUrban Santa RitaBrgy. 51Brgy. 85 Shifted to NFA Rice23.07.05.2 Food market preference changed to NFA rolling store/TNG15.01.71.1 Changed food consumption pattern16.525.720.1 Shifted to low-cost cooking fuel3.30.61.7 Decreased electricity usage27.77.727.5 Changed electricity consumption pattern28.648.026.8 Transferred children from private to public schools1.00.02.8 Children stopped attending school7.11.02.3 Changed health-seeking behavior43.422.410.1 Decreased usage of cell phone0.039.79.5 Shifted to cheaper means of transportation0.00.70.0 Saved money16.831.332.6 Used savings14.518.730.2 Borrowed money72.630.945.4 Sold properties14.81.44.7 Pawned properties24.21.911.2 Sought additional work10.02.77.8 Doing work besides main occupation9.40.46.2 Sought work outside of area/country11.20.86.7 Changed conduct of recreational/leisure activities7.964.834.8 Source: Reyes, C., Sobrevinas, A., Bancolita, J. and de Jesus, J. (2011). Analysis of the Impact of Changes in the Prices of Rice and Fuel on Poverty in the Philippines, in C.M Reyes and A.B. Sobreviñas (eds.), Impact of Rising Prices of Food and Fuel on Poverty (pp. 99-206), Manila, Philippines.
. Analysis of the Impact of Changes in the Prices of Rice and Fuel on Poverty in the Philippines, in C.M Reyes and A.B. Sobreviñas (eds.), Impact of Rising Prices of Food and Fuel on Poverty (pp ), Manila, Philippines..")
22
2.6 - 12.0 12.1 – 20.9 21.0 – 30.2 30.3 – 39.8 Philippines 20.9 Region I 17.8 CAR 17.1 Region II 14.5 Region III 12.0 NCR 2.6 Region 4-A 10.3 Region 4-B 27.6 Region V 36.0 Region VIII 33.2 Region VI 23.8 Region VII 30.2 CARAGA 39.8 Region X 32.8 Region IX 36.6 Region XI 25.6 Region XII 28.1 ARMM 38.1

23
50,000 – 160,000 160,001 – 220,000 220,001 – 250,000 250,001 – 420,000 Philippines 3,855,730 Region I 179,179 CAR 54,949 Region II 94,433 Region III 244,273 NCR 64,404 Region 4-A 248,179 Region 4-B 162,609 Region V 385,338 Region VIII 287,156 Region VI 245,703 Region VII 415,303 CARAGA 187,278 Region X 275,433 Region IX 242,285 Region XI 226,284 Region XII 224,882 ARMM 218,043

25
2.6 – 12.0 12.1 – 20.9 21.0 – 30.2 30.3 – 39.8

31
76.9 % 67.9 % 9.2 % NNP - Transient poor NPN - Previously poor 62.0 % 5.6 % 4.6 % NNN - Never poor NPP - Transient poor LEGEND: Income nonpoor Income poor PNP - Transient poor PPN - Previously poor PNN - Previously nonpoor PPP - Chronic poor 23.1%23.1% 7.5 % 15.6 % 5.4 % 2.1 % 11.1 % 4.4 %

34
Island Group Chronic poor Never poor Previously poor Transient poor Luzon31.859.643.136.6 Visayas23.019.023.922.5 Mindanao45.221.433.040.8 Total100

36
Highest educational attainment Chronic poor Transient poor Previously poor Never Poor No grade completed8.85.95.82.1 Elementary undergraduate40.935.935.416.0 Elementary graduate27.124.524.118.3 High school undergraduate10.214.512.4 High school graduate10.515.117.022.6 College undergraduate2.53.64.714.5 College graduate00.50.613.8 Post-graduate000.00.3 Total100

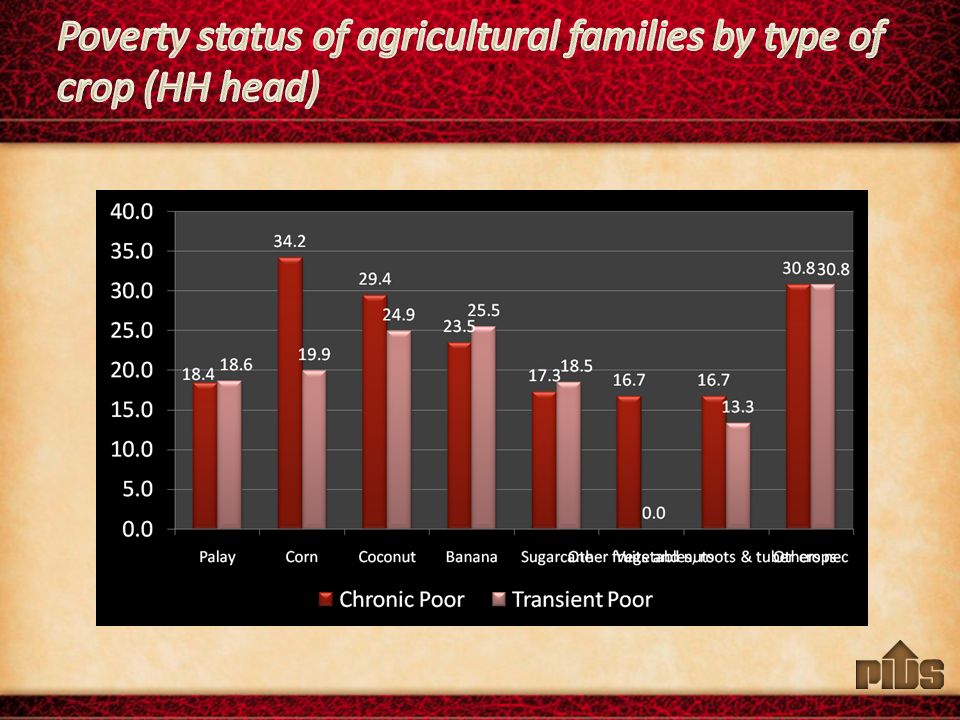
37
Sector of job/business Chronic poor Transient poor Previously poor Never Poor Non-agriculture22.728.734.751.6 Agriculture71.358.955.626.1 No job/business5.912.49.722.3 Total100

38
Primary occupation of head Chronic poor Transient poor Previously poor Never Poor Farmers/forestry workers/fishermen 4942.238.120.8 Laborers/unskilled workers 29.92424.511.3 Trades and related workers 6.76.19.77.7 No job/business 5.912.59.722.3 Officials/managers/supervisors2.56.68.218.3 Service workers/shop and market sales workers 2.22.44.56.9 Plant and machine operators and assemblers 2.252.95.0 Technicians and associate professionals 0.60.20.72.3 Clerks 0.60.41.32.6 Special occupations 0.40.60.40.5 Professionals 00.1 2.3 Total100

40
from 7 regions of Luzon

48
Chronic PovertyTransient Poverty Conditional cash transfers Crop Insurance ScholarshipsCredit Livelihood Skills trainingEmergency employment programs

Similar presentations


alk m>")


 Conducted by The National Bureau of Statistics.>")

 Team Name Names of Team Members Adopted for Created by.>")
