Download presentation
Presentation is loading. Please wait.

1
Principles and practicalities in measuring child poverty - Miles Corak Measuring child benefits: measuring child poverty - Michael Mendelson & Sid Frankel Lars Osberg Economics Department Dalhousie University Low Income, Poverty, and Deprivation A Workshop sponsored and hosted by Statistics Canada and the University of Toronto June 5/6 2006

2
Different Focus + Agreements, Disagreements & Omissions Agreements Poverty is relative to social norms of deprivation Focus Identify “Poor” – Administration or Evaluation ? Type I & Type II errors of classification Disagreements Market Basket or % of Median Income ? “Word Picture” to motivate criterion ? Summarization – rate & gap ? Omissions Time & Risk, Human Rights Link

3
Poverty: economic deprivation - “want of the necessities of life” “not only those things which nature, but those things which the established rules of decency have rendered necessary to the lowest rank of people” Adam Smith (1776) “poverty is an absolute notion in the space of capabilities but very often it will take a relative form in the space of commodities or characteristics” Amartya Sen (1983) MM & MC agree
 poverty is an absolute notion in the space of capabilities but very often it will take a relative form in the space of commodities or characteristics Amartya Sen (1983) MM & MC agree")
4
Capabilities t = F it (commodities t ) Poor - If Capabilities < Minimum Necessary Social Standards of time => Minimum @ time t F it = F (household size & composition, location, health, disability, life skills, etc.) Commodities – alternative measures Actual consumption or potential consumption (income) or specific necessities Minimum “Capabilities” / Deprivation ?? Ambiguity of “citizenship”

5
Issue: - to identify “the poor” or “the number & deprivation of the poor” ? MM – “What is an adequate maximum child benefit for families with low incomes?” MM’s issue: administration of a particular program – Canada Child Tax Benefit - implies specific information set (X i ) Type I and Type II errors both matter “Good Predictor” of need at individual level needed for effectiveness “Other Programs” supposed to take care of special needs, adults
 Type I and Type II errors both matter Good Predictor of need at individual level needed for effectiveness Other Programs supposed to take care of special needs, adults.")
6
MC: aim – to define & measure child poverty, compare internationally & define credible poverty targets for society Issue: given all programs, macro cycle, demography, etc., how big is the problem? Rate, average gap & inequality of gaps Note: If Type I error = Type II error, total is OK Identification of deprivation of specific person not the issue Statistical agency information set ≠ Administrative sets Different criteria for success MC – objective to Minimize {Type I – Type II} MM – objective to Minimize {Type I + Type II} MM: Much discussion of classification errors

7
Practical Issues in Poverty Measurement MM & MC agree on dimensionality accounting period = year, recipient unit = family / household measure = after tax & transfer money income + supplementation by specific item deprivation MM & MC disagree on “poverty line” Relative Poverty or “Budget based” / “Absolute” ? Implications for Initial Level and for Updating LO – Missing Issues: Summarization Spell Durations Human Rights link

8
MM1: Market Basket Budget MM – “all relevant measures of low income or poverty are ‘relative’ to contemporary living standards” Historical evidence - “absolute” poverty lines & market basket budgets increase over time with “average” incomes Non-transparent – but appearance of objectivity? Details of construction buried deep [wide range – e.g. $18,342 to $30,402 for 4 in Toronto 1992] Major political plus iff source is credible Major minus if change is suspiciously timed Implicit link to norms, occasional, idiosyncratic Not directly comparable across nations, time

9
MM2: reverse regression ??? MM proposes: “regressing the sample of families, with income as the dependent variable and the deprivation indicators as the independent variables, for families of different structures” Y i = α 0 + α 1 D 1 + α 2 D 2 + β 1 X 1 + β 2 X 2 + ε i But complains: “With current techniques, we know only that renters have lower incomes than owners” Better: estimate Prob(D 1,D 2 | Y i,X 1,, X 2 ) BUT no escape from “arbitrary” choice of minimum, necessary Probability of (D 1,D 2 )
 BUT no escape from arbitrary choice of minimum, necessary Probability of (D 1,D 2 ).")
10
MC: Explicitly “Relative” Poverty Line H o : “Established rules of decency” change as society changes Transparent link to current distribution of income LIS standard = ½ median equivalent income European Union = 60% median equivalent income Explicitly transparent, standardized, comparable over time & across countries huge plus for policy evaluation Two issues – initial level & updating Choice – ½ or 60% - ? Rapid change in median can imply counter-intuitive changes Update for price changes OR Update for median real income changes ? Moving average can diminish volatility

11
When does the choice of updating method matter ? Polling data since 1946 - social norms track median earnings IF median real incomes change, updating method matters – sometimes has been historically important Canada 1960s, 1970s, USA in late 1990s, Ireland 1990s BUT since 1981, not much change in median real incomes in Canada

12
“Absolute” or “Relative” Poverty Line ? Not much change in real median incomes !

13
How best to motivate choice of initial level of poverty line ? MM: general “word picture” of standard of living at poverty line should drive $$ number How to change specific items over time? How to defend general criteria as non-arbitrary? MC: ratio of potential consumption to median household income implies $$ number “less than half” = deprivation LO: ½ has intuitive meaning 50/50 – equity norm (& solution to “ultimatum game”) Individuals always apply “Reality check” $ number drives examples, which drive credibility Comparisons drive Concern Over time – is poverty “getting worse” ? Across countries – do other nations “do better” ?
 Individuals always apply Reality check $ number drives examples, which drive credibility Comparisons drive Concern Over time – is poverty getting worse . Across countries – do other nations do better .")
14
Item Deprivations – An Increasingly Important Complement to $$ povline Communicable to Public Human Rights Perspective => specific goods Convention on the Rights of the Child - includes health and nutrition, clothing, housing, and other goods, services and opportunities necessary for normal physical, mental and social development Can see behind within family allocation of $ resources to children, elderly, women. Legal recognition of social norm of minimum literature now emphasizes multi-dimensionality Sen’s Capabilities Perspective “Social Exclusion” Agenda “Social Wage” or Cash purchase ? – who cares? Comparable across differing public-private policy mix

15
LICO = orphan methodology “Relatively little” discretionary income LICO based on 20% + E (food + clothing + house share of expenditure | income, family size, rural/urban) Year to year updating on CPI as per “absolute” Rebased occasionally to community norms as per “relative” Long time series useful !!! for research & politics BIG MISTAKE to terminate until any replacement methodology has acquired credibility

16
MC - Principles for Measurement (1) use income based measure of resources; (2) complement with small set of specific indicators; (3) draw poverty lines with regard to social norms; (4) establish a regular monitoring system and update poverty lines within a five year period; (5) set a both a backstop and a target by using fixed and moving poverty lines; (4) & (5) less important if real growth in median is small (6) offer leadership and build public support for poverty reduction. Explicit Link to Human Rights Agenda would be useful

17
LO1: Annual Income ? Year = compromise accounting period immediate needs are much more short term long term impacts may be multi year Implicit Assumption – income is perfectly substitutable within period but zero between period substitutability Consumption & Income smooth consumption despite low income ? Borrow? Beg from relatives ?? BUT credit access for most low income households is very poor & families may be poor &/or alienated

18
Why does poverty duration matter? long-term poor are materially worse off than short- term poor Income-based measures imperfect indicator of resources Low current income but buffers = access to credit, run down consumer durables, obtain transfers long spells exhaust buffers to consumption Psychological/Social impacts may increase with individual duration Social stereotypes may depend on the distribution of durations High turnover/short spell process means more of nonpoor have “been there”

19
Why does immediate need matter ? No groceries + no credit + no income = immediate need in a week or less “Transitory” child poverty can imply events Events can have long run impacts Eviction from housing ? Forced mobility & school attainment ? Family stress => Family breakup? Abuse ? Traditional Welfare State agencies recognized But new HK paradigm has firmly long run perspective Much higher incidence (3x in SIPP) than in annual poverty measures
 than in annual poverty measures.")
21
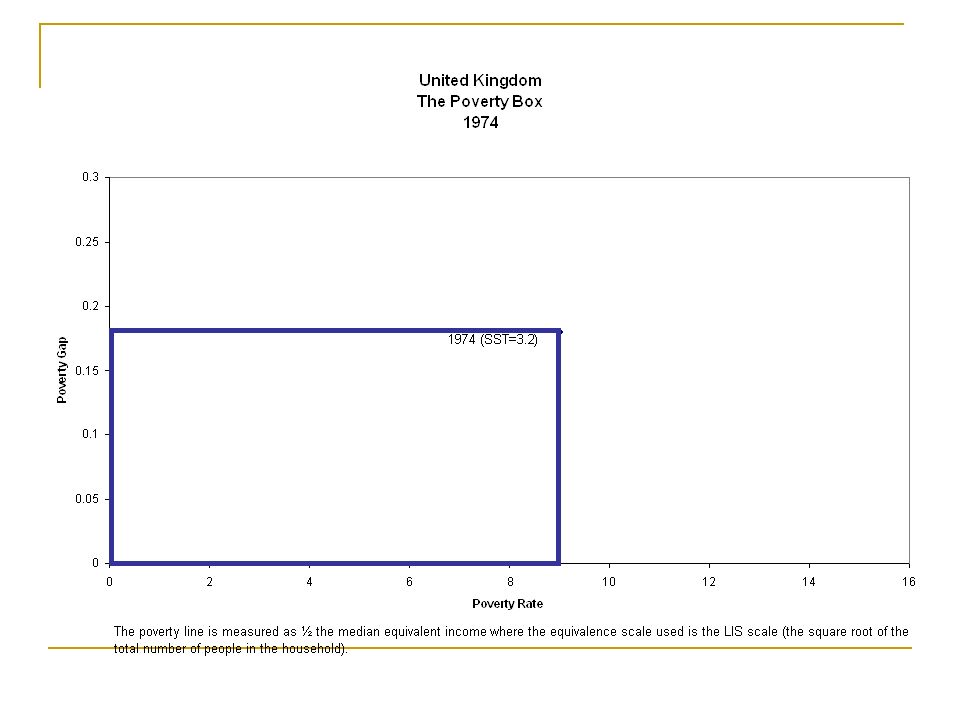
LO2: Poverty Gap matters too !! Why not measure Poverty Intensity ? Sen-Shorrocks-Thon (SST) Index. P = (RATE ) (GAP ) (1+G (X )). Empirically: inequality of poverty gaps [1+G (X)] is very nearly constant. SST = volume of Box, one dimension nearly constant. Changes over time, differences across jurisdictions can be approximated by. RATE x GAP = FGT index (α =1) Poverty Box – in 2 dimensions. Poverty Intensity proportional to area RATE X GAP.
 Index. P = (RATE ) (GAP ) (1+G (X )). Empirically: inequality of poverty gaps [1+G (X)] is very nearly constant. SST = volume of Box, one dimension nearly constant. Changes over time, differences across jurisdictions can be approximated by. RATE x GAP = FGT index (α =1) Poverty Box – in 2 dimensions. Poverty Intensity proportional to area RATE X GAP..")
23
Variation over time – mostly in rate, but misses recent trend in poverty gap

24
Qualitative Conclusions Re: Poverty Trends Often Differ if consider gap Relative poverty in early 1990s ? Canada, UK, Sweden: poverty rate & gap disagree US & Germany: indices agree UK Absolute poverty line - poverty rate and poverty intensity change in opposite directions every time - 1974/79/86/91/95

30
Communicability ? The whole point of measuring poverty is to influence the policies that might affect poverty A poverty index not used or understood by the public & by policy makers is pointless Humans not very good at deriving accurate relative size information from large tables of numbers. Quite good when presented as area proportionate graphs

31
Equivalence scale - α matters

Similar presentations


 Inequality and poverty in Europe and the USA November 11 2010.>")


