Download presentation
Presentation is loading. Please wait.

1
All material in this presentation, including text and images, is the property of Noel-Levitz, Inc. Permission is required to reproduce information. How can IR help with assessment and retention? A presentation for the Oklahoma Association for Institutional Research and Planning by Scott E. Bodfish Vice President May 5, 2009

2
Today’s Agenda Outline of a process for working with campus retention and assessment initiatives Case studies to illustrate that process Presentation of some strategies for effective research NOTE: Please mute your phone –*6 to mute; #6 to unmute

3
So, your provost ordered the raw data from your satisfaction/priorities survey

4
Here is what she got!

5
Now she wants you to tell her what it all means

6
Although it will be pleasant you can waste a lot of time analyzing the data without some kind of plan

7
The Research Design Process Define the problem Develop a research objective Collect data Turn data into information Get information to decision-makers

8
The Diagnostic Process There is a problem (symptoms) The symptoms have an underlying cause The nature of the cause allows for intervention Implementing the intervention
 The symptoms have an underlying cause The nature of the cause allows for intervention Implementing the intervention")
9
Example The number of students failing introductory statistics courses has increased. Many of them have lower scores on basic math skills (specifically algebra) than previous cohorts of students. We can train advisors to counsel students into remedial math based on assessment test score. Administer assessment tests; train advisors; monitor statistics course pass rates.
 than previous cohorts of students. We can train advisors to counsel students into remedial math based on assessment test score. Administer assessment tests; train advisors; monitor statistics course pass rates..")
10
Developing targeted counseling services at a four-year public university Counseling and advising of new students doesn’t seem to be working well All students are going through the same process; no customization We need a means for assessing student needs that allow for customization Identify an instrument; administer and prioritize services accordingly

11
The situation Program serves at-risk students (economically disadvantaged; inadequate academic preparation) Sought an instrument to assess student needs for intervention and support beyond academic remediation CSI not only identifies needs but assesses receptivity to help
 Sought an instrument to assess student needs for intervention and support beyond academic remediation CSI not only identifies needs but assesses receptivity to help")
12
Findings from the research 20% of entering freshmen had plans to work 21-30 hours per week –Include two time management seminars in our summer programming –Counselors know to specifically speak with students about work and the time required to be successful in their studies

13
Findings from the research 46% of the initial respondents indicated that the highest degree they sought would be a graduate degree –A workshop on graduate studies was introduced for students in their second year rather than at the end of the third year

14
Findings from the research Women more receptive to academic assistance and personal counseling while men more receptive to career counseling –Counselors structure the topics differently for men than for women; however –Individuals vary within each gender group so the primary focus is on each individual’s specific receptivity

15
Outcomes Now provide in-classroom supplemental instruction for 2 levels of math for students identified with this need Hired two academic coaches to assist students who scored high on motivation and receptivity scales, but low on confidence and study skills An increase in the “show rate” to 87% for all booked coaching sessions

16
Improving facilities and services at a community college Rapid enrollment growth and general complaints about student service / satisfaction No way of prioritizing student service initiatives Identify and prioritize specific concerns Ongoing measurement of levels of satisfaction

17
The situation Selected SSI over “home grown” instrument in order to use a standardized instrument used for self-study Have administered SSI every other year since 1996 Administration procedures have remained consistent over time

18
Use of Data to Make Changes Created new library (information commons) in late 1990’s –Satisfaction w/ library services increased from 5.22 to 5.64 Created new student life center –Satisfaction (it is enjoyable to be a student on this campus) increased from 4.72 to 5.41
 in late 1990’s –Satisfaction w/ library services increased from 5.22 to 5.64 Created new student life center –Satisfaction (it is enjoyable to be a student on this campus) increased from 4.72 to 5.41")
19
Use of Data to Make Changes Consolidated counseling services –Slight increase in satisfaction with advising Incorporated student development services (admissions, financial aid, registration, career services, disability services) along w/ counseling –Much greater increase in satisfaction Changed course scheduling process –Second largest increase in satisfaction
 along w/ counseling –Much greater increase in satisfaction Changed course scheduling process –Second largest increase in satisfaction")
20
Use of Data to Make Changes Added parking in 1998 –Satisfaction increases from 3.35 to 3.81 Enrollment increases –Satisfaction decreases to 3.54 Added more parking in 2002 –Satisfaction increases to 4.31 Enrollment has increased again –Satisfaction has declined to 3.75

21
Understanding attrition at a four-year private university An increase in attrition rates Engagement and academic performance (not finances) related to withdrawal Change marketing / recruiting messages to create more accurate expectations Ongoing measurement of attrition
 related to withdrawal Change marketing / recruiting messages to create more accurate expectations Ongoing measurement of attrition")
22
The plan before research Private, four-year institution (high cost) Anecdotal evidence that students feel they aren’t receiving enough financial aid We should increase institutional financial aid packages for continuing students
 Anecdotal evidence that students feel they aren’t receiving enough financial aid We should increase institutional financial aid packages for continuing students")
23
Financial considerations the most common reason for leaving college SOURCE: ELS:2002 “A First Look at the Initial Postsecondary Experiences of the High School Sophomore Class of 2002 (National Center for Education Statistics)
")
24
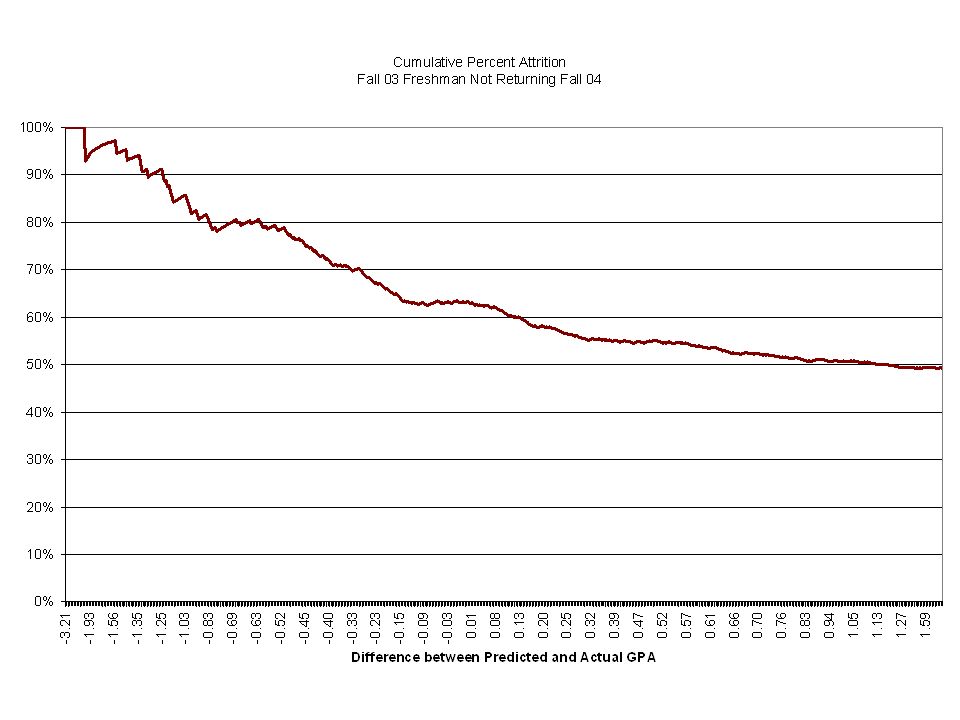
The research project Structured interviews with 20 students (10 who persisted and 10 who withdrew) Analysis of institutional historical data files (two cohorts) –Data included EFC, financial aid awards, admissions data (HS GPA, SAT scores), academic performance data (credits registered, credits completed, GPA earned)
 Analysis of institutional historical data files (two cohorts) –Data included EFC, financial aid awards, admissions data (HS GPA, SAT scores), academic performance data (credits registered, credits completed, GPA earned)")
25
Findings from the research Some students, especially freshmen, seem to have a low initial commitment to the university. Academic performance in the first semester sets the tone for most students. Financial need is unrelated to whether or not a student will withdraw Basic measures such as high school GPA and class rank provide a better indication of which students will have difficulty academically

28
So what about that survey data the provost requested?

29
Why focus on student satisfaction? Schools with higher overall satisfaction enjoy: –Higher graduation rates –Lower loan default rates –Higher alumni giving rates

30
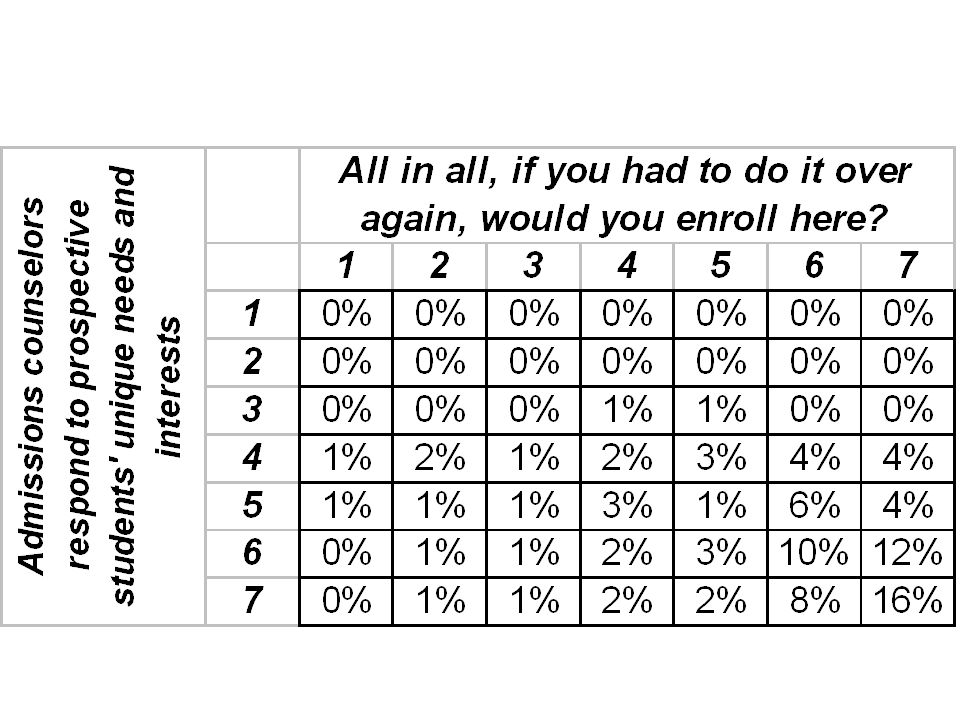
Identifying the “drivers” of satisfaction

34
What other variables influence a student’s college experience?

35
What are some strategies for working effectively with campus retention or assessment initiatives?

36
Be clear on institutional priorities

37
There are regular tasks that aren’t strategic but still high priority

38
Cultivate a relationship with the retention or assessment team

39
Brainstorm with them to get their ideas

40
Make joint requests for resources

41
Share the successes

42
Relate specific results to insights from the data

43
What kind of IR / Planning shop do you have?

44
We just fill out institutional surveys

45
Important to have consistent institutional data reported

46
There are more surveys than there is time available

47
You may be able to “mine” the surveys for data you need

48
We just manage surveys or extract data from internal databases

49
Is it time to re-visit the survey calendar in light of retention or assessment initiatives?

50
Are there regular reports that provide information for retention or assessment?

51
The “internal consultant”

52
Tends to be entrepreneurial

53
More often reports to the president than to a vice president

54
May have a specialized focus or interest

55
There are always more data to analyze, more studies to design and more reports to write

56
Having a process that begins with defining the problem will help clear the way

Similar presentations


 1997 to 2013.>")


