Download presentation
Presentation is loading. Please wait.

1
JIC ABET WORKSHOP No.4 Guidelines on: II Faculty Survey Questionnaire.
I Student Course Satisfaction Survey Questionnaire. II Faculty Survey Questionnaire. III Program Assessment Planning. IV Course Description models. V Mapping of CHET PEOs to JIC Mission Statement. Presented by: JIC ABET COMMITTEE Half-circle picture with accent arcsDrag the half-circle to the left until the two middle yellow adjustment diamonds are lined up with the left edge of the slide. On the Home tab, in the Drawing group, click Arrange, point to Align, and then do the following: Click Align to Slide. Click Align Middle. Select the arc. On the Home tab, in the Clipboard group, click the arrow under Paste, and then click Duplicate. Select the second arc. Under Drawing Tools, on the Format tab, in the Size group, do the following: In the Shape Height box, enter 6.79”. In the Shape Width box, enter 10.03”. On the Home tab, in the bottom right corner of the Drawing group, click the Format Shape dialog box launcher. In the Format Picture dialog box, click Fill in the left pane. In the Fill pane, select No fill. Also in the Format Shape dialog box, click Line Color in the left pane. In the Line Color pane, select Solid line and then do the following: Click the button next to Color, and then under Theme Colors click White, Background 1 (first row, first option from the left). In the Transparency box, enter 50%. Also in the Format Shape dialog box, click Line Style in the left pane. In the Line Style pane, in the Width box, enter 1.5 pt. Drag the second arc left on the slide until the two middle yellow adjustment diamonds are lined up with the left edge of the slide. On the Home tab, in the Drawing group, click Arrange, point to Align, and then do the following: Select the second arc. On the Home tab, in the Clipboard group, click the arrow under Paste, and then click Duplicate. Select the third arc. Under Drawing Tools, on the Format tab, in the Size group, do the following: In the Shape Height box, enter 6.86”. In the Shape Width box, enter 9.98”. On the Home tab, in the bottom right corner of the Drawing group, click the Format Shape dialog box launcher. In the Format Shape dialog box, click Line Color in the left pane, select Gradient line in the Line Color pane, and then do the following: In the Type list, select Linear. Click the button next to Direction, and then click Linear Down (first row, second option from the left). Under Gradient stops, click Add or Remove until two stops appear in the drop-down list. Also under Gradient stops, customize the gradient stops that you added as follows: Select Stop 1 from the list, and then do the following: In the Stop position box, enter 0%. Click the button next to Color, and then under Theme Colors click Blue, Accent 1, Lighter 40% (fourth row, fifth option from the left). In the Transparency box, enter 77%. Select Stop 2 from the list, and then do the following: In the Stop position box, enter 100%. Click the button next to Color, click More Colors, and then in the Colors dialog box, on the Custom tab, enter values for Red: 208, Green: 215, Blue: 222. In the Format Shape dialog box, in the Line Style pane, in the Transparency box, enter 90%. Also in the Format Shape dialog box, click Line Style in the left pane. In the Line Style pane, in the Width box, enter 4.25 pt. On the Home tab, in the Drawing group, click Arrange, point to Align, and then do the following: Click Align Left. Drag the third arc left on the slide until the two middle yellow adjustment diamonds are lined up with the left edge of the slide. Drag the third arc vertically as needed to position it slightly above the second arc on the slide. To reproduce the background on this slide, do the following: Right-click the slide background area, and then click Format Background. In the Format Background dialog box, click Fill in the left pane, select Gradient fill in the Fill pane, and then do the following: Click the button next to Direction, and then click Linear Up (second row, second option from the left). In the Angle box, enter 270⁰. Under Gradient stops, click Add or Remove until four stops appear in the drop-down list. Click the button next to Color, click More Colors, and then in the Colors dialog box, on the Custom tab, enter values for Red: 167, Green: 185, Blue: 197. In the Stop position box, enter 30%. Select Stop 3 from the list, and then do the following: In the Stop position box, enter 70%. Click the button next to Color, and then under Theme Colors click White, Background 1 (first row, first option from the left). Select Stop 4 from the list, and then do the following: Venue: M038 Date: Monday May 02,2011 Time: :00 AM
. In the Transparency box, enter 50%. Also in the Format Shape dialog box, click Line Style in the left pane. In the Line Style pane, in the Width box, enter 1.5 pt. Drag the second arc left on the slide until the two middle yellow adjustment diamonds are lined up with the left edge of the slide. On the Home tab, in the Drawing group, click Arrange, point to Align, and then do the following: Select the second arc. On the Home tab, in the Clipboard group, click the arrow under Paste, and then click Duplicate. Select the third arc. Under Drawing Tools, on the Format tab, in the Size group, do the following: In the Shape Height box, enter In the Shape Width box, enter On the Home tab, in the bottom right corner of the Drawing group, click the Format Shape dialog box launcher. In the Format Shape dialog box, click Line Color in the left pane, select Gradient line in the Line Color pane, and then do the following: In the Type list, select Linear. Click the button next to Direction, and then click Linear Down (first row, second option from the left). Under Gradient stops, click Add or Remove until two stops appear in the drop-down list. Also under Gradient stops, customize the gradient stops that you added as follows: Select Stop 1 from the list, and then do the following: In the Stop position box, enter 0%. Click the button next to Color, and then under Theme Colors click Blue, Accent 1, Lighter 40% (fourth row, fifth option from the left). In the Transparency box, enter 77%. Select Stop 2 from the list, and then do the following: In the Stop position box, enter 100%. Click the button next to Color, click More Colors, and then in the Colors dialog box, on the Custom tab, enter values for Red: 208, Green: 215, Blue: 222. In the Format Shape dialog box, in the Line Style pane, in the Transparency box, enter 90%. Also in the Format Shape dialog box, click Line Style in the left pane. In the Line Style pane, in the Width box, enter 4.25 pt. On the Home tab, in the Drawing group, click Arrange, point to Align, and then do the following: Click Align Left. Drag the third arc left on the slide until the two middle yellow adjustment diamonds are lined up with the left edge of the slide. Drag the third arc vertically as needed to position it slightly above the second arc on the slide. To reproduce the background on this slide, do the following: Right-click the slide background area, and then click Format Background. In the Format Background dialog box, click Fill in the left pane, select Gradient fill in the Fill pane, and then do the following: Click the button next to Direction, and then click Linear Up (second row, second option from the left). In the Angle box, enter 270⁰. Under Gradient stops, click Add or Remove until four stops appear in the drop-down list. Click the button next to Color, click More Colors, and then in the Colors dialog box, on the Custom tab, enter values for Red: 167, Green: 185, Blue: 197. In the Stop position box, enter 30%. Select Stop 3 from the list, and then do the following: In the Stop position box, enter 70%. Click the button next to Color, and then under Theme Colors click White, Background 1 (first row, first option from the left). Select Stop 4 from the list, and then do the following: Venue: M038. Date: Monday May 02,2011. Time: 10:00 AM.")
2
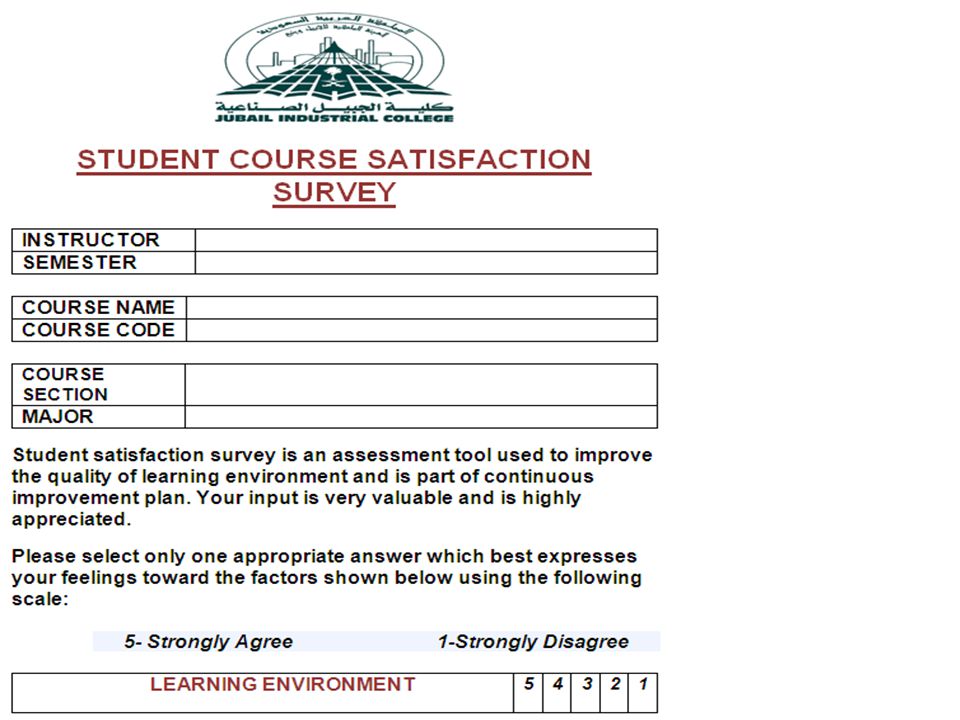
I- Student Course Satisfaction Survey Questionnaire

6
II- Faculty Survey Questionnaire

10
III - Program Assessment Planning

11
The focus of the data collection is to answer the question, “Can the program demonstrate the level to which students have attained the anticipated student outcomes?” The evidence of student learning is then used to identify student strengths and weaknesses related to each of the student outcomes for the purpose of making decisions about how to improve the program teaching/learning processes. This evidence should be the product of faculty reviewing and/or observing student work related to the program requirements.

12
It is important to understand several principles of a well-constructed process to enable continuous improvement related to program-level student learning.

13
Each course syllabus should outline the learning that should take place in that course. The course is organized around a series of activities designed to engage the students in learning related to what is indicated on the syllabus. At the end of the course the faculty member evaluates how well the students learned based on their total performance in the course. At program level assessment, the focus should be on the learning that has resulted from the cumulative experiences in the program. This is progressive as students learn, practice and demonstrate their learning as they progress through the curriculum moving from simple to more complex concepts and skills. To provide evidence of student outcomes for the program, the data that should be used is the data that is collected in the course where the experience is summative.

14
Principles of a well-constructed process to enable continuous improvement are:
Focus of the continuous improvement process (Criterion 4) should be on the assessment of the program, not the assessment of individual students. Focus should be on the cumulative learning of students and not the assessment of individual courses. Student outcomes should be defined in order for faculty to have a common understanding of the expectations for student learning and to achieve consistency across the curriculum. The program does not have to collect data on every student in every course to know how well it is doing toward the attainment of student outcomes. The program does not need more than one data point on each student in the program cohort to determine if the performance has been met. The program does not have to assess every outcome every year to know how well it is doing toward the attainment of student outcomes. This creates an unreasonable overhead for faculty and the result is massive data collection systems that produce data that is not informative The focus should be on continuous improvement based on information for decision making, not just data collection (i.e., data ≠ information)
 should be on the assessment of the program, not the assessment of individual students. Focus should be on the cumulative learning of students and not the assessment of individual courses. Student outcomes should be defined in order for faculty to have a common understanding of the expectations for student learning and to achieve consistency across the curriculum. The program does not have to collect data on every student in every course to know how well it is doing toward the attainment of student outcomes. The program does not need more than one data point on each student in the program cohort to determine if the performance has been met. The program does not have to assess every outcome every year to know how well it is doing toward the attainment of student outcomes. This creates an unreasonable overhead for faculty and the result is massive data collection systems that produce data that is not informative. The focus should be on continuous improvement based on information for decision making, not just data collection (i.e., data ≠ information)")
15
The program Continuous quality improvement process would contain the following:
A continuous timeline of activities (not all activity is data collection). Possible question: “What is your data collection and evaluation timeline?” Define performance indicators for each student outcome with faculty consensus. Possible question for faculty: “How do you define your outcomes so that the faculty is assessing them consistently across the program" Systematic data collection that focuses on summative performance related to the indicators. Possible question: “Where do you collect the data that is evidence of the summative learning of students?“ Summative results will have a single data point for each performance indicator for each student. Possible request: “Describe how the data being presented were collected.” Data that is collected enables faculty to identify student strengths and weaknesses related to the outcomes. Possible question: “I see that X% of your students have attained outcome Y. What were the strengths and weakness of their performance?” Evaluation process focuses improvements on areas of student weaknesses and is communicated to faculty. Possible request: “Describe how the proposed actions improved student learning (or are anticipated to improve student learning) related to the weaknesses that were identified.
. Possible question: What is your data collection and evaluation timeline Define performance indicators for each student outcome with faculty consensus. Possible question for faculty: How do you define your outcomes so that the faculty is assessing them consistently across the program Systematic data collection that focuses on summative performance related to the indicators. Possible question: Where do you collect the data that is evidence of the summative learning of students Summative results will have a single data point for each performance indicator for each student. Possible request: Describe how the data being presented were collected. Data that is collected enables faculty to identify student strengths and weaknesses related to the outcomes. Possible question: I see that X% of your students have attained outcome Y. What were the strengths and weakness of their performance Evaluation process focuses improvements on areas of student weaknesses and is communicated to faculty. Possible request: Describe how the proposed actions improved student learning (or are anticipated to improve student learning) related to the weaknesses that were identified.")
16
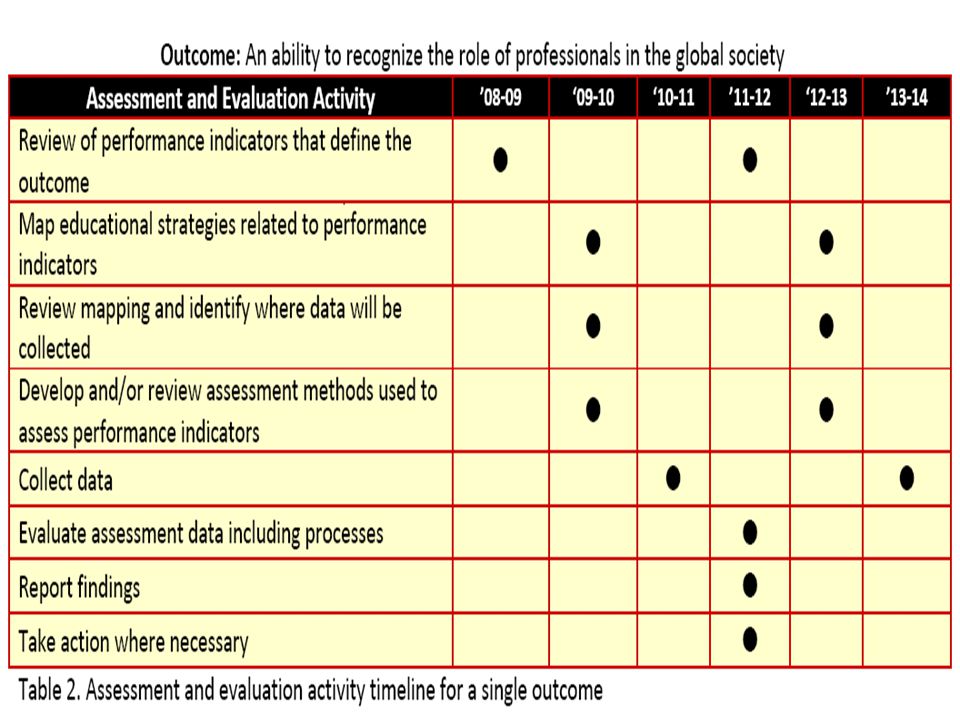
Example of Continuous Assessment Process

20
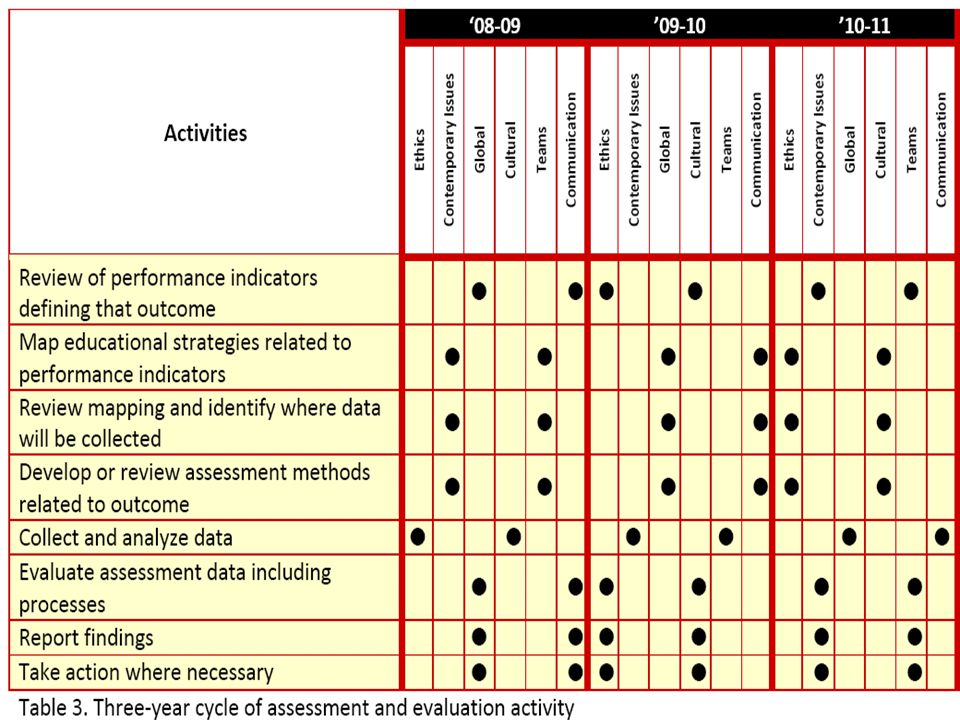
Indirect and Direct Assessment Timeline and Responsibilities

22
IV- Course description Models

23
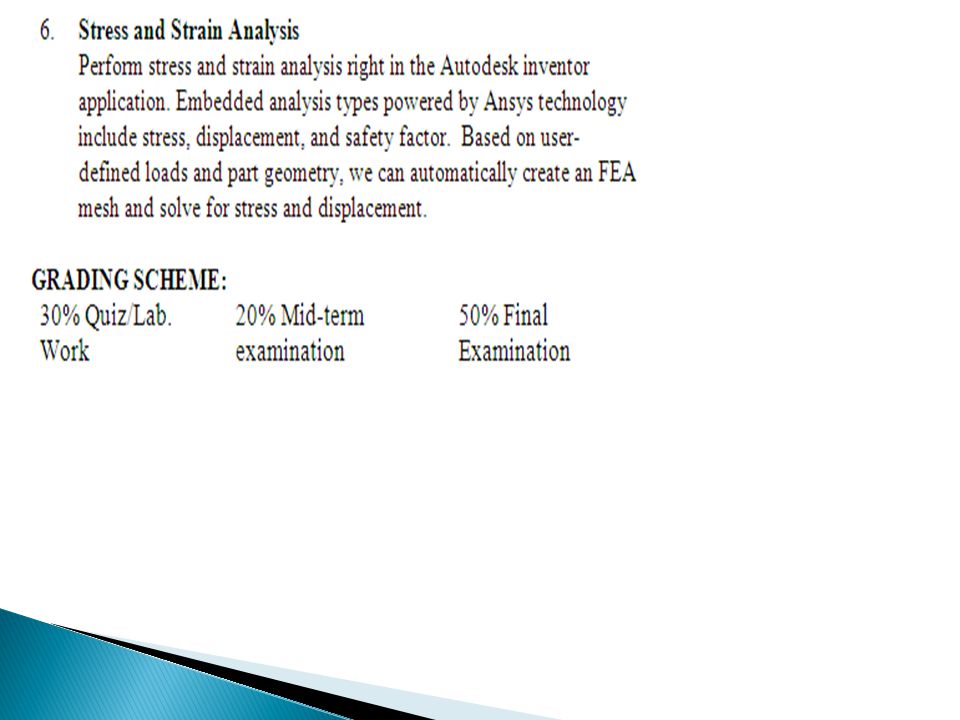
MME 202 : Mechanical CAD Applications
Sample #1 MME 202 : Mechanical CAD Applications

28
ELC 205 : Technical Report Writing
Sample #2 ELC 205 : Technical Report Writing

32
to JIC Mission Statement
V- Mapping of CHET PEOs to JIC Mission Statement

33
CHEMICAL AND PROCESS ENGINEERING TECHNOLOGY ( CHET) PROGRAM
JIC MISSION To provide the Kingdom with well-educated and highly-trained manpower in technical and business related fields by offering quality technology education and training programs that are career-focused and market-driven, through partnership with business, industry, community and other stakeholders.

34
PROGRAM EDUCATIONAL OBJECTIVES Provide quality technology education
MISSION PROGRAM EDUCATIONAL OBJECTIVES Provide quality technology education Offer career-focused and market-driven programs Build partnership with business, industry, and community Support and enhance the various developmental projects of the nation 1. To prepare students who are capable of demonstrating excellence in professional knowledge and technical skills in the field of chemical and process engineering technology in serving the local, national and international industries, and the government agencies; • 2. To prepare students with the necessary background and technical skills to work professionally as individuals or as teams in their professional practice or in the pursuit of higher education; 3. To enhance the students ability to effectively communicate technically and professionally in written, oral and graphic forms; 4. To prepare students to be interested, motivated, and capable of pursuing continued life-long learning through higher education, short courses or other training programs in chemical and process engineering technology and related fields; 5. To prepare students for personal and professional success with an understanding and appreciation of ethical behavior, social responsibility, and diversity, both as individuals and in team environments.

35
Student Outcomes and Relationship to Chemical Engineering Technology Program Educational Objectives:
The students will be able to: Chemical Engineering and Process Technology Educational Objectives 1 2 3 4 5 a. apply the acquired knowledge, technical skills and the use of modern tools in chemical and process engineering technology to narrowly defined chemical and process engineering technology activities; • b. apply knowledge of mathematics, science, engineering and technology to solve emerging problems in the field of chemical and process engineering technology; c. identify, formulate and solve technical problems in the field of chemical and process engineering technology using the skills of critical thinking and creative problem solving; d. conduct standard tests and measurements, and to conduct, analyze and interpret data, prepare technical reports and apply experimental results for chemical process and technology improvement; e. function effectively as a member of a multi-disciplinary team in a variety of working environments; f. demonstrate an adequate level of competency and proficiency in written, oral and graphical communications; g. recognize and appreciate the need to and be capable to engage in life-long learning for his professional development h. understand and appreciate professional, ethical and social responsibilities, and diversity when working as an individual and in team; and i. demonstrate a commitment to quality, timelines, and continuous improvement to enhance their professional career and the society.

36
THANK YOU

Similar presentations


. 1. A competent environmental technologist with strong understanding of fundamental scientific and technological.>")


 created National Educational Technology.>")


