Download presentation
Presentation is loading. Please wait.

1
Teaching High School Geometry
Note to presenter: Distribute file #31: ‘Geometry NCTM Article’. Time permitting, you may want to have participants read and discuss the article in their groups. Even better: if they could have read the article before your presentation, you could proceed right into a general discussion. If you are looking for a warm-up activity, we’d suggest file #27 ‘Paper Cylinder. Have participants work in groups and discuss their solutions. New York City Department of Education Department of Mathematics

2
Agenda Content and Process Strands
Geometry Course Topics and Activities Topics New to High School Geometry Looking at the New Regents Exam Note to presenter: Distribute file #11 ‘Table of Contents – Mathematics Toolkit’. This document from the NY State Education Department website lists many of the resources available there for downloading. Particularly useful are the glossaries and sample tasks for all of the high school courses. Several of the documents that they will be receiving during today’s presentation come from this website. Since there is a lot of material in this presentation, our advice would be to spend relatively little time on the first segment ‘Content and Process Strands’, since some of your audience has probably already been exposed to this information. Should there be questions on any of the information presented in slides 3 through 8, refer participants to the NYSED website (URL is listed on file # 11 and on the last slide in this presentation). New York City Department of Education Department of Mathematics
. New York City Department of Education. Department of Mathematics.")
3
Algebra 2 and Trigonometry 2006-07 X 2007-08
New Mathematics Regents Implementation / Transition Timeline Math A Math B Algebra Geometry Algebra 2 and Trigonometry X School curricular and instructional alignment and SED item writing and pre-testing First admin. in June 2008, Post-equate Last admin. in January 2009 First admin. in June 2009, Post-equate Last admin. in June 2010 X First admin. in June 2010, Post-equate Note to presenter: Distribute files #01 ‘Course Descriptions HS’, #02: ‘New Mathematics Regents Implementation/Transition Timeline’, and #03 ‘ATS Codes Alg + Geometry’ As you see, we will soon be entering year two of the transition to new high school math standards. As background let’s take a brief look at those new standards.

4
Standard 3 The Three Components
Conceptual Understanding consists of those relationships constructed internally and connected to already existing ideas. Procedural Fluency is the skill in carrying out procedures flexibly, accurately, efficiently, and appropriately. Problem Solving is the ability to formulate, represent, and solve mathematical problems. According to the New York State Education Department, the goal of math education is to strengthen our students’ abilities in these areas. The SED classifies Regents exam questions into three categories; Procedural, Conceptual and Problem Solving. Procedural A procedural question is designed to test the student’s ability to perform mathematical computation. Example: The product of 4x2y and 2xy3 is (1) 8x2 y (2) 8x3 y (3) 8x3 y (4) 8x2 y4 Conceptual A conceptual question tests knowledge or/and understanding of a mathematical concept. Typical examples are questions involving definitions or interpretations of definitions. This type of question involves little or no computation. Which set is closed under division? (1) {1} (3) integers (2) counting numbers (4) whole numbers Problem Solving A Problem Solving question requires critical thinking. All problem-solving questions contain procedural and conceptual elements. Typical examples of this type of questions are word problems and math puzzles. Two trains leave the same station at the same time and travel in opposite directions. One train travels at 80 kilometers per hour and the other at 100 kilometers per hour. In how many hours will they be 900 kilometers apart?
 8x2 y3 (2) 8x3 y3 (3) 8x3 y4 (4) 8x2 y4. Conceptual. A conceptual question tests knowledge or/and understanding of a mathematical concept. Typical examples are questions involving definitions or interpretations of definitions. This type of question involves little or no computation. Which set is closed under division (1) {1} (3) integers. (2) counting numbers (4) whole numbers. Problem Solving. A Problem Solving question requires critical thinking. All problem-solving questions contain procedural and conceptual elements. Typical examples of this type of questions are word problems and math puzzles. Two trains leave the same station at the same time and travel in opposite directions. One train travels at 80 kilometers per hour and the other at 100 kilometers per hour. In how many hours will they be 900 kilometers apart")
5
Performance Indicator Organization
1996 Mathematics Standard and Core Curriculum 2005 Mathematics Standard and Core Curriculum 1996 Mathematics Standard Seven Key Ideas · Mathematical Reasoning · Number and Numeration · Operations · Modeling/Multiple Representation · Measurement · Uncertainty · Patterns/Functions · Performance indicators are organized under the seven key ideas and contain an includes (testing years) or may include (non-testing years) columns for further clarification. 2005 Mathematics Standard Five Process Strands Problem Solving Reasoning and Proof Communication Connections Representation Five Content Strands Number Sense and Operations Algebra Geometry Measurement Statistics and Probability · Performance indicators are organized under major understandings within the content and process strands and content performance indicators are separated into bands within each of the content strands. We see a comparison of the new standards with those from the 1990s. The new arrangement, with five content and five process strands, is much more intuitive and user-friendly. One example: ‘Mathematical Reasoning’, first of the seven Key Ideas from 1996, sounds as though it would be one of the broadest categories; what, after all, would not fit under mathematical reasoning? However, as it was then defined it was one of the narrowest, referring only to questions involving the truth value of conditional statements, converse, inverse and contrapositive. On the other hand, ‘Modeling/Multiple Representations’ and ‘Measurement’ were so broad, covering dozens of disparate topics, that they were of little help as useful categories. The 2005 system is a decided improvement.
 or may include (non-testing years) columns for further clarification Mathematics Standard. Five Process Strands. Problem Solving. Reasoning and Proof. Communication. Connections. Representation. Five Content Strands. Number Sense and Operations. Algebra. Geometry. Measurement. Statistics and Probability. · Performance indicators are organized under major understandings within the content and process strands and content performance indicators are separated into bands within each of the content strands. We see a comparison of the new standards with those from the 1990s. The new arrangement, with five content and five process strands, is much more intuitive and user-friendly. One example: ‘Mathematical Reasoning’, first of the seven Key Ideas from 1996, sounds as though it would be one of the broadest categories; what, after all, would not fit under mathematical reasoning However, as it was then defined it was one of the narrowest, referring only to questions involving the truth value of conditional statements, converse, inverse and contrapositive. On the other hand, ‘Modeling/Multiple Representations’ and ‘Measurement’ were so broad, covering dozens of disparate topics, that they were of little help as useful categories. The 2005 system is a decided improvement.")
6
Content and Process Strands
Standard 3 Content and Process Strands The Five Content Strands The Five Process Strands Number Sense and Operations Problem Solving Algebra Reasoning and Proof Geometry Communication Measurement Connections Statistics and Probability Representation Again, the 2005 standards are organized into five Content Strands and five Process Strands. The content strands tell us the “WHAT” while the process strands tell us the “HOW”. Within each content strand there are bands which organize topics more specifically, and finally a performance indicator specific to each individual topic in the curriculum.

7
Note to presenter: This grid is a graphical representation of the way that the process and content strands are interrelated. Process strands are woven throughout the content strands. For example, Problem Solving is a process used in every one of the content strands. Please note that the bars rest on a “mat” which underlines the importance of conceptual understanding, procedural proficiency and problem solving. This graphic implicitly defines Mathematical Proficiency as a balance among the three of them. Students will become successful in mathematics only if they see mathematics as a whole, not as isolated skills and facts. As we develop our instructional plans and assessment techniques, we must pay attention to the integration of process and content. Otherwise we risk producing students who have temporary knowledge but who are unable to apply mathematics in realistic settings. Curriculum, instruction, and assessment are intricately related and must be designed with this in mind. All three of them must address conceptual understanding, procedural fluency, and problem solving. If this is accomplished, we will produce students who will (1) have mathematical knowledge, (2) have an understanding of mathematical concepts, and (3) be able to apply mathematics in the solution of problems.
 have mathematical knowledge, (2) have an understanding of mathematical concepts, and (3) be able to apply mathematics in the solution of problems.")
8
Comparison of 1998 Seven Key Ideas
and 2005 Process and Content Strands 1998 Key Ideas 2005 Process and Content Strands Broad in scope and transcend the various branches of mathematics (arithmetic, number theory, algebra, geometry, etc.) Lack of specificity in the may include column for each performance indicators Difference between the may include and includes columns for performance indicators is not clearly indicated Processes of mathematics (problem solving, communication, etc.) are, for the most part, included in the narrative of the document. Process and Content Strands are aligned to the National Council of Teachers of Mathematics Standards The processes of mathematics as well as the content of mathematics have performance indicators Performance indicators are clearly delineated and more specific. New York’s standards are in line with a nation-wide effort to improve mathematics instruction, spearheaded by the National council of Teachers of Mathematics. We’ll be looking at the Performance Indicators in more detail shortly.
 Lack of specificity in the may include column for each performance indicators. Difference between the may include and includes columns for performance indicators is not clearly indicated. Processes of mathematics (problem solving, communication, etc.) are, for the most part, included in the narrative of the document. Process and Content Strands are aligned to the National Council of Teachers of Mathematics Standards. The processes of mathematics as well as the content of mathematics have performance indicators. Performance indicators are clearly delineated and more specific. New York’s standards are in line with a nation-wide effort to improve mathematics instruction, spearheaded by the National council of Teachers of Mathematics. We’ll be looking at the Performance Indicators in more detail shortly.")
9
Number of Performance Indicators for Each Course Content Strand
Integrated Algebra Geometry Algebra 2 and Trigonometry Total Number Sense and Operations 8 10 18 Algebra 45 77 122 74 84 Measurement 3 2 5 Statistics and Probability 23 16 39 TOTAL 89 105 268 This table helps us to see at a simple glance the distribution of the Performance Indicators within the Content Strands. Ask participants to consider in their groups: “In what way does this chart show a difference between the geometry course and the other two high school math courses?” [Unlike the other two high school courses, Geometry has none of the other four Content Strands represented.]

10
Geometry Bands •Shapes •Geometric Relationships •Constructions •Locus
•Informal Proofs •Formal Proofs •Transformational Geometry •Coordinate Geometry Since all of the performance indicators for this course are within the geometry content strand, it’s actually the bands within the geometry strand that show us the major areas which comprise the course. Note to presenter: Distribute files: #07 ‘NY Geometry Shape’, #08 ’NY Geometry Relationships’, #09 ‘NY Geometry Transformations’ and #10 ‘NY Geometry Coordinate Geometry’. These provide a band trace back through elementary and middle school, showing in which specific grades geometry topics within these bands were first introduced to students.

11
Which topics are in the new geometry course?
The course consists of 74 performance indicators, which are the most specific way to look at the content. Note to presenter: Distribute files #04 ‘Geometry Topics Overview’, and #05: ‘Geometry Performance Indicators (Content)’. Besides having participants follow along, time permitting, you may want to have them discuss their own experience in teaching (or learning) these topics. The overview provides a one-page summary of the topics addressed in the course; the larger file lists each of the performance indicators.
’. Besides having participants follow along, time permitting, you may want to have them discuss their own experience in teaching (or learning) these topics. The overview provides a one-page summary of the topics addressed in the course; the larger file lists each of the performance indicators.")
12
Performance Topics Indicators
1 – 9 Perpendicular lines and planes 10 – 16 Properties and volumes of three- dimensional figures, including prism, regular pyramid, cylinder, right circular cone, sphere These slides present an overview. For much more detailed information, please visit the NY State Education Department’s website. (We’ve listed the URL on the last slide in this presentation). Some of these are new topics; we’ll be focusing on the topics new to high school geometry in a few moments. Note to presenter: Distribute file #12: ‘Geometry Vocabulary’
. Some of these are new topics; we’ll be focusing on the topics new to high school geometry in a few moments. Note to presenter: Distribute file #12: ‘Geometry Vocabulary’")
13
Volume and Surface Area of Rectangular Prism
Note to presenter: Distribute file #14 ‘Volume SA of Rectangular Prism’. If time permits, have participants work in groups and discuss their solutions.

14
Performance Topics Indicators
17 – 21 Constructions: angle bisector, perpendicular bisector, parallel through a point, equilateral triangle; 22, 23 Locus: concurrence of median, altitude, angle bisector, perpendicular bisector; compound loci

15
Performance Topics Indicators
24 – 27 Logic and proof: negation, truth value, conjunction, disjunction, conditional, biconditional, inverse, converse, contrapositive; hypothesis → conclusion 28, 29 Triangle congruence (SSS, SAS,ASA, AAS, HL) and corresponding parts
 and corresponding parts.")
16
Area Without Numbers Note to presenter: Distribute files #15 and #16 ‘Area Without Numbers’. If time permits, have participants work in groups and discuss their solutions.

17
Performance Topics Indicators
30 – 48 Investigate, justify and apply theorems (angles and polygons): Sum of angle measures (triangles and polygons): interior and exterior Isosceles triangle Geometric inequalities Triangle inequality theorem Largest angle, longest side Transversals and parallel lines
: Sum of angle measures (triangles and polygons): interior and exterior. Isosceles triangle. Geometric inequalities. Triangle inequality theorem. Largest angle, longest side. Transversals and parallel lines.")
18
Performance Topics Indicators
30 – 48 Investigate, justify and apply theorems (angles and polygons): Parallelograms (including special cases), trapezoids Line segment joining midpoints, line parallel to side (proportional) Centroid Similar triangles (AA, SAS, SSS) Mean proportional Pythagorean theorem, converse
: Parallelograms (including special cases), trapezoids. Line segment joining midpoints, line parallel to side (proportional) Centroid. Similar triangles (AA, SAS, SSS) Mean proportional. Pythagorean theorem, converse.")
19
Exhibit: Semantic Feature Analysis Matrix
Terms Features Properties Note to presenter: Distribute file #17 ‘Semantic Features’. If time permits, have participants work in groups and discuss their solutions.

20
Performance Topics Indicators
49 – 53 Investigate, justify and apply theorems (circles): Chords: perpendicular bisector. relative lengths Tangent lines Arcs, rays (lines intersecting on, inside, outside) Segments intersected by circle along tangents, secants
: Chords: perpendicular bisector. relative lengths. Tangent lines. Arcs, rays (lines intersecting on, inside, outside) Segments intersected by circle along tangents, secants.")
21
Note to presenter: Distribute file #18 ‘Center of a Circle’
Note to presenter: Distribute file #18 ‘Center of a Circle’. If time permits, have participants work in groups and discuss their solutions. There should be several different ways that can be presented. Center of a Circle Find different ways, as many as you can, to determine the center of a circle. Imagine that you have access to tools such as compass, ruler, square corner, protractor, etc. Be able to justify that you have found the center.

22
Performance Topics Indicators
54 – 61 Transformations Isometries (rotations, reflections, translations, glide reflections) Use to justify geometric relationships Similarities (dilations) Properties that remain invariant Note to presenter: Distribute file #19 ‘Symmetry’. If time permits, have participants work in groups and discuss their solutions.
 Use to justify geometric relationships. Similarities (dilations) Properties that remain invariant. Note to presenter: Distribute file #19 ‘Symmetry’. If time permits, have participants work in groups and discuss their solutions.")
23
Fold and Punch Take a square piece of paper. Fold it and make one punch so that you will have one of the following patterns when you open it. Note to presenter: Distribute file #20 ‘Fold and Punch’. If time permits, have participants work in groups and discuss their solutions. When they have finished, distribute file #21 ‘Fold and Punch Key’, with the solutions.

24
Translational Symmetry
Venn Symmetry Reflective Symmetry Translational Symmetry Rotational Symmetry Note to presenter: Distribute file #22 ‘Venn Symmetry’. If time permits, have participants work in groups and discuss their solutions.

25
Performance Topics Indicators
62 – 68 Coordinate geometry: Distance, midpoint, slope formulas to find equations of lines perpendicular, parallel, and perpendicular bisector

26
Performance Topics Indicators
69 Coordinate geometry: Properties of triangles and quadrilaterals 70 Coordinate geometry: Linear- quadratic systems

27
Area of a Triangle on a Coordinate Plane
Two vertices of a triangle are located at (0,6) and (0,12). The area of the triangle is 12 units2. Note to presenter: Distribute file #23 ‘Area of a Triangle on a Coordinate Plane’. If time permits, have participants work in groups and discuss their solutions.
 and (0,12). The area of the triangle is 12 units2. Note to presenter: Distribute file #23 ‘Area of a Triangle on a Coordinate Plane’. If time permits, have participants work in groups and discuss their solutions.")
28
Performance Topics Indicators
71 – 74 Coordinate geometry: Circles: equations, graphs (centered on and off origin)
")
29
Note to presenter: Distribute files #25 ‘Topics New to Geometry Course’ and #24 ‘Crosswalk Geometry’. Document #24 shows where each performance indicator has previously been taught (or not). One warning: the NY State Education Department has published this and we make it available to show where (in Math A, Math B or elsewhere) topics have previously been taught; however, we have discovered that some of the listings describing a topic as ‘Not previously addressed’ are inaccurate, so instead of relying on it for that, please refer to file #25 ‘Topics New to Geometry Course’, which accurately lists all 15 topics never before addressed. About 20% of the topics in the new Geometry course have not been addressed in previous high school courses.

30
Which topics have not been addressed in previous high school courses?
Note to presenter: Distribute file #06 ‘Geometry Sample Tasks’. This document shows what problems will look like, keyed to each performance indicator.

31
centroid circumcenter incenter of a triangle orthocenter

32
centroid (G) The point of concurrency of the medians of a triangle; the center of gravity in a triangle. circumcenter (G) The center of the circle circumscribed about a polygon; the point that is equidistant from the vertices of any polygon. incenter of a triangle (G) The center of the circle that is inscribed in a triangle; the point of concurrence of the three angle bisectors of the triangle which is equidistant from the sides of the triangle. orthocenter (G) The point of concurrence of the three altitudes of a triangle.
 The center of the circle circumscribed about a polygon; the point that is equidistant from the vertices of any polygon. incenter of a triangle (G) The center of the circle that is inscribed in a triangle; the point of concurrence of the three angle bisectors of the triangle which is equidistant from the sides of the triangle. orthocenter (G) The point of concurrence of the three altitudes of a triangle.")
33
isometry symmetry plane

34
isometry (G) A transformation of the plane that preserves distance.
If P′ is the image of P, and Q′ is the image of Q, then the distance from P′ to Q′ is the same as the distance from P to Q. symmetry plane (G) A plane that intersects a three-dimensional figure such that one half is the reflected image of the other half.
 A plane that intersects a three-dimensional figure such that one half is the reflected image of the other half.")
35
A Symmetry Plane

36
Geometric Relationships 1 Theorems and Postulates
G.G.1 If a line is perpendicular to each of two intersecting lines at their point of intersection, then the line is perpendicular to the plane determined by them G.G.2 Through a given point there passes one and only one plane perpendicular to a given line G.G.3 Through a given point there passes one and only one line perpendicular to a given plane G.G.4 Two lines perpendicular to the same plane are coplanar G.G.5 Two planes are perpendicular to each other if and only if one plane contains a line perpendicular to the second plane

37
G.G.1b Study the drawing below of a pyramid whose base is quadrilateral ABCD. John claims that line segment EF is the altitude of the pyramid. Explain what John must do to prove that he is correct.

38
G.G.3a Examine the diagram of a right triangular prism. Describe how a plane and the prism could intersect so that the intersection is: a line parallel to one of the triangular bases a line perpendicular to the triangular bases a triangle a rectangle a trapezoid

39
G.G.4b The figure below in three-dimensional space, where AB is perpendicular to BC and DC is perpendicular to BC, illustrates that two lines perpendicular to the same line are not necessarily parallel. Must two lines perpendicular to the same plane be parallel? Discuss this problem with a partner.

40
Geometric Relationships 2 More Theorems and Postulates
G.G.6 If a line is perpendicular to a plane, then any line perpendicular to the given line at its point of intersection with the given plane is in the given plane G.G.7 If a line is perpendicular to a plane, then every plane containing the line is perpendicular to the given plane G.G.8 If a plane intersects two parallel planes, then the intersection is two parallel lines G.G.9 If two planes are perpendicular to the same line, they are parallel

41
G.G.7a Examine the four figures below:
Each figure has how many symmetry planes? Describe the location of all the symmetry planes for each figure.

42
G.G.9a The figure below shows a right hexagonal prism.
A plane that intersects a three-dimensional figure such that one half is the reflected image of the other half is called a symmetry plane. On a copy of the figure sketch a symmetry plane. Then write a description of the symmetry plane that uses the word parallel. On a copy of the figure sketch another symmetry plane. Then write a description that uses the word perpendicular.

43
Geometric Relationships 3 Prisms
G.G.10 The lateral edges of a prism are congruent and parallel G.G.11 Two prisms have equal volumes if their bases have equal areas and their altitudes are equal

44
G.G.11a Examine the prisms below. Calculate the volume of each of the prisms. Observe your results and make a mathematical conjecture. Share your conjecture with several other students and formulate a conjecture that the entire group can agree on. Write a paragraph that proves your conjecture.

45
Locus G.G.21 Concurrence of medians, altitudes, angle bisectors, and perpendicular bisectors of triangles

46
G.G.21a Using dynamic geometry software locate the circumcenter, incenter, orthocenter, and centroid of a given triangle. Use your sketch to answer the following questions: Do any of the four centers always remain inside the circle? If a center is moved outside the triangle, under what circumstances will it happen? Are the four centers ever collinear? If so, under what circumstances? Describe what happens to the centers if the triangle is a right triangle.

47
Informal and Formal Proofs 1
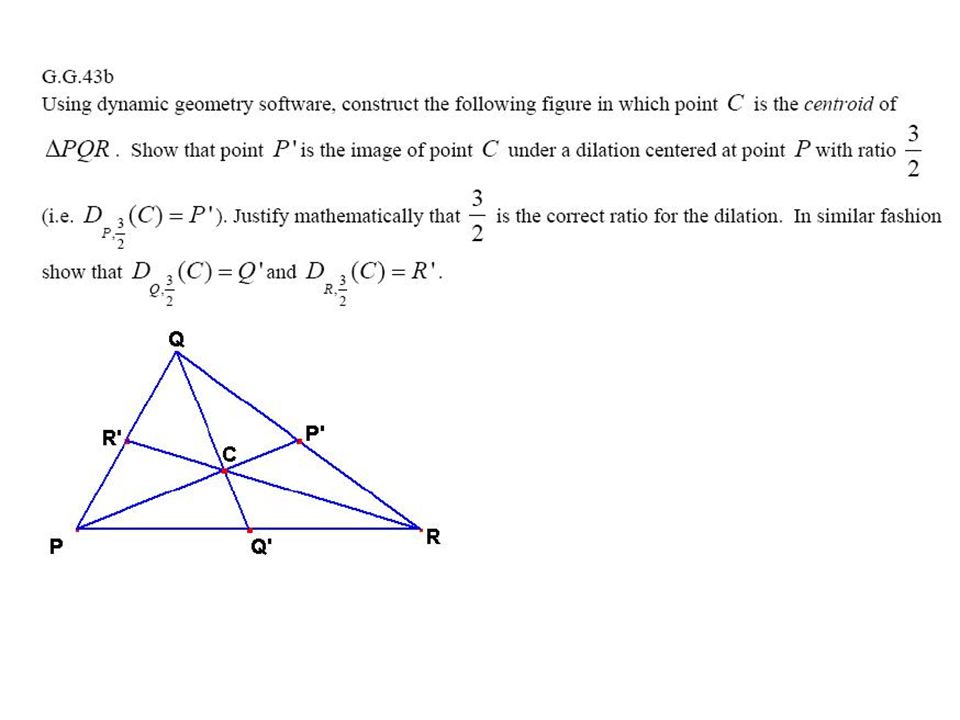
G.G.43 Theorems about the centroid of a triangle, dividing each median into segments whose lengths are in the ratio 2:1

48
G.G.43a The vertices of a triangle ABC are A(4,5), B(6,1), and C(8,9). Determine the coordinates of the centroid of triangle ABC and investigate the lengths of the segments of the medians. Make a conjecture.
, B(6,1), and C(8,9). Determine the coordinates of the centroid of triangle ABC and investigate the lengths of the segments of the medians. Make a conjecture.")
50
Informal and Formal Proofs 2 Similarity
G.G.46 Theorems about proportional relationships among the segments of the sides of the triangle, given one or more lines parallel to one side of a triangle and intersecting the other two sides of the triangle

51
G.G.46a In ΔABC , DE is drawn parallel to AC . Model this drawing using dynamic geometry software. Using the measuring tool, determine the lengths AD, DB, CE, EB, DE, and AC. Use these lengths to form ratios and to determine if there is a relationship between any of the ratios. Drag the vertices of the original triangle to see if any of the ratios remain the same. Write a proof to establish your work.

52
Transformational Geometry
G.G.60 Similarities: observing orientation, numbers of invariant points, and/or parallelism

53
G.G.60a In the accompanying figure, ΔABC is an equilateral triangle. If ΔADE is similar to ΔABC, describe the isometry and the dilation whose composition is the similarity that will transform ΔABC onto ΔADE.

54
G.G.60b Harry claims that ΔPMN is the image of ΔNOP under a reflection over PN.. How would you convince him that he is incorrect? Under what isometry would ΔPMN be the image of ΔNOP?

55
Looking at the new Regents exam
Note to presenter: Distribute file #26 ‘Geometry Test Specifications’.

56
Content Band % of Total Credits Geometric Relationships 8–12% Constructions 3–7% Locus 4–8% Informal and Formal Proofs 41–47% Transformational Geometry 8–13% Coordinate Geometry 23–28%

57
Specifications for the Regents Examination in Geometry
Question Type Number of Questions Point Value Multiple choice 28 56 2-credit open-ended 6 12 4-credit open-ended 3 6-credit open-ended 1 Total 38 86

58
Calculators Schools must make a graphing calculator available for the
exclusive use of each student while that student takes the Regents examination in Geometry.

59
Reference Sheet The Regents Examination in Geometry will include a reference sheet containing the formulas specified below.

60
Core Curriculum, Sample Tasks, Glossary, Course Descriptions, Crosswalks and Other Resources: Note to presenter: Distribute file #13 ‘Project MATHEMATICS’. One final resource, this website lists inexpensive DVDs on math topics (primarily geometry), produced at CalTech. New York City Department of Education Department of Mathematics
, produced at CalTech. New York City Department of Education. Department of Mathematics.")
Similar presentations