Download presentation
Presentation is loading. Please wait.

1
Maps and Mapping Learning intentions:
Recognize the changes that have occurred in maps Understand that maps serve different purposes Be able to name some of the types of maps and map projections Do quick quiz on themes before lesson

2
Map Projections Believe it or not, there have been several controversies over the representation of the Earth on world maps. What could be the issue with some of the following maps?

3
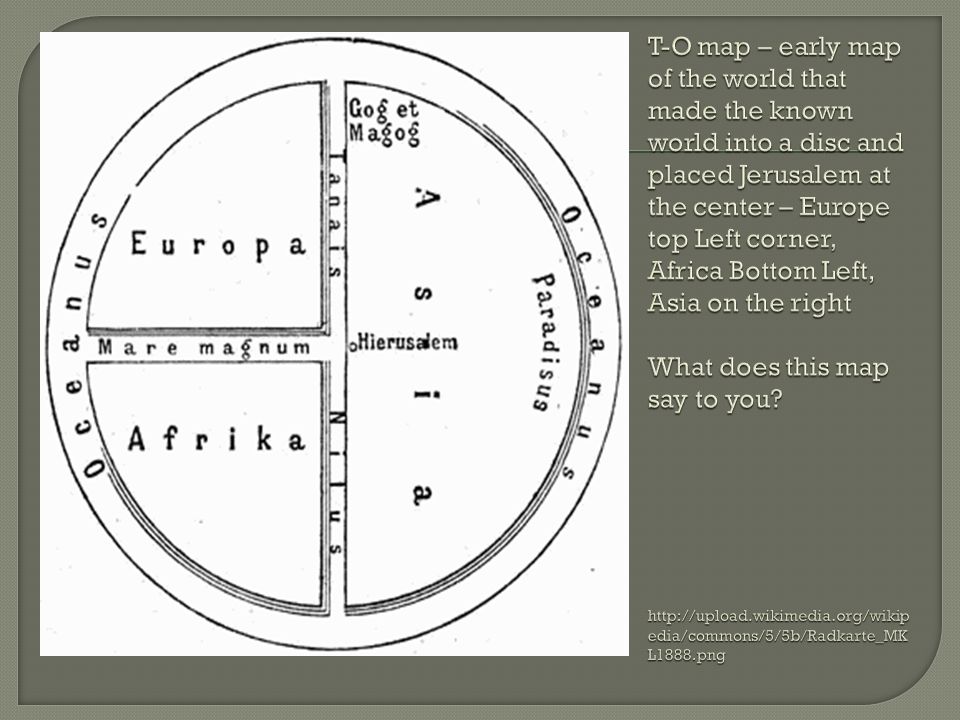
T-O map – early map of the world that made the known world into a disc and placed Jerusalem at the center – Europe top Left corner, Africa Bottom Left, Asia on the right What does this map say to you?
4
What about this map from 1550. What inaccuracies can you find

5
Map Projections When we look at a map, it is a two dimensional representation of what the Earth looks like. When making a map, a cartographer must represent the curved surface on a flat page, while minimizing distortion to preserve accuracy. Things a cartographer must remember to preserve are: Distance Direction Area Shape Proximity What would be most important to you as a cartographer?

6
Types of projections A cylindrical projection looks like this
Cylindrical projection maps, in which a cylinder which is wrapped around the Earth at the Equator, are often used for complete world maps. On a cylindrical projection map, the longitude and latitude lines are straight.

7
An Oval Projection The elliptical or oval projection, sacrifices accurate angles and shapes in favour of accurate area representations.

8
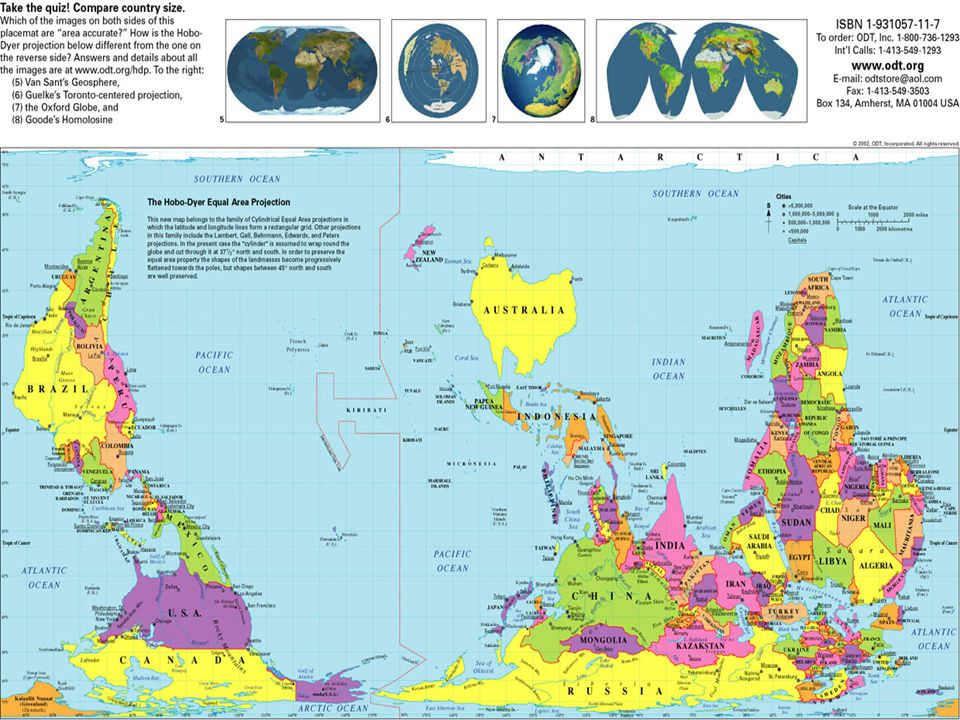
Hobo-Dyer Map From Wikipedia: The Hobo-Dyer map projection is a cylindrical equal-area projection. The cylinder is usually assumed to wrap around the globe and cut through the surface at 37.5° north and south. The Hobo-Dyer is often used with the south pole at the top of the map.[1] Taking a look at the next slide, who might like the Hobo-Dyer map?

10
Lines of the Earth Lines of Latitude Lines of Longitude
Lines of Latitude or Parallels: imaginary lines (they aren’t actually on the surface of the Earth) that run East-West cutting the Earth into North and South Sections. So they measure distance north or south of the Equator 0 degrees latitude is the Equator 90 degrees N is North Pole, 90 degrees S would be... South Pole Tropic of Cancer 23.5 N Tropic Capricorn 23.5 S Arctic Circle 66.5 N Antarctic Circle 66.5 S Lines of Longitude or Meridians: imaginary lines that run North-South and measure distance east or west of the prime or Greenwich meridian (0 degrees longitude) 0 degrees is the Prime or Greenwich meridian that runs through London England 180 degrees is the international dateline, running through the Pacific Ocean
 that run East-West cutting the Earth into North and South Sections. So they measure distance north or south of the Equator. 0 degrees latitude is the Equator. 90 degrees N is North Pole, 90 degrees S would be... South Pole. Tropic of Cancer 23.5 N Tropic Capricorn 23.5 S. Arctic Circle 66.5 N Antarctic Circle 66.5 S. Lines of Longitude or Meridians: imaginary lines that run North-South and measure distance east or west of the prime or Greenwich meridian (0 degrees longitude) 0 degrees is the Prime or Greenwich meridian that runs through London England. 180 degrees is the international dateline, running through the Pacific Ocean.")
11
Latitude and Longitude

12
Relative location: Location of a place in relation to another
- EG I am standing ____of the windows and ___of the mountains - EG Vancouver is West of Alberta and North of Washington - Share with your partner the relative location of the school to your house

13
Review for classwork REMEMBER!!
The Earth’s grid is a combination of lines of latitude (north and south degrees) and longitude (east and west degrees) Using the grid, you can pinpoint the absolute location of places around the world Photo copy Earth grid work
 and longitude (east and west degrees) Using the grid, you can pinpoint the absolute location of places around the world. Photo copy Earth grid work.")
14
Types of Maps We are used to seeing Political or physical maps
However, there are maps that serve a variety of purposes Can you name any other types of maps that you might have seen or used? Here are some examples

15
Political Map: Shows boundaries, international boarders, and capitial cities

16
A physical map shows us: Land forms (mountains, lowlands, deserts, plains) Bodies of water (lake, rivers, ocean) The colours used on the map are the key to identifying the different physical features
 Bodies of water (lake, rivers, ocean) The colours used on the map are the key to identifying the different physical features")
17
A climate map shows us the average temperatures or precipitation in a region for a time of year:

18
Topographical maps: show us through the use of contour lines the high or elevation of a region.
Topographic maps are important because they show how high land features are, and how steep the elevation gain is. One reads the topographic map using contour lines. Contour lines are lines that represent equal gains of elevation on the ground

19
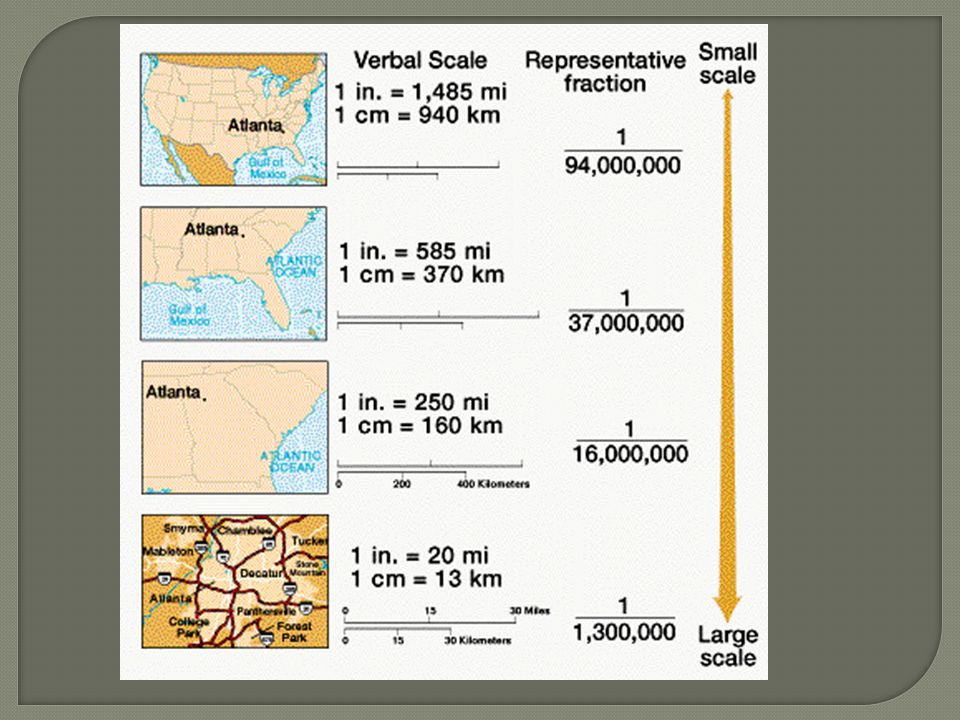
Scale REMEMBER!! Scale is used on maps to measure distance and area
There are 3 ways to show scale: Graphic, verbal or statement, and representative fraction A map showing a large area with very little detail uses a small scale A map showing a small area with great detail uses a large scale “small scale = big area large scale = lots of detail”

21
Class work Complete the exercises on Earth Grid, scale and distance, and types of Maps Terms you need to have defined in your notes! Lines of Latitude (aka Parallels) Lines of Longitude (aka Meridians) Photocopy Earth grid, scale and map work sheets.
 Lines of Longitude (aka Meridians) Photocopy Earth grid, scale and map work sheets.")
Similar presentations

 W (Want to know) L (What I learned) Warm up- take out a piece of paper and do the “K” and the “W” for the above topic.>")


