Download presentation
Presentation is loading. Please wait.

1
LEHNINGER PRINCIPLES OF BIOCHEMISTRY
David L. Nelson and Michael M. Cox LEHNINGER PRINCIPLES OF BIOCHEMISTRY Fifth Edition CHAPTER 7 Carbohydrates and Glycobiology Dr.Nouri © 2008 W. H. Freeman and Company

2
CARBOHYDRATES Introduction Monosaccharides &Disaccharides Aldoses & Ketosis Enantiomer Cyclic Structure Anomer Mutaratation Glycosidic bond Polysaccharides

3
Representative monosaccharides
aldose carbonyl group ketose FIGURE 7-1a Representative monosaccharides. (a)Two trioses, an aldose and a ketose. The carbonyl group in each is shaded.
Two trioses, an aldose and a ketose. The carbonyl group in each is shaded.")
4
Representative monosaccharides
FIGURE 7-1b Representative monosaccharides. (b) Two common hexoses.
 Two common hexoses.")
5
Representative monosaccharides
FIGURE 7-1c Representative monosaccharides. (c) The pentose components of nucleic acids. D-Ribose is a component of ribonucleic acid (RNA), and 2-deoxy-D-ribose is a component of deoxyribonucleic acid (DNA).
 The pentose components of nucleic acids. D-Ribose is a component of ribonucleic acid (RNA), and 2-deoxy-D-ribose is a component of deoxyribonucleic acid (DNA).")
6
Chiral Crbon Atoms in monosaccharide's
Enantiomers Three ways to represent the two enantiomers of glyceraldehyde FIGURE 7-2 Three ways to represent the two enantiomers of glyceraldehyde. The enantiomers are mirror images of each other. Ball-and-stick models show the actual configuration of molecules. Recall (see Figure 1-17) that in perspective formulas, solid wedge-shaped bonds point toward the reader, dashed wedges point away.
 that in perspective formulas, solid wedge-shaped bonds point toward the reader, dashed wedges point away.")
7
FIGURE 7-2 (part 1) Three ways to represent the two enantiomers of glyceraldehyde. The enantiomers are mirror images of each other. Ball-and-stick models show the actual configuration of molecules. Recall (see Figure 1-17) that in perspective formulas, solid wedge-shaped bonds point toward the reader, dashed wedges point away.
 that in perspective formulas, solid wedge-shaped bonds point toward the reader, dashed wedges point away..")
8
FIGURE 7-2 (part 2) Three ways to represent the two enantiomers of glyceraldehyde. The enantiomers are mirror images of each other. Ball-and-stick models show the actual configuration of molecules. Recall (see Figure 1-17) that in perspective formulas, solid wedge-shaped bonds point toward the reader, dashed wedges point away.
 that in perspective formulas, solid wedge-shaped bonds point toward the reader, dashed wedges point away..")
9
FIGURE 7-2 (part 3) Three ways to represent the two enantiomers of glyceraldehyde. The enantiomers are mirror images of each other. Ball-and-stick models show the actual configuration of molecules. Recall (see Figure 1-17) that in perspective formulas, solid wedge-shaped bonds point toward the reader, dashed wedges point away.
 that in perspective formulas, solid wedge-shaped bonds point toward the reader, dashed wedges point away..")
10
monosaccharide's TRIOSE &TETROSES
FIGURE 7-3a (part 1) Aldoses and ketoses. The series of (a) D-aldoses and (b) D-ketoses having from three to six carbon atoms, shown as projection formulas. The carbon atoms in red are chiral centers. In all these D isomers, the chiral carbon most distant from the carbonyl carbon has the same configuration as the chiral carbon in D-glyceraldehyde. The sugars named in boxes are the most common in nature; you will encounter these again in this and later chapters.
 Aldoses and ketoses. The series of (a) D-aldoses and (b) D-ketoses having from three to six carbon atoms, shown as projection formulas. The carbon atoms in red are chiral centers. In all these D isomers, the chiral carbon most distant from the carbonyl carbon has the same configuration as the chiral carbon in D-glyceraldehyde. The sugars named in boxes are the most common in nature; you will encounter these again in this and later chapters.")
11
monosaccharide's PENTOSES
FIGURE 7-3a (part 2) Aldoses and ketoses. The series of (a) D-aldoses and (b) D-ketoses having from three to six carbon atoms, shown as projection formulas. The carbon atoms in red are chiral centers. In all these D isomers, the chiral carbon most distant from the carbonyl carbon has the same configuration as the chiral carbon in D-glyceraldehyde. The sugars named in boxes are the most common in nature; you will encounter these again in this and later chapters.
 Aldoses and ketoses. The series of (a) D-aldoses and (b) D-ketoses having from three to six carbon atoms, shown as projection formulas. The carbon atoms in red are chiral centers. In all these D isomers, the chiral carbon most distant from the carbonyl carbon has the same configuration as the chiral carbon in D-glyceraldehyde. The sugars named in boxes are the most common in nature; you will encounter these again in this and later chapters.")
12
monosaccharide's HEXOSES
FIGURE 7-3a (part 3) Aldoses and ketoses. The series of (a) D-aldoses and (b) D-ketoses having from three to six carbon atoms, shown as projection formulas. The carbon atoms in red are chiral centers. In all these D isomers, the chiral carbon most distant from the carbonyl carbon has the same configuration as the chiral carbon in D-glyceraldehyde. The sugars named in boxes are the most common in nature; you will encounter these again in this and later chapters.
 Aldoses and ketoses. The series of (a) D-aldoses and (b) D-ketoses having from three to six carbon atoms, shown as projection formulas. The carbon atoms in red are chiral centers. In all these D isomers, the chiral carbon most distant from the carbonyl carbon has the same configuration as the chiral carbon in D-glyceraldehyde. The sugars named in boxes are the most common in nature; you will encounter these again in this and later chapters.")
13
monosaccharide's FIGURE 7-3b (part 1) Aldoses and ketoses. The series of (a) D-aldoses and (b) D-ketoses having from three to six carbon atoms, shown as projection formulas. The carbon atoms in red are chiral centers. In all these D isomers, the chiral carbon most distant from the carbonyl carbon has the same configuration as the chiral carbon in D-glyceraldehyde. The sugars named in boxes are the most common in nature; you will encounter these again in this and later chapters.
 Aldoses and ketoses. The series of (a) D-aldoses and (b) D-ketoses having from three to six carbon atoms, shown as projection formulas. The carbon atoms in red are chiral centers. In all these D isomers, the chiral carbon most distant from the carbonyl carbon has the same configuration as the chiral carbon in D-glyceraldehyde. The sugars named in boxes are the most common in nature; you will encounter these again in this and later chapters.")
14
monosaccharide's FIGURE 7-3b (part 2) Aldoses and ketoses. The series of (a) D-aldoses and (b) D-ketoses having from three to six carbon atoms, shown as projection formulas. The carbon atoms in red are chiral centers. In all these D isomers, the chiral carbon most distant from the carbonyl carbon has the same configuration as the chiral carbon in D-glyceraldehyde. The sugars named in boxes are the most common in nature; you will encounter these again in this and later chapters.
 Aldoses and ketoses. The series of (a) D-aldoses and (b) D-ketoses having from three to six carbon atoms, shown as projection formulas. The carbon atoms in red are chiral centers. In all these D isomers, the chiral carbon most distant from the carbonyl carbon has the same configuration as the chiral carbon in D-glyceraldehyde. The sugars named in boxes are the most common in nature; you will encounter these again in this and later chapters.")
15
monosaccharide's FIGURE 7-4 Epimers. D-Glucose and two of its epimers are shown as projection formulas. Each epimer differs from D-glucose in the configuration at one chiral center (shaded pink).
.")
16
monosaccharide's L-Isomer

17
Formation of hemiacetals and hemiketals
FIGURE 7-5 Formation of hemiacetals and hemiketals. An aldehyde or ketone can react with an alcohol in a 1:1 ratio to yield a hemiacetal or hemiketal, respectively, creating a new chiral center at the carbonyl carbon. Substitution of a second alcohol molecule produces an acetal or ketal. When the second alcohol is part of another sugar molecule, the bond produced is a glycosidic bond (p. 243).
.")
18
Formation of the two cyclic forms of D-glucose
FIGURE 7-6 Formation of the two cyclic forms of D-glucose. Reaction between the aldehyde group at C-1 and the hydroxyl group at C-5 forms a hemiacetal linkage, producing either of two stereoisomers, the α and β anomers, which differ only in the stereochemistry around the hemiacetal carbon. The interconversion of α and β anomers is called mutarotation.

19
Pyranoses and furanoses.
FIGURE 7-7 Pyranoses and furanoses. The pyranose forms of D-glucose and the furanose forms of D-fructose are shown here as Haworth perspective formulas. The edges of the ring nearest the reader are represented by bold lines. Hydroxyl groups below the plane of the ring in these Haworth perspectives would appear at the right side of a Fischer projection (compare with Figure 7-6). Pyran and furan are shown for comparison.
. Pyran and furan are shown for comparison.")
20
Conformational formulas of pyranoses
FIGURE 7-8 Conformational formulas of pyranoses. (a) Two chair forms of the pyranose ring. Bonds to substituents and hydrogen atoms on the ring carbons may be either axial (ax), projecting parallel to the vertical axis through the ring, or equatorial (eq), projecting roughly perpendicular to this axis. Two conformers such are these are not readily interconvertible without breaking the ring. However, when the molecule is "stretched" (by atomic force microscopy; see Box 11-1), an input of about 46 kJ of energy per mole of sugar can force the interconversion of chair forms. Generally, substituents in the equatorial positions are less sterically hindered by neighboring substituents, and conformers with bulky substituents in equatorial positions are favored. Another conformation, the "boat" (not shown), is seen only in derivatives with very bulky substituents. (b) The preferred chair conformation of α-D-glucopyranose.
 Two chair forms of the pyranose ring. Bonds to substituents and hydrogen atoms on the ring carbons may be either axial (ax), projecting parallel to the vertical axis through the ring, or equatorial (eq), projecting roughly perpendicular to this axis. Two conformers such are these are not readily interconvertible without breaking the ring. However, when the molecule is stretched (by atomic force microscopy; see Box 11-1), an input of about 46 kJ of energy per mole of sugar can force the interconversion of chair forms. Generally, substituents in the equatorial positions are less sterically hindered by neighboring substituents, and conformers with bulky substituents in equatorial positions are favored. Another conformation, the boat (not shown), is seen only in derivatives with very bulky substituents. (b) The preferred chair conformation of α-D-glucopyranose.")
21
Some hexose derivatives important in biology
FIGURE 7-9 Some hexose derivatives important in biology. In amino sugars, an —NH2 group replaces one of the —OH groups in the parent hexose. Substitution of —H for —OH produces a deoxy sugar; note that the deoxy sugars shown here occur in nature as the L isomers. The acidic sugars contain a carboxylate group, which confers a negative charge at neutral pH. D-Glucono-δ-lactone results from formation of an ester linkage between the C-1 carboxylate group and the C-5 (also known as the δ carbon) hydroxyl group of D-gluconate.
 hydroxyl group of D-gluconate.")
22
Sugars as reducing agents
FIGURE 7-10 Sugars as reducing agents. Oxidation of the anomeric carbon (and probably the neighboring carbon) of glucose and other sugars under alkaline conditions is the basis for Fehling's reaction. The cuprous ion (Cu+) produced forms a red cuprous oxide precipitate. In the hemiacetal (ring) form, C-1 of glucose cannot be oxidized by complexed Cu2+. However, the open-chain form is in equilibrium with the ring form, and eventually the oxidation reaction goes to completion. The reaction with Cu2+ is complex, yielding a mixture of products and reducing 3 mol of Cu2+ per mole of glucose.
 of glucose and other sugars under alkaline conditions is the basis for Fehling s reaction. The cuprous ion (Cu+) produced forms a red cuprous oxide precipitate. In the hemiacetal (ring) form, C-1 of glucose cannot be oxidized by complexed Cu2+. However, the open-chain form is in equilibrium with the ring form, and eventually the oxidation reaction goes to completion. The reaction with Cu2+ is complex, yielding a mixture of products and reducing 3 mol of Cu2+ per mole of glucose.")
23
Glucose oxidase reaction
BOX 7-1 FIGURE 1 The glucose oxidase reaction, used in the measurement of blood glucose. A second enzyme, a peroxidase, catalyzes the reaction of the H2O2 with a colorless compound to produce a colored product, which is measured spectrophotometrically.

24
Formation of maltose FIGURE 7-11 Formation of maltose. A disaccharide is formed from two monosaccharides (here, two molecules of D-glucose) when an —OH (alcohol) of one glucose molecule (right) condenses with the intramolecular hemiacetal of the other glucose molecule (left), with elimination of H2O and formation of a glycosidic bond. The reversal of this reaction is hydrolysis—attack by H2O on the glycosidic bond. The maltose molecule, shown here as an illustration, retains a reducing hemiacetal at the C-1 not involved in the glycosidic bond. Because mutarotation interconverts the α and β forms of the hemiacetal, the bonds at this position are sometimes depicted with wavy lines, as shown here, to indicate that the structure may be either α or β.
 when an —OH (alcohol) of one glucose molecule (right) condenses with the intramolecular hemiacetal of the other glucose molecule (left), with elimination of H2O and formation of a glycosidic bond. The reversal of this reaction is hydrolysis—attack by H2O on the glycosidic bond. The maltose molecule, shown here as an illustration, retains a reducing hemiacetal at the C-1 not involved in the glycosidic bond. Because mutarotation interconverts the α and β forms of the hemiacetal, the bonds at this position are sometimes depicted with wavy lines, as shown here, to indicate that the structure may be either α or β.")
25
Table 7-1 to come Table 7-1

26
Some common disaccharides.
FIGURE 7-12 Some common disaccharides. Like maltose in Figure 7-11, these are shown as Haworth perspectives. The common name, full systematic name, and abbreviation are given for each disaccharide. Formal nomenclature for sucrose names glucose as the parent glycoside, although it is typically depicted as shown, with glucose on the left.

27
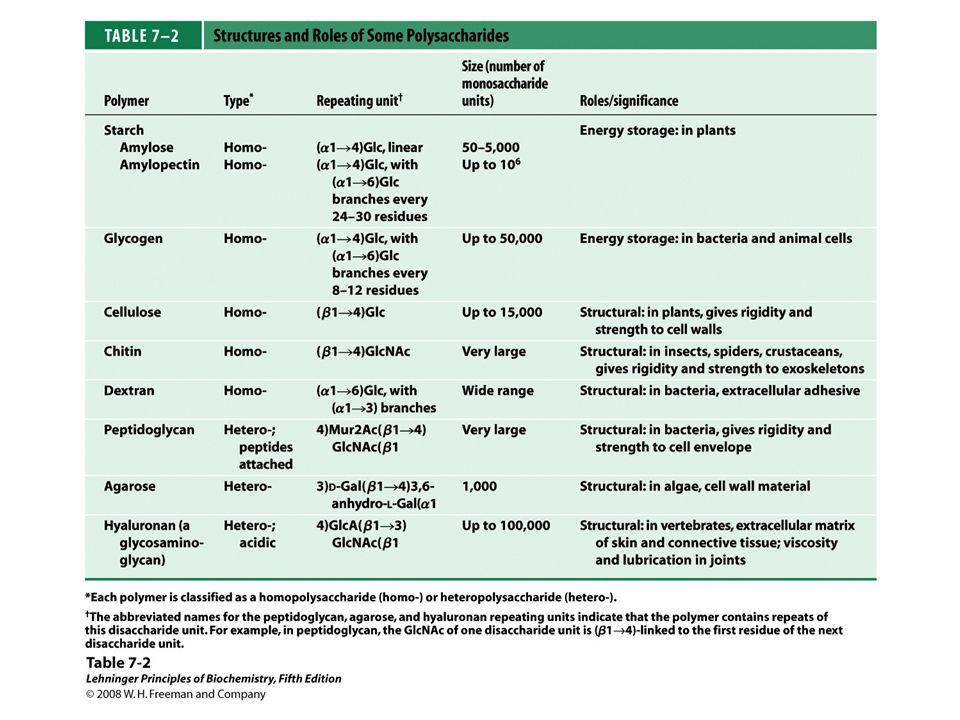
polysaccharides FIGURE 7-13 Homo- and heteropolysaccharides. Polysaccharides may be composed of one, two, or several different monosaccharides, in straight or branched chains of varying length.

28
Glycogen and starch FIGURE 7-14a Glycogen and starch. (a) A short segment of amylose, a linear polymer of D-glucose residues in (α1→4) linkage. A single chain can contain several thousand glucose residues. Amylopectin has stretches of similarly linked residues between branch points. Glycogen has the same basic structure, but has more branching than amylopectin.
 A short segment of amylose, a linear polymer of D-glucose residues in (α1→4) linkage. A single chain can contain several thousand glucose residues. Amylopectin has stretches of similarly linked residues between branch points. Glycogen has the same basic structure, but has more branching than amylopectin.")
29
An (α1→6) branch point of glycogen or amylopectin.
FIGURE 7-14b Glycogen and starch. (b) An (α1→6) branch point of glycogen or amylopectin.
 An (α1→6) branch point of glycogen or amylopectin.")
30
FIGURE 7-14c Glycogen and starch
FIGURE 7-14c Glycogen and starch. (c) A cluster of amylose and amylopectin like that believed to occur in starch granules. Strands of amylopectin (red) form double-helical structures with each other or with amylose strands (blue). Glucose residues at the nonreducing ends of the outer branches are removed enzymatically during the mobilization of starch for energy production. Glycogen has a similar structure but is more highly branched and more compact.
 A cluster of amylose and amylopectin like that believed to occur in starch granules. Strands of amylopectin (red) form double-helical structures with each other or with amylose strands (blue). Glucose residues at the nonreducing ends of the outer branches are removed enzymatically during the mobilization of starch for energy production. Glycogen has a similar structure but is more highly branched and more compact.")
31
Structural Homopolysaccharides Cellulose
FIGURE 7-15a Cellulose. (a) Two units of a cellulose chain; the D-glucose residues are in (β1→4) linkage. The rigid chair structures can rotate relative to one another.
 Two units of a cellulose chain; the D-glucose residues are in (β1→4) linkage. The rigid chair structures can rotate relative to one another.")
32
Cellulose FIGURE 7-15b Cellulose. (b) Scale drawing of segments of two parallel cellulose chains, showing the conformation of the D-glucose residues and the hydrogen-bond cross-links. In the hexose unit at the lower left, all hydrogen atoms are shown; in the other three hexose units, the hydrogens attached to carbon have been omitted for clarity, as they do not participate in hydrogen bonding.
 Scale drawing of segments of two parallel cellulose chains, showing the conformation of the D-glucose residues and the hydrogen-bond cross-links. In the hexose unit at the lower left, all hydrogen atoms are shown; in the other three hexose units, the hydrogens attached to carbon have been omitted for clarity, as they do not participate in hydrogen bonding.")
33
FIGURE 7-16 Cellulose breakdown by wood fungi
FIGURE 7-16 Cellulose breakdown by wood fungi. A wood fungus growing on an oak log. All wood fungi have the enzyme cellulase, which breaks the (β1→4) glycosidic bonds in cellulose, so that wood is a source of metabolizable sugar (glucose) for the fungus. The only vertebrates able to use cellulose as food are cattle and other ruminants (sheep, goats, camels, giraffes). The extra stomach compartment (rumen) of a ruminant teems with bacteria and protists that secrete cellulase.
 glycosidic bonds in cellulose, so that wood is a source of metabolizable sugar (glucose) for the fungus. The only vertebrates able to use cellulose as food are cattle and other ruminants (sheep, goats, camels, giraffes). The extra stomach compartment (rumen) of a ruminant teems with bacteria and protists that secrete cellulase.")
34
Chitin FIGURE 7-17a Chitin. (a) A short segment of chitin, a homopolymer of N-acetyl-D-glucosamine units in (β1→4) linkage.
 A short segment of chitin, a homopolymer of N-acetyl-D-glucosamine units in (β1→4) linkage.")
35
FIGURE 7-17 Chitin. (b) A spotted June beetle (Pelidnota punctata), showing its surface armor (exoskeleton) of chitin.
 A spotted June beetle (Pelidnota punctata), showing its surface armor (exoskeleton) of chitin..")
36
Conformation at the glycosidic bonds
FIGURE 7-18 Conformation at the glycosidic bonds of cellulose, amylose, and dextran. The polymers are depicted as rigid pyranose rings joined by glycosidic bonds, with free rotation about these bonds. Note that in dextran there is also free rotation about the bond between C-5 and C-6 (torsion angle ω (omega)).
).")
37
Helical structures Starch (amylose).
FIGURE 7-20a Starch (amylose). (a) In the most stable conformation, with adjacent rigid chairs, the polysaccharide chain is curved, rather than linear as in cellulose (see Figure 7-15). Starch (amylose).
. (a) In the most stable conformation, with adjacent rigid chairs, the polysaccharide chain is curved, rather than linear as in cellulose (see Figure 7-15). Starch (amylose).")
38
Amylose Helical structures
FIGURE 7-20b Starch (amylose). (b) A model of a segment of; for clarity, the hydroxyl groups have been omitted from all but one of the glucose amyloseresidues. Compare the two residues shaded in pink with the chemical structures in (a). The conformation of (α1→4) linkages in amylose, amylopectin, and glycogen causes these polymers to assume tightly coiled helical structures. These compact structures produce the dense granules of stored starch or glycogen seen in many cells (see Figure 20-2).
. (b) A model of a segment of; for clarity, the hydroxyl groups have been omitted from all but one of the glucose amyloseresidues. Compare the two residues shaded in pink with the chemical structures in (a). The conformation of (α1→4) linkages in amylose, amylopectin, and glycogen causes these polymers to assume tightly coiled helical structures. These compact structures produce the dense granules of stored starch or glycogen seen in many cells (see Figure 20-2).")
39
Agarose FIGURE 7-21 Agarose. The repeating unit consists of D-galactose (β1→4)-linked to 3,6-anhydro-L-galactose (in which an ether bridge connects C-3 and C-6). These units are joined by (α1→3) glycosidic links to form a polymer 600 to 700 residues long. A small fraction of the 3,6-anhydrogalactose residues have a sulfate ester at C-2 (as shown here).
-linked to 3,6-anhydro-L-galactose (in which an ether bridge connects C-3 and C-6). These units are joined by (α1→3) glycosidic links to form a polymer 600 to 700 residues long. A small fraction of the 3,6-anhydrogalactose residues have a sulfate ester at C-2 (as shown here).")
40
FIGURE 7-22 (part 1) Repeating units of some common glycosaminoglycans of extracellular matrix. The molecules are copolymers of alternating uronic acid and amino sugar residues (keratan sulfate is the exception), with sulfate esters in any of several positions, except in hyaluronan. The ionized carboxylate and sulfate groups (red in the perspective formulas) give these polymers their characteristic high negative charge. Therapeutic heparin contains primarily iduronic acid (IdoA) and a smaller proportion of glucuronic acid (GlcA, not shown), and is generally highly sulfated and heterogeneous in length. The space-filling model shows a heparin segment as its solution structure, as determined by NMR spectroscopy (PDB ID 1HPN). The carbons in the iduronic acid sulfate are colored blue; those in glucosamine sulfate are green. Oxygen and sulfur atoms are shown in their standard colors of red and yellow, respectively. The hydrogen atoms are not shown (for clarity). Heparan sulfate (not shown) is similar to heparin but has a higher proportion of GlcA and fewer sulfate groups, arranged in a less regular pattern.
, with sulfate esters in any of several positions, except in hyaluronan. The ionized carboxylate and sulfate groups (red in the perspective formulas) give these polymers their characteristic high negative charge. Therapeutic heparin contains primarily iduronic acid (IdoA) and a smaller proportion of glucuronic acid (GlcA, not shown), and is generally highly sulfated and heterogeneous in length. The space-filling model shows a heparin segment as its solution structure, as determined by NMR spectroscopy (PDB ID 1HPN). The carbons in the iduronic acid sulfate are colored blue; those in glucosamine sulfate are green. Oxygen and sulfur atoms are shown in their standard colors of red and yellow, respectively. The hydrogen atoms are not shown (for clarity). Heparan sulfate (not shown) is similar to heparin but has a higher proportion of GlcA and fewer sulfate groups, arranged in a less regular pattern..")
41
Repeating units of some common glycosaminoglycans of extracellular matrix.
FIGURE 7-22 (part 1a) Repeating units of some common glycosaminoglycans of extracellular matrix. The molecules are copolymers of alternating uronic acid and amino sugar residues (keratan sulfate is the exception), with sulfate esters in any of several positions, except in hyaluronan. The ionized carboxylate and sulfate groups (red in the perspective formulas) give these polymers their characteristic high negative charge. Therapeutic heparin contains primarily iduronic acid (IdoA) and a smaller proportion of glucuronic acid (GlcA, not shown), and is generally highly sulfated and heterogeneous in length. The space-filling model shows a heparin segment as its solution structure, as determined by NMR spectroscopy (PDB ID 1HPN). The carbons in the iduronic acid sulfate are colored blue; those in glucosamine sulfate are green. Oxygen and sulfur atoms are shown in their standard colors of red and yellow, respectively. The hydrogen atoms are not shown (for clarity). Heparan sulfate (not shown) is similar to heparin but has a higher proportion of GlcA and fewer sulfate groups, arranged in a less regular pattern.
 Repeating units of some common glycosaminoglycans of extracellular matrix. The molecules are copolymers of alternating uronic acid and amino sugar residues (keratan sulfate is the exception), with sulfate esters in any of several positions, except in hyaluronan. The ionized carboxylate and sulfate groups (red in the perspective formulas) give these polymers their characteristic high negative charge. Therapeutic heparin contains primarily iduronic acid (IdoA) and a smaller proportion of glucuronic acid (GlcA, not shown), and is generally highly sulfated and heterogeneous in length. The space-filling model shows a heparin segment as its solution structure, as determined by NMR spectroscopy (PDB ID 1HPN). The carbons in the iduronic acid sulfate are colored blue; those in glucosamine sulfate are green. Oxygen and sulfur atoms are shown in their standard colors of red and yellow, respectively. The hydrogen atoms are not shown (for clarity). Heparan sulfate (not shown) is similar to heparin but has a higher proportion of GlcA and fewer sulfate groups, arranged in a less regular pattern.")
42
Repeating units of some common glycosaminoglycans of extracellular matrix.
FIGURE 7-22 (part 1b) Repeating units of some common glycosaminoglycans of extracellular matrix. The molecules are copolymers of alternating uronic acid and amino sugar residues (keratan sulfate is the exception), with sulfate esters in any of several positions, except in hyaluronan. The ionized carboxylate and sulfate groups (red in the perspective formulas) give these polymers their characteristic high negative charge. Therapeutic heparin contains primarily iduronic acid (IdoA) and a smaller proportion of glucuronic acid (GlcA, not shown), and is generally highly sulfated and heterogeneous in length. The space-filling model shows a heparin segment as its solution structure, as determined by NMR spectroscopy (PDB ID 1HPN). The carbons in the iduronic acid sulfate are colored blue; those in glucosamine sulfate are green. Oxygen and sulfur atoms are shown in their standard colors of red and yellow, respectively. The hydrogen atoms are not shown (for clarity). Heparan sulfate (not shown) is similar to heparin but has a higher proportion of GlcA and fewer sulfate groups, arranged in a less regular pattern.
 Repeating units of some common glycosaminoglycans of extracellular matrix. The molecules are copolymers of alternating uronic acid and amino sugar residues (keratan sulfate is the exception), with sulfate esters in any of several positions, except in hyaluronan. The ionized carboxylate and sulfate groups (red in the perspective formulas) give these polymers their characteristic high negative charge. Therapeutic heparin contains primarily iduronic acid (IdoA) and a smaller proportion of glucuronic acid (GlcA, not shown), and is generally highly sulfated and heterogeneous in length. The space-filling model shows a heparin segment as its solution structure, as determined by NMR spectroscopy (PDB ID 1HPN). The carbons in the iduronic acid sulfate are colored blue; those in glucosamine sulfate are green. Oxygen and sulfur atoms are shown in their standard colors of red and yellow, respectively. The hydrogen atoms are not shown (for clarity). Heparan sulfate (not shown) is similar to heparin but has a higher proportion of GlcA and fewer sulfate groups, arranged in a less regular pattern.")
43
FIGURE 7-22 (part 2) Repeating units of some common glycosaminoglycans of extracellular matrix. The molecules are copolymers of alternating uronic acid and amino sugar residues (keratan sulfate is the exception), with sulfate esters in any of several positions, except in hyaluronan. The ionized carboxylate and sulfate groups (red in the perspective formulas) give these polymers their characteristic high negative charge. Therapeutic heparin contains primarily iduronic acid (IdoA) and a smaller proportion of glucuronic acid (GlcA, not shown), and is generally highly sulfated and heterogeneous in length. The space-filling model shows a heparin segment as its solution structure, as determined by NMR spectroscopy (PDB ID 1HPN). The carbons in the iduronic acid sulfate are colored blue; those in glucosamine sulfate are green. Oxygen and sulfur atoms are shown in their standard colors of red and yellow, respectively. The hydrogen atoms are not shown (for clarity). Heparan sulfate (not shown) is similar to heparin but has a higher proportion of GlcA and fewer sulfate groups, arranged in a less regular pattern.
, with sulfate esters in any of several positions, except in hyaluronan. The ionized carboxylate and sulfate groups (red in the perspective formulas) give these polymers their characteristic high negative charge. Therapeutic heparin contains primarily iduronic acid (IdoA) and a smaller proportion of glucuronic acid (GlcA, not shown), and is generally highly sulfated and heterogeneous in length. The space-filling model shows a heparin segment as its solution structure, as determined by NMR spectroscopy (PDB ID 1HPN). The carbons in the iduronic acid sulfate are colored blue; those in glucosamine sulfate are green. Oxygen and sulfur atoms are shown in their standard colors of red and yellow, respectively. The hydrogen atoms are not shown (for clarity). Heparan sulfate (not shown) is similar to heparin but has a higher proportion of GlcA and fewer sulfate groups, arranged in a less regular pattern..")
45
FIGURE 7-23 Interaction between a glycosaminoglycan and its binding protein. Fibroblast growth factor 1 (FGF1), its cell surface receptor (FGFR), and a short segment of a glycosaminoglycan (heparin) were co-crystallized to yield the structure shown here (PDB ID 1E0O). The proteins are represented as surface contour images, with color to represent surface electrostatic potential: red, predominantly negative charge; blue, predominantly positive charge. Heparin is shown in a ball-and-stick representation, with the negative charges (—SO3– and —COO–) attracted to the positive (blue) surface of the FGF1 protein. Heparin was used in this experiment, but the glycosaminoglycan that binds FGF1 in vivo is heparan sulfate on the cell surface.
, its cell surface receptor (FGFR), and a short segment of a glycosaminoglycan (heparin) were co-crystallized to yield the structure shown here (PDB ID 1E0O). The proteins are represented as surface contour images, with color to represent surface electrostatic potential: red, predominantly negative charge; blue, predominantly positive charge. Heparin is shown in a ball-and-stick representation, with the negative charges (—SO3– and —COO–) attracted to the positive (blue) surface of the FGF1 protein. Heparin was used in this experiment, but the glycosaminoglycan that binds FGF1 in vivo is heparan sulfate on the cell surface..")
47
FIGURE 7-24 Proteoglycan structure, showing the tetrasaccharide bridge
FIGURE 7-24 Proteoglycan structure, showing the tetrasaccharide bridge. A typical tetrasaccharide linker (blue) connects a glycosaminoglycan—in this case chondroitin 4-sulfate (orange)–to a Ser residue (pink) in the core protein. The xylose residue at the reducing end of the linker is joined by its anomeric carbon to the hydroxyl of the Ser residue.
 connects a glycosaminoglycan—in this case chondroitin 4-sulfate (orange)–to a Ser residue (pink) in the core protein. The xylose residue at the reducing end of the linker is joined by its anomeric carbon to the hydroxyl of the Ser residue.")
48
FIGURE 7-25a Two families of membrane proteoglycans
FIGURE 7-25a Two families of membrane proteoglycans. (a) Schematic diagrams of a syndecan and a glypican in the plasma membrane. Syndecans are held in the membrane by hydrophobic interactions between a sequence of nonpolar amino acid residues and plasma membrane lipids; they can be released by a single proteolytic cut near the membrane surface. In a typical syndecan, the extracellular aminoterminal domain is covalently attached (by tetrasaccharide linkers such as those in Figure 7-24) to three heparan sulfate chains and two chondroitin sulfate chains. Glypicans are held in the membrane by a covalently attached membrane lipid (GPI anchor; see Chapter 11), and are shed if the lipid-protein bond is cleaved by a phospholipase. All glypicans have 14 conserved Cys residues, which form disulfide bonds to stabilize the protein moiety, and either two or three glycosaminoglycan chains attached near the carboxyl terminus, close to the membrane surface.
 Schematic diagrams of a syndecan and a glypican in the plasma membrane. Syndecans are held in the membrane by hydrophobic interactions between a sequence of nonpolar amino acid residues and plasma membrane lipids; they can be released by a single proteolytic cut near the membrane surface. In a typical syndecan, the extracellular aminoterminal domain is covalently attached (by tetrasaccharide linkers such as those in Figure 7-24) to three heparan sulfate chains and two chondroitin sulfate chains. Glypicans are held in the membrane by a covalently attached membrane lipid (GPI anchor; see Chapter 11), and are shed if the lipid-protein bond is cleaved by a phospholipase. All glypicans have 14 conserved Cys residues, which form disulfide bonds to stabilize the protein moiety, and either two or three glycosaminoglycan chains attached near the carboxyl terminus, close to the membrane surface.")
49
FIGURE 7-25b Two families of membrane proteoglycans
FIGURE 7-25b Two families of membrane proteoglycans. (b) Along a heparan sulfate chain, regions rich in sulfated sugars, the NS domains (green), alternate with regions with chiefly unmodified residues of GlcNAc and GlcA, the NA domains (gray). One of the NS domains is shown in more detail, revealing a high density of modified residues: GlcNS (N-sulfoglucosamine), with a sulfate ester at C-6; and both GlcA and IdoA, with a sulfate ester at C-2. The exact pattern of sulfation in the NS domain differs among proteoglycans.
 Along a heparan sulfate chain, regions rich in sulfated sugars, the NS domains (green), alternate with regions with chiefly unmodified residues of GlcNAc and GlcA, the NA domains (gray). One of the NS domains is shown in more detail, revealing a high density of modified residues: GlcNS (N-sulfoglucosamine), with a sulfate ester at C-6; and both GlcA and IdoA, with a sulfate ester at C-2. The exact pattern of sulfation in the NS domain differs among proteoglycans.")
50
FIGURE 7-26 Four types of protein interactions with NS domains of heparan sulfate.

51
FIGURE 7-26a Four types of protein interactions with NS domains of heparan sulfate.

52
FIGURE 7-26b Four types of protein interactions with NS domains of heparan sulfate.

53
FIGURE 7-26c Four types of protein interactions with NS domains of heparan sulfate.

54
FIGURE 7-26d Four types of protein interactions with NS domains of heparan sulfate.

55
FIGURE 7-27 Proteoglycan aggregate of the extracellular matrix
FIGURE 7-27 Proteoglycan aggregate of the extracellular matrix. Schematic drawing of a proteoglycan with many aggrecan molecules. One very long molecule of hyaluronan is associated noncovalently with about 100 molecules of the core protein aggrecan. Each aggrecan molecule contains many covalently bound chondroitin sulfate and keratan sulfate chains. Link proteins at the junction between each core protein and the hyaluronan backbone mediate the core protein–hyaluronan interaction. The micrograph shows a single molecule of aggrecan, viewed with the atomic force microscope (see Box 11-1).
.")
56
FIGURE 7-28 Interactions between cells and the extracellular matrix
FIGURE 7-28 Interactions between cells and the extracellular matrix. The association between cells and the proteoglycan of the extracellular matrix is mediated by a membrane protein (integrin) and by an extracellular protein (fibronectin in this example) with binding sites for both integrin and the proteoglycan. Note the close association of collagen fibers with the fibronectin and proteoglycan.
 and by an extracellular protein (fibronectin in this example) with binding sites for both integrin and the proteoglycan. Note the close association of collagen fibers with the fibronectin and proteoglycan.")
57
FIGURE 7-29 Oligosaccharide linkages in glycoproteins
FIGURE 7-29 Oligosaccharide linkages in glycoproteins. (a) O-linked oligosaccharides have a glycosidic bond to the hydroxyl group of Ser or Thr residues (pink), illustrated here with GalNAc as the sugar at the reducing end of the oligosaccharide. One simple chain and one complex chain are shown. (b) N-linked oligosaccharides have an N-glycosyl bond to the amide nitrogen of an Asn residue (green), illustrated here with GlcNAc as the terminal sugar. Three common types of oligosaccharide chains that are N-linked in glycoproteins are shown. A complete description of oligosaccharide structure requires specification of the position and stereochemistry (α or β) of each glycosidic linkage.
 O-linked oligosaccharides have a glycosidic bond to the hydroxyl group of Ser or Thr residues (pink), illustrated here with GalNAc as the sugar at the reducing end of the oligosaccharide. One simple chain and one complex chain are shown. (b) N-linked oligosaccharides have an N-glycosyl bond to the amide nitrogen of an Asn residue (green), illustrated here with GlcNAc as the terminal sugar. Three common types of oligosaccharide chains that are N-linked in glycoproteins are shown. A complete description of oligosaccharide structure requires specification of the position and stereochemistry (α or β) of each glycosidic linkage.")
58
FIGURE 7-30 Bacterial lipopolysaccharides
FIGURE 7-30 Bacterial lipopolysaccharides. Schematic diagram of the lipopolysaccharide of the outer membrane of Salmonella typhimurium. Kdo is 3-deoxy-D-manno-octulosonic acid (previously called ketodeoxyoctonic acid); Hep is L-glycero-D-manno-heptose; AbeOAc is abequose (a 3,6-dideoxyhexose) acetylated on one of its hydroxyls. There are six fatty acid residues in the lipid A portion of the molecule. Different bacterial species have subtly different lipopolysaccharide structures, but they have in common a lipid region (lipid A), a core oligosaccharide also known as endotoxin, and an "O-specific" chain, which is the principal determinant of the serotype (immunological reactivity) of the bacterium. The outer membranes of the gram-negative bacteria S. typhimurium and E. coli contain so many lipopolysaccharide molecules that the cell surface is virtually covered with O-specific chains.
; Hep is L-glycero-D-manno-heptose; AbeOAc is abequose (a 3,6-dideoxyhexose) acetylated on one of its hydroxyls. There are six fatty acid residues in the lipid A portion of the molecule. Different bacterial species have subtly different lipopolysaccharide structures, but they have in common a lipid region (lipid A), a core oligosaccharide also known as endotoxin, and an O-specific chain, which is the principal determinant of the serotype (immunological reactivity) of the bacterium. The outer membranes of the gram-negative bacteria S. typhimurium and E. coli contain so many lipopolysaccharide molecules that the cell surface is virtually covered with O-specific chains.")
61
FIGURE 7-31 Role of lectin-ligand interactions in lymphocyte movement to the site of an infection or injury. A neutrophil circulating through a capillary is slowed by transient interactions between P-selectin molecules in the plasma membrane of the capillary endothelial cells and glycoprotein ligands for P-selectin on the neutrophil surface. As it interacts with successive P-selectin molecules, the neutrophil rolls along the capillary surface. Near a site of inflammation, stronger interactions between integrin in the capillary surface and its ligand in the neutrophil surface lead to tight adhesion. The neutrophil stops rolling and, under the influence of signals sent out from the site of inflammation, begins extravasation—escape through the capillary wall—as it moves toward the site of inflammation.

63
FIGURE 7-32 An ulcer in the making
FIGURE 7-32 An ulcer in the making. Helicobacter pylori cells adhering to the gastric surface. This bacterium causes ulcers by interactions between a bacterial surface lectin and the Leb oligosaccharide (a blood group antigen) of the gastric epithelium.
 of the gastric epithelium.")
65
FIGURE 7-33 Details of a lectin-carbohydrate interaction
FIGURE 7-33 Details of a lectin-carbohydrate interaction. Structure of the bovine mannose 6-phosphate receptor complexed with mannose 6-phosphate (PDB ID 1M6P). The protein is represented as a surface contour image, showing the surface as predominantly negatively charged (red) or positively charged (blue). Mannose 6-phosphate is shown as a stick structure; a manganese ion is shown in violet. (b) An enlarged view of the binding site. Mannose 6-phosphate is hydrogen-bonded to Arg111 and coordinated with the manganese ion (shown smaller than its van der Waals radius for clarity). Each hydroxyl group of mannose is hydrogen-bonded to the protein. The His105 hydrogen-bonded to a phosphate oxygen of mannose 6-phosphate may be the residue that, when protonated at low pH, causes the receptor to release mannose 6-phosphate into the lysosome.
. The protein is represented as a surface contour image, showing the surface as predominantly negatively charged (red) or positively charged (blue). Mannose 6-phosphate is shown as a stick structure; a manganese ion is shown in violet. (b) An enlarged view of the binding site. Mannose 6-phosphate is hydrogen-bonded to Arg111 and coordinated with the manganese ion (shown smaller than its van der Waals radius for clarity). Each hydroxyl group of mannose is hydrogen-bonded to the protein. The His105 hydrogen-bonded to a phosphate oxygen of mannose 6-phosphate may be the residue that, when protonated at low pH, causes the receptor to release mannose 6-phosphate into the lysosome.")
66
FIGURE 7-34 Hydrophobic interactions of sugar residues
FIGURE 7-34 Hydrophobic interactions of sugar residues. Sugar units such as galactose have a more polar side (the top of the chair as shown here, with the ring oxygen and several hydroxyls) that is available to hydrogen-bond with the lectin, and a less polar side that can have hydrophobic interactions with nonpolar side chains in the protein, such as the indole ring of Trp residues.
 that is available to hydrogen-bond with the lectin, and a less polar side that can have hydrophobic interactions with nonpolar side chains in the protein, such as the indole ring of Trp residues.")
67
FIGURE 7-35 Roles of oligosaccharides in recognition and adhesion at the cell surface. (a) Oligosaccharides with unique structures (represented as strings of hexagons), components of a variety of glycoproteins or glycolipids on the outer surface of plasma membranes, interact with high specificity and affinity with lectins in the extracellular milieu. (b) Viruses that infect animal cells, such as the influenza virus, bind to cell surface glycoproteins as the first step in infection. (c) Bacterial toxins, such as the cholera and pertussis toxins, bind to a surface glycolipid before entering a cell. (d) Some bacteria, such as H. pylori, adhere to and then colonize or infect animal cells. (e) Selectins (lectins) in the plasma membrane of certain cells mediate cell-cell interactions, such as those of neutrophils with the endothelial cells of the capillary wall at an infection site. (f) The mannose 6-phosphate receptor/lectin of the trans Golgi complex binds to the oligosaccharide of lysosomal enzymes, targeting them for transfer into the lysosome.
 Oligosaccharides with unique structures (represented as strings of hexagons), components of a variety of glycoproteins or glycolipids on the outer surface of plasma membranes, interact with high specificity and affinity with lectins in the extracellular milieu. (b) Viruses that infect animal cells, such as the influenza virus, bind to cell surface glycoproteins as the first step in infection. (c) Bacterial toxins, such as the cholera and pertussis toxins, bind to a surface glycolipid before entering a cell. (d) Some bacteria, such as H. pylori, adhere to and then colonize or infect animal cells. (e) Selectins (lectins) in the plasma membrane of certain cells mediate cell-cell interactions, such as those of neutrophils with the endothelial cells of the capillary wall at an infection site. (f) The mannose 6-phosphate receptor/lectin of the trans Golgi complex binds to the oligosaccharide of lysosomal enzymes, targeting them for transfer into the lysosome..")
68
FIGURE 7-36 Methods of carbohydrate analysis
FIGURE 7-36 Methods of carbohydrate analysis. A carbohydrate purified in the first stage of the analysis often requires all four analytical routes for its complete characterization.

Similar presentations


 have empirical formulas of (CH 2 O) n, where n ≥ 3 Monosaccharides.>")


 Carbohydrates.>")


, D and L isomers of Glyceraldehyde.>")


 is the study of the chemical processes in living organisms.>")
