Download presentation
Presentation is loading. Please wait.

1
International Comparative Analysis of Firm-level Data Eric Bartelsman Vrije Universiteit Amsterdam Tinbergen Institute CBS January 23, 2007 This work was partially funded through an 6th Framework Programme, EUKLEMS.

2
Eric Bartelsman, John Haltiwanger and Stefano Scarpetta 2005, 2006 Content of presentation based on: Measuring and Analyzing Cross-country Differences in Firm Dynamics Cross Country Differences in Productivity: The role of allocative efficiency

3
The challenge of cross-country analysis l Macro data –e.g. SNA, PWT –Difficult to identify effects (e.g. 2 million regressions) l Sectoral data –e.g. OECD-STAN; Unido; World KLEMS –aggregate sectors may obscure causal mechanism l Meta-analysis of results from micro studies –A challenge to control for data, method, and context –Little within-country variation in policy (e.g. before and after) l Multi-country longitudinal micro dataset –Generally not possible (disclosure) –EUROSTAT attempting to build EU panel
 l Sectoral data –e.g. OECD-STAN; Unido; World KLEMS –aggregate sectors may obscure causal mechanism l Meta-analysis of results from micro studies –A challenge to control for data, method, and context –Little within-country variation in policy (e.g. before and after) l Multi-country longitudinal micro dataset –Generally not possible (disclosure) –EUROSTAT attempting to build EU panel.")
4
SC LMD EUKLEMS Longitudinal Micro Data National Accounts Industry Data Single country Macro and Sectoral Timeseries Surveys, Business Registers Multiple countries N.A. Data for Cross-country Firm-level Analysis DMD EUKLEMS+

5
Distributed micro-data analysis: a network of experts l The firm-level project would have been impossible without extensive effort and support of many colleagues l The firm-level projects were funded by OECD, World Bank, various national government and NSOs

6
Data sources l Business registers for firm demographics –Firm level, at least one employee, 2/3-digit industry l Production Stats, enterprise surveys for productivity analysis l Countries: –10 OECD –5 Central and Eastern Europe –6 Latin America –3 East Asia l Data are disaggregated by: – industry (2-3 digit); –size classes 1-9; 10-19; 20-49; 50-99; 100-249; 250-499; 500+ (for OECD sample the groups between 1 and 20 and the groups between 100 and 500 are combined) –Time (late 1980s – early 2000s)
; –size classes 1-9; 10-19; 20-49; 50-99; ; ; 500+ (for OECD sample the groups between 1 and 20 and the groups between 100 and 500 are combined) –Time (late 1980s – early 2000s)")
7
Researcher Policy Question Research Design Program Code Publication Network Metadata Network members Cross-country Tables NSOs Distributed micro data research Provision of metadata. Approval of access. Disclosure analysis

8
Meta-data l Meta-data set up to describe –available datasets –unique record identifiers –classifications –‘economic variables’

9
Examples of meta-data l list of available datasources l info on record identifiers (bus. Units) l info on ‘economic variables’ l info on classifications l concordances between units l concordances between variables l concordances to standard classifications
 l info on ‘economic variables’ l info on classifications l concordances between units l concordances between variables l concordances to standard classifications.")
10
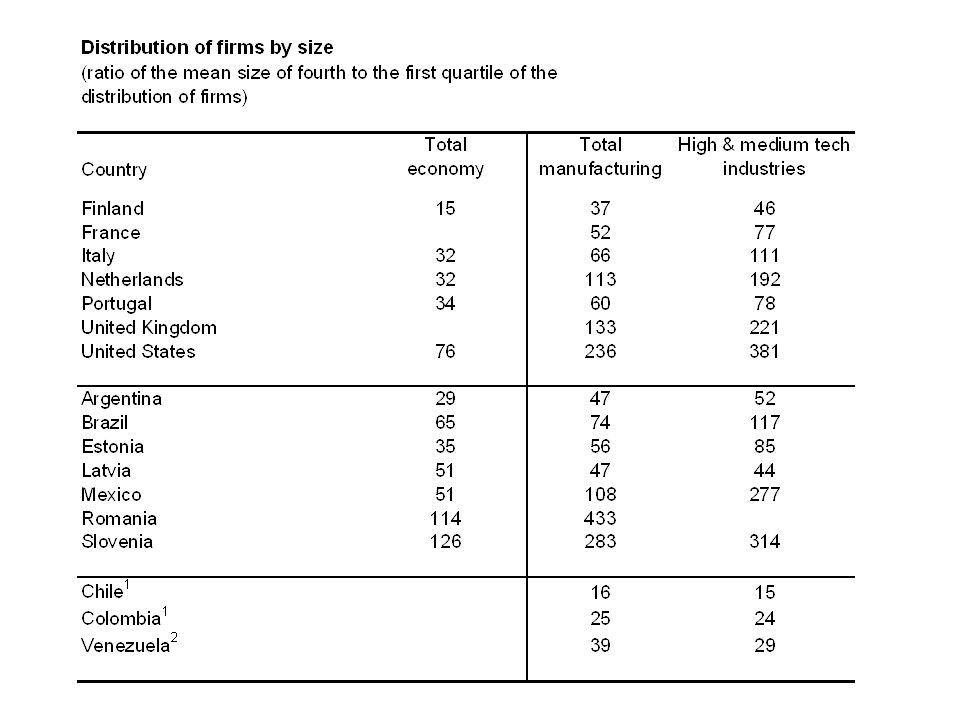
The different dimensions of producer dynamics 1.Firm size 2.Firm demographics: –Employment and # of firms for entry, exit, continuers: by industry and size class 3.Firm survival : –Employment and # of survivors, by cohort, industry, year 4.Static and dynamic analysis of allocative efficiency: –Decompositions of productivity (entry/exit/continuer) –Higher moments, covariances, means by quartile
 –Higher moments, covariances, means by quartile")
11
Measurement Error l Three sources of error potentially affect comparability of indicators built from firm level data: –Classical Error of firm-level measure –Errors in observed firms (sample) –Method of Aggregation of Indicator l Aggregation is harmonized in our approach, but other errors may or may not cancel out in aggregation
 –Method of Aggregation of Indicator l Aggregation is harmonized in our approach, but other errors may or may not cancel out in aggregation")
13
Interpretation of Gross Turnover l Theoretical explanations –Entry explained by ‘push’ and ‘pull’ factors –Exit barriers may effect characteristics of exiting firm more than number of exits l Measurement errors –Conceptual differences in measure (e.g. labor) –Differences in underlying data sources
 –Differences in underlying data sources.")
14
Evidence of firm turnover No major differences across OECD countries, especially after controlling for sector and size effects But large differences in size at entry Large net entry in transition economies: filling the gaps (?) Total business sector, firms with at least 1 employee Total business sector, firms with at least 20 employees
 Total business sector, firms with at least 1 employee Total business sector, firms with at least 20 employees")
15
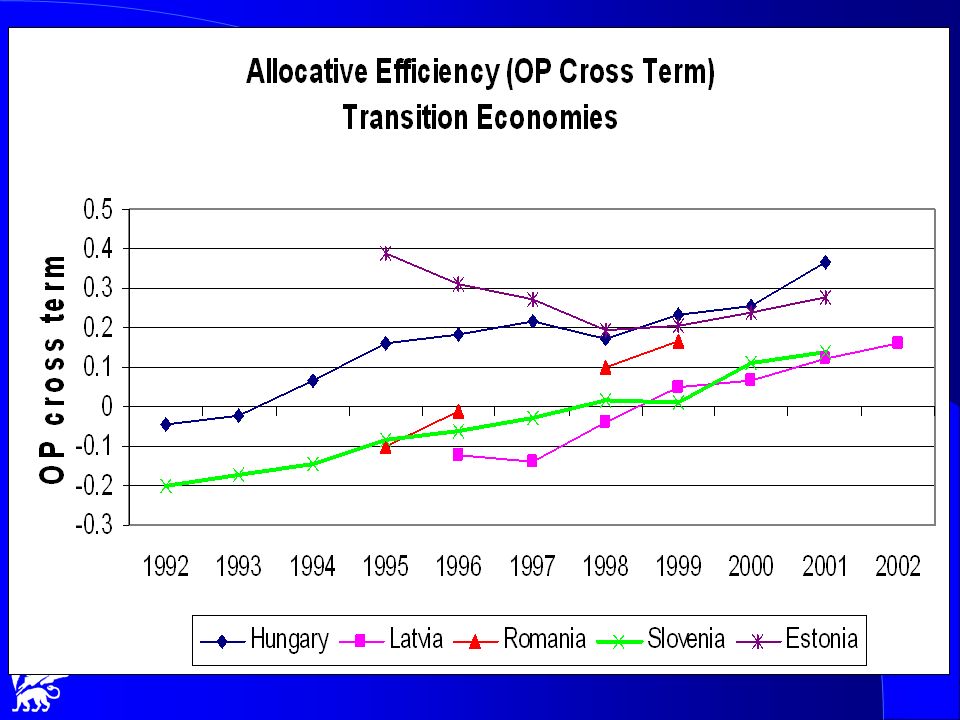
Gross and net firm turnover: how the time dimension sheds light on the evolution of market forces in transition economies

16
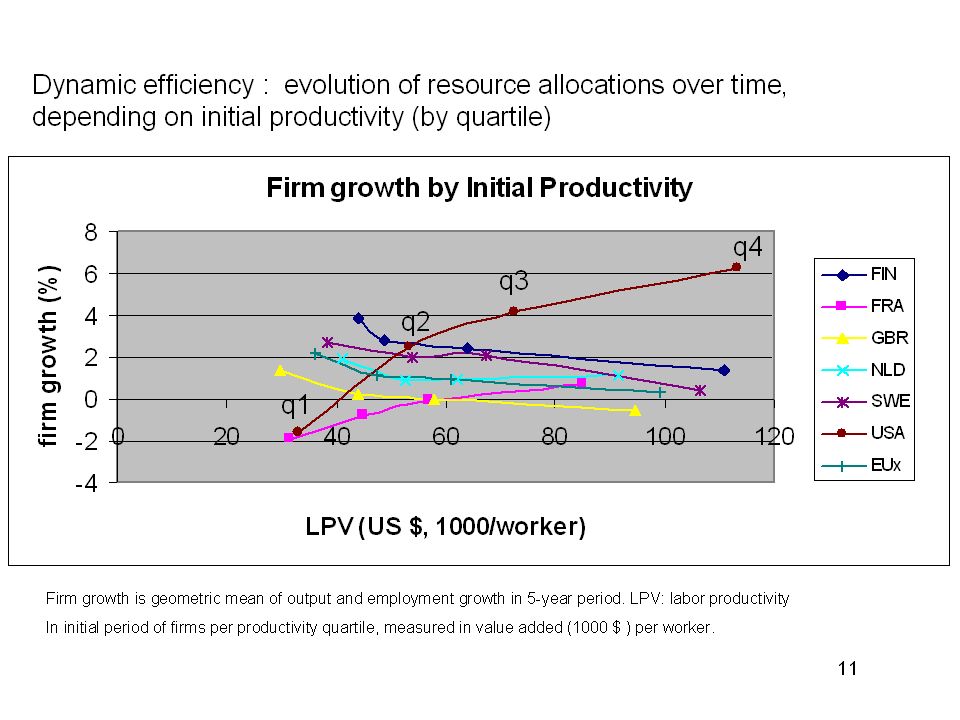
Entry rate by size: how the size dimension may shed light on the nature of firm dynamics Monotonic decline in entry rate by size in US Less clear link between size and entry rate in other EU countries; Any role for entry costs ?

17
Average firm-size, relative to entry manufacturing

19
Aggregate productivity and allocation l l Olley and Pakes (1996) static decomposition: where: N: # of firms in a sector; The first term is the unweighted average of firm-level productivity The second term (OP cross term) reflects allocation of resources: do firms with higher productivity have greater market share. Requires representative cross sectional samples but does not require accurate longitudinal linkages Cannot quantify directly importance of entry and exit By construction, cross term takes out country effects in productivity levels, so abstracts from some aspects of measurement error

22
Models for Explaining Pattern l l A Model of “Mis”-Allocation (Based on Rogerson and Restuccia (2003) (and similar to Hsieh and Klenow (2006)) –Firms decide to enter market, but are confronted with idiosyncratic ‘distortions’ l Taxes, infrastructure, regulations –Firms also learn their productivity –Depending on distortions and productivity, they decide to on size or whether to exit market
 (and similar to Hsieh and Klenow (2006)) –Firms decide to enter market, but are confronted with idiosyncratic ‘distortions’ l Taxes, infrastructure, regulations –Firms also learn their productivity –Depending on distortions and productivity, they decide to on size or whether to exit market")
23
Model Outcomes l Distortions affect various margins –Entry: amount and characteristics –Allocation among survivors –OP cross term reflects allocation for given survivors l Uncorrelated output distorion –Lowers mean Total Factor Productivity –Lowers associated OP cross term –Affects selection l Some low prod with high distortion produce, high prod firms with low distorion do not –Increases entry –Lower consumption through lower productivity and excess churn

24
A Model of “Mis”-Allocation (Based on Rogerson and Restuccia (2003) (and similar to Hsieh and Klenow (2006)) Consumers supply labor inelastically and maximize utility: Firms maximize profits: Ex ante firms do not know productivity or distortion but know distribution. Pay entry fee, learn distribution, decide whether to produce. Productivity and distortion draws are firm-specific and time invariant Very low productivity/high distortion firms don’t produce Decreasing returns yields dispersion in productivity/distortions Overhead labor yields correlation between TFP and LP

25
Aggregate Relationships and Steady State Equilibrium G(A,τ) is ex ante distribution, μ(A,τ) is ex post distribution E is aggregate entry
 is ex ante distribution, μ(A,τ) is ex post distribution E is aggregate entry")
26
Preliminary Calibration of Impact of Distortions Note: All reported statistics are at steady state equilibrium reflecting selection. γ = 0.9, λ =.10, this is consistent with evidenceo f exit rates in the United States and other OECD countries (Bartelsman et al. 2004) R=.03 and =.12, consistent with long run real interest rates in OECD countries. f=.2,log(c e) =11.92 Ex ante A distribution: mean(log(A))=10.57, std(log(A))=0.34
 R=.03 and =.12, consistent with long run real interest rates in OECD countries. f=.2,log(c e) =11.92 Ex ante A distribution: mean(log(A))=10.57, std(log(A))=0.34.")
27
Relationship Between Labor Productivity and Employment: No Distortions

28
Relationship Between Labor Productivity and Employment (Random distortion case)
")
30
Eric Bartelsman, Jonathan Haskel and Ralf Martin* Distance to Which Frontier? Evidence on Productivity Convergence from International Firm-level data

31
Convergence Innovation and Spillovers/absorption R&D has ‘2 faces’: pushing out frontier and boosting catch-up Empirical literature Cross-country (and industry). For each industry: a frontier country Stochastic frontier, conditional convergence, role of R&D/innovation Single-country firm-level: heterogeneity in absorptive capacity. In s.s.: persistent productivity differences

32
Firms produce not countries or industries l Variation in firm-level productivity within industry or country l A country could have a ‘long tail’ problem: l Or a lack of world class firms: Global frontier country2 country1 long tail Mean productivity may not be a sufficient policy indicatorMean productivity may not be a sufficient policy indicator

33
The data Global Frontier: highest of average productivity of top quartile of firms Firm-level data from U.K. ABI/ARD, with info on R&D and MNE ICOP PPPs

34
Value Added per worker; by quartile

35
Firms in the UK and the global frontier

36
Econometric model Output function Linear homogenous Knowledge prod. Function so that Baseline specification assumes that X could include R&D, MNE ownership etc. so that we can write : To estimate we approximate A by labour productivity

37
Econometric model (cont.) l For firms below national frontier distance to global is strongly correlated with distance to national: To control:
 l For firms below national frontier distance to global is strongly correlated with distance to national: To control:")
38
Econometric Model (cont.) l What drives global convergence? –Spillover? –Active technology sourcing? Investing in absorbtive R&D –Within firm transfers? –Market selection? l Does everybody convergence? Is there variation between sectors firms and countries?

39
Baseline results (1)(2)(3) DTF N only DTF G only DTF N & DTF G DTF N 0.3200.211 (39.25)(8.13) DTF G 0.2870.101 (39.66)(4.68) RD_sales0.5810.4580.542 (1.53)(1.20)(1.43) MNE Dummy 0.0720.0720.073 (15.87)(15.76)(16.02) ΔA Git-1 -0.0610.103-0.004 (1.97)(3.31)(0.11) Observations275822758227582 R-squared0.180.180.18 Robust t statistics in parentheses
(2)(3) DTF N only DTF G only DTF N & DTF G DTF N (39.25)(8.13) DTF G (39.66)(4.68) RD_sales (1.53)(1.20)(1.43) MNE Dummy (15.87)(15.76)(16.02) ΔA Git (1.97)(3.31)(0.11) Observations R-squared Robust t statistics in parentheses")
40
Varying Convergence Speeds DTF top vs bot DTF N 0.204 (7.92) DTF G _top 0.181 (6.62) DTF G _bot 0.115 (5.30) RD_sales0.549 (1.45) MNE dummy 0.073 (16.00) ΔA Git- 0.007 (0.22)
 DTF G _top (6.62) DTF G _bot (5.30) RD_sales0.549 (1.45) MNE dummy (16.00) ΔA Git (0.22)")
41
Varying Convergence Speeds DTF-NonlyDTF-NDTF-G DTF1.490.262.155 DTF2.336.250.094 DTF3.279.186.097 DTF4.340.317.045

42
Stellingen l Goede documentatie van micro-bestanden en statistische methoden is belangrijker dan internationale harmonisatie van ‘statistische concepten’ l De afdeling Nationale Rekeningen behoort de meest intensieve gebruiker van micro-data te zijn l On-site gebruikers staan te popelen om een baan bij het CBS

Similar presentations


>")


 Bangladesh: A Strategy for Growth and Employment.>")


