Download presentation
Presentation is loading. Please wait.

1
HIV Among African Americans Nina T. Harawa, MPH, PhD Associate Professor Charles Drew University/UCLA

2
Objectives To review the epidemiology of HIV among Black people in the US To review the epidemiology of HIV among Black people in the US Discuss the role of sexual networks in HIV epidemics Discuss the role of sexual networks in HIV epidemics To discuss possible reasons for the disproportionate impact of HIV among African Americans To discuss possible reasons for the disproportionate impact of HIV among African Americans

3
Epidemiology of HIV/AIDS among Black People in the US

4
AIDS Data All 50 States

9
HIV/AIDS Data National Surveillance

19
Estimated New Cases

20
HIV Prevalence & Behavioral Data

21
NHANES Survey

22
Nat’l Survey of Family Growth (NSFG)
")
23
NSFG - Treated for an STD in past 12 months

24
Condom Use at last sex

25
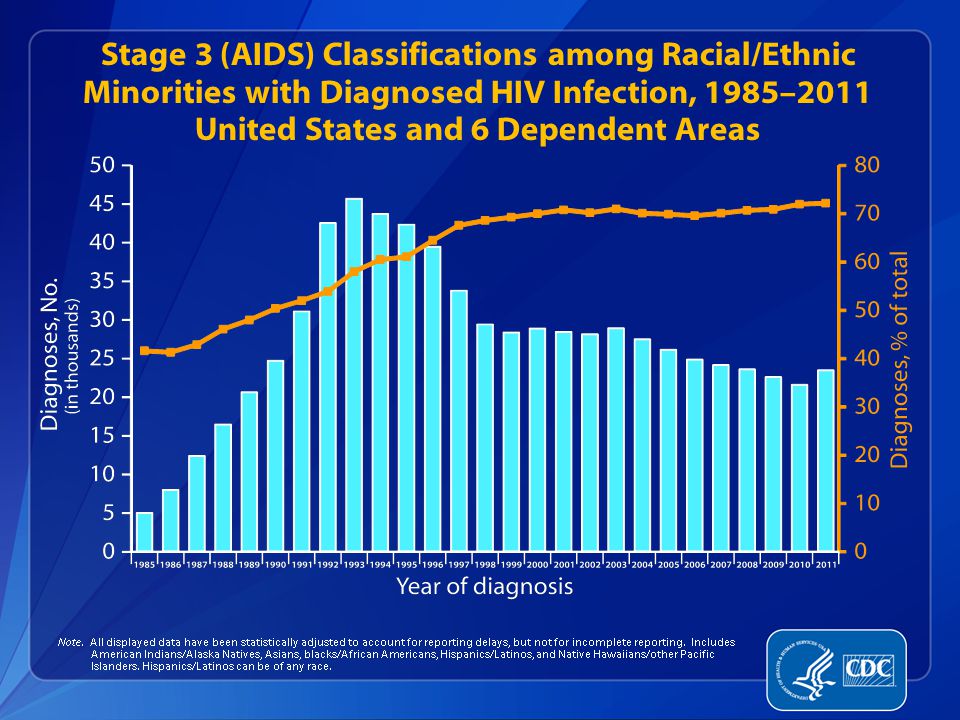
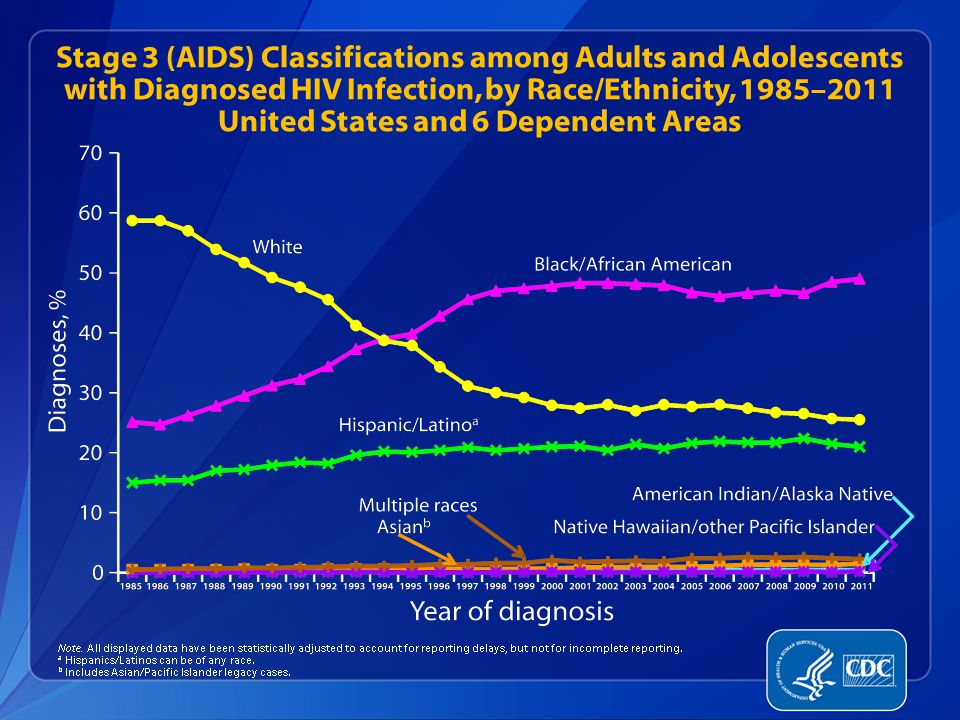
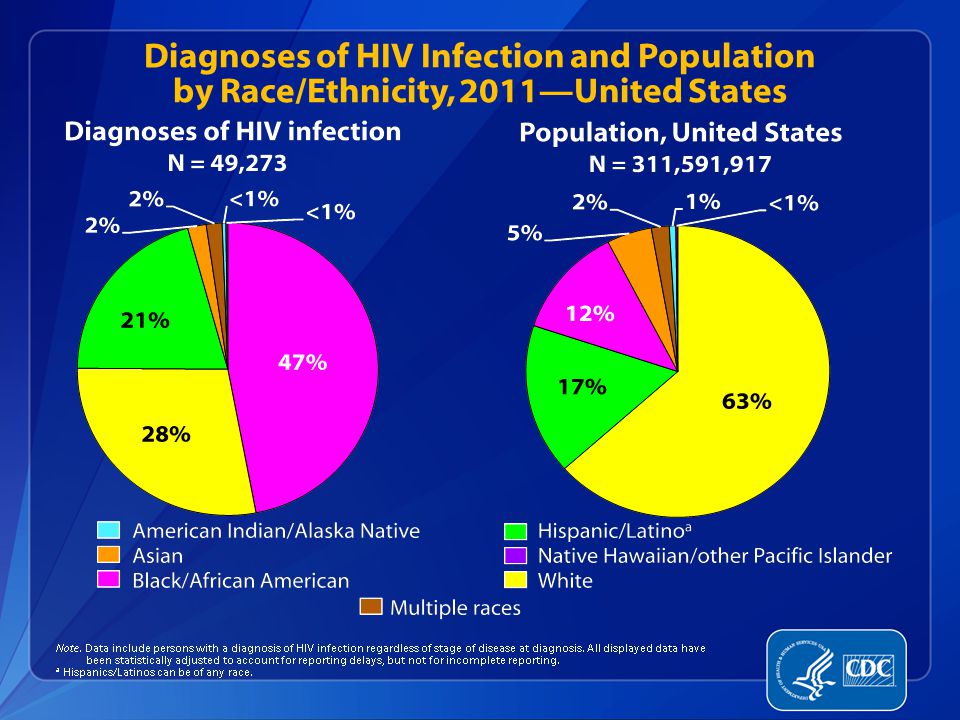
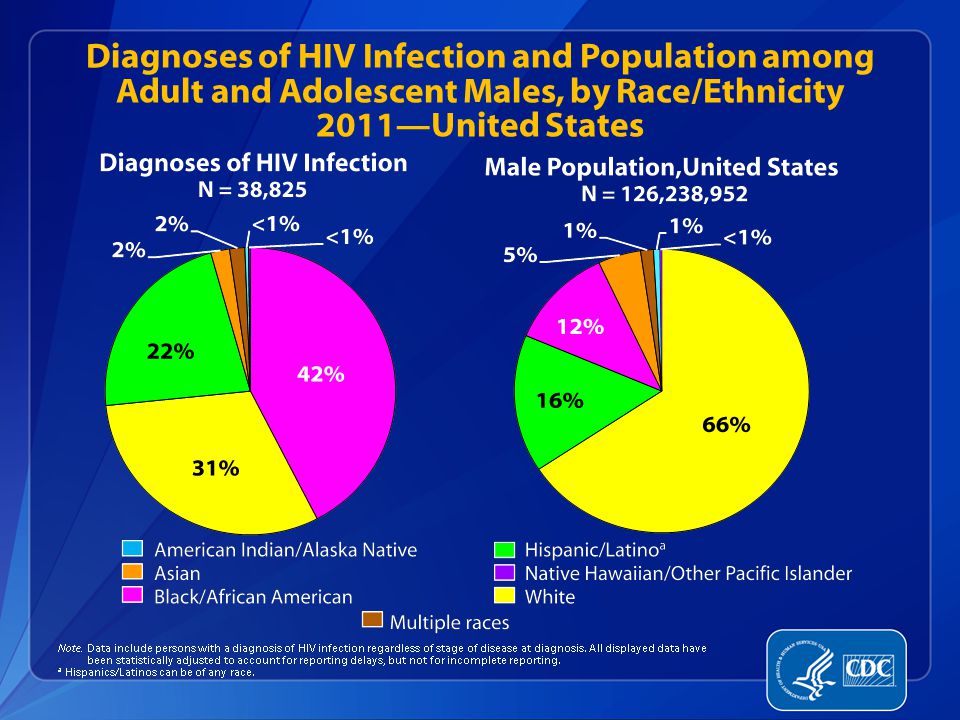
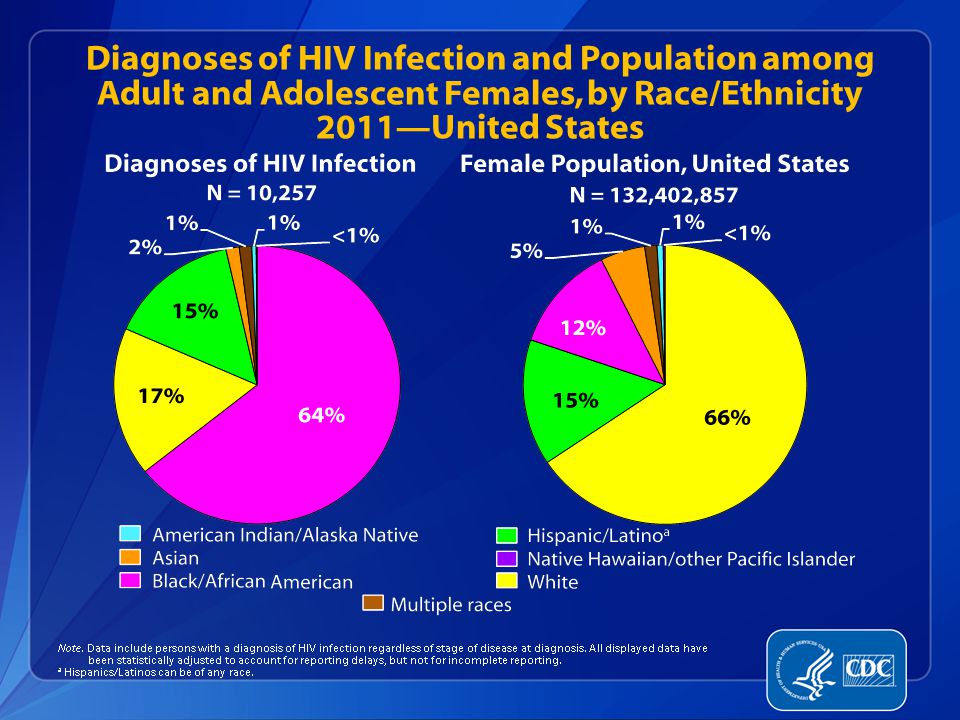
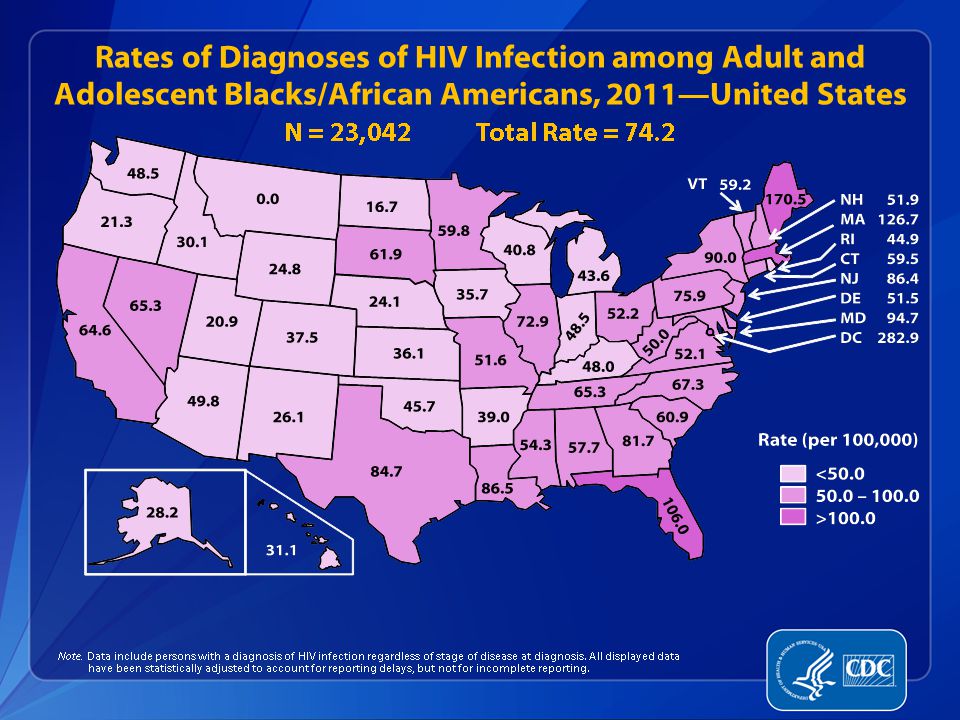
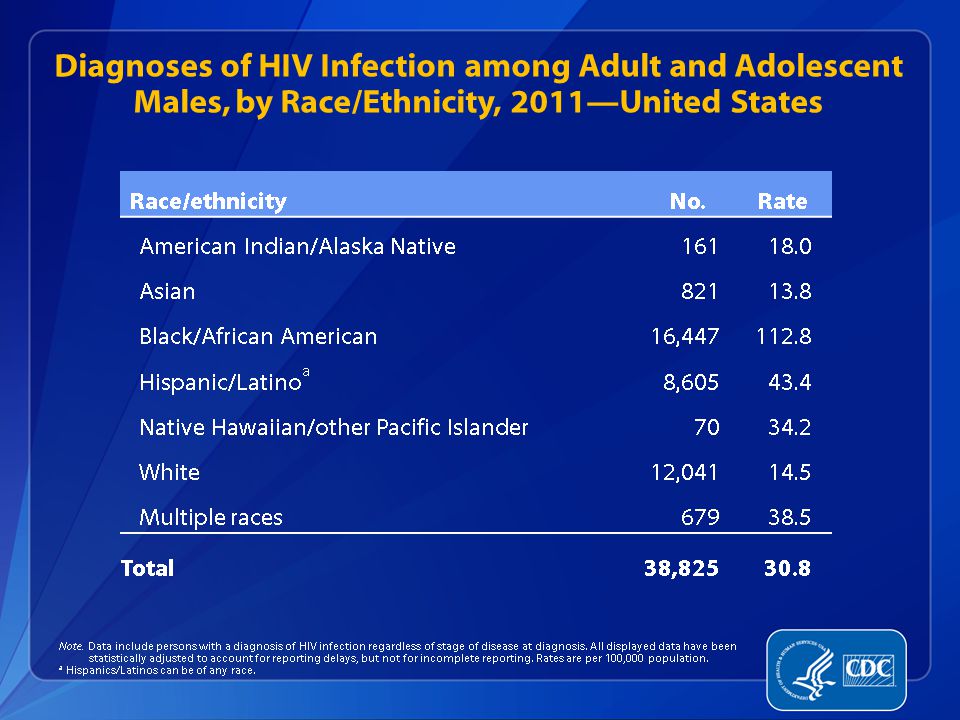
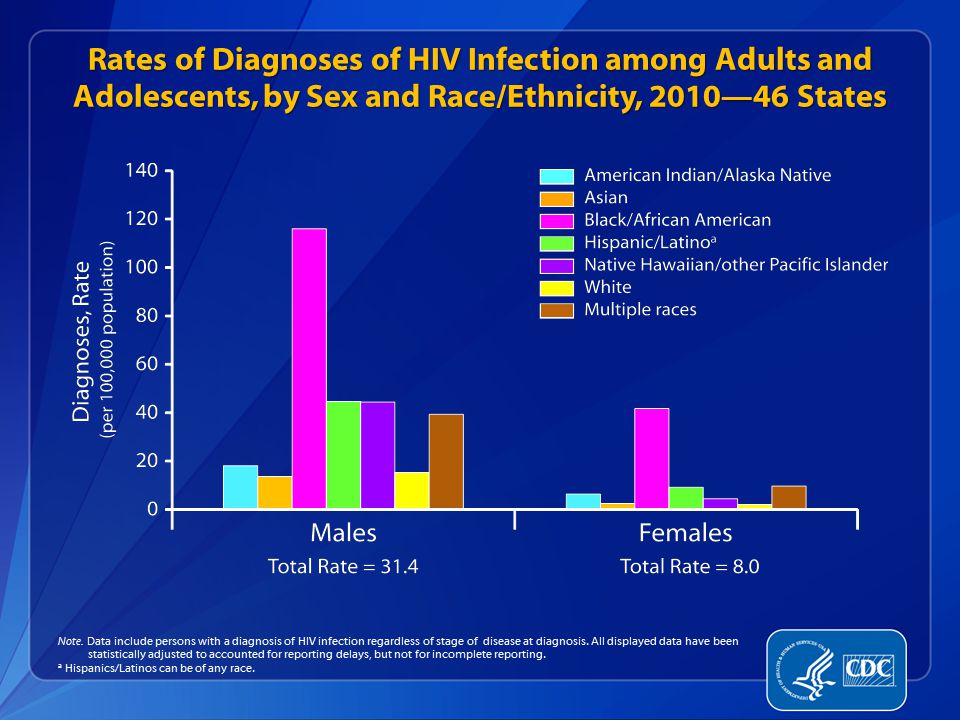
Summary – National Data for African Americans Make up 1 in 2 new cases but just 13% or 1 in 8 of the US population. Make up 1 in 2 new cases but just 13% or 1 in 8 of the US population. Males are more affected than females Males are more affected than females –2 out of every 3 new cases are male, 1 out of 3 is female –Greater racial disparities for females than males. MSM are the largest portion of male cases. MSM are the largest portion of male cases. Heterosexual risk is the largest portion of female cases. Heterosexual risk is the largest portion of female cases. High prevalence in Northeast and Southeast High prevalence in Northeast and Southeast

26
Objectives To understand why sexual networks may place a key role in the Af Am HIV epidemic To understand why sexual networks may place a key role in the Af Am HIV epidemic To understand key terms for aspects of sexual networks To understand key terms for aspects of sexual networks To understand how contextual factors might influence the shape of Af Am sexual networks To understand how contextual factors might influence the shape of Af Am sexual networks

27
The Problem Black people experience higher HIV/AIDS rates across gender, age, and behavioral risk groups. Black people experience higher HIV/AIDS rates across gender, age, and behavioral risk groups.

28
The Conundrum Not all of these disparities explained by Not all of these disparities explained by –higher risk behaviors –lower individual income/educational levels –key papers Millett et al. 2006 and 2007, Malebranche 2008, Harawa, et al. 2004, Halfors, et al. 2007 Although other minority groups experience disparities, this is not true across the board or across behavioral risk groups. Although other minority groups experience disparities, this is not true across the board or across behavioral risk groups.

29
Helping to Solve the Conundrum Looking beyond the individual level Looking beyond the individual level –Couple –Family –Network: social and sexual –Neighborhood, zip, city, county, state, etc. Economic, STD prevalence, “broken windows”, criminal justice, drug, political,...environment

30
Sexual Networks Groups of persons who are connected to one another sexually. The number of persons in a network, how central high-risk persons are within it, the percentage in monogamous relationships and the number of “links” each has to others all determine how quickly HIV/STDs can spread through a network. Groups of persons who are connected to one another sexually. The number of persons in a network, how central high-risk persons are within it, the percentage in monogamous relationships and the number of “links” each has to others all determine how quickly HIV/STDs can spread through a network. –Distinct from but often overlap with social networks. –Who has sex with whom. –How many and how tightly are members connected.

31
Data courtesy of Andrea Cuschieri

32
Transmission Dynamics Model R 0 = ß x c x D R 0 = Case reproduction rate ß = Efficiency of transmission C = Mean rate of partner change D = Duration of infectiousness Higher the value of R 0, greater spread of infection Pamina M. Gorbach, DrPH; Lecture: UCLA 5/10/01

33
Aspects of Sexual Networks Core groups Core groups Mixing patterns Mixing patterns Concurrency Concurrency Size Size Connectedness Connectedness Rates of partner change Rates of partner change

34
Core Groups Critical to maintaining high transmission rates. Critical to maintaining high transmission rates. Core transmitters have high levels of risky behaviors, contribute a disproportionate share of HIV/STDs cases, and can fuel sustained transmission in a network. Core transmitters have high levels of risky behaviors, contribute a disproportionate share of HIV/STDs cases, and can fuel sustained transmission in a network. –Sex workers –Repeatedly infected with STDs –High numbers of sexual partners –From core neighborhoods/networks –Men who have sex with men –IDUs (?crack users)
.")
35
Chlamydia network from Qikiqtarjuaq, Nunavut Canada, 2003 Data courtesy of Andrea Cuschieri

36
Core Transmitters Core Groups People who have Sex with Both General Population

37
Chlamydia network from Qikiqtarjuaq, Nunavut Canada, 2003 Data courtesy of Andrea Cuschieri

38
Partner Mixing Patterns Assortative Assortative –Tendency toward partnering with similar partners (e.g., “ISO”) Similar race (especially Black women) Disassortative Disassortative –Tendency toward partnering with dissimilar partners. Dissimilar risk groups (partnering between high- and low-risk partners). Mixed Mixed
. Mixed Mixed.")
39
Disassortative Mixing Random spread broadens transmission. An infection spreads quickest when partnering is random.(Laumann 1994) When partners select one another within groups such as age, ethnicity, class, religion or other characteristics, diseases may not spread to all subgroups. When partnering is anonymous or random, a disease can spread more quickly through all groups. Random spread broadens transmission. An infection spreads quickest when partnering is random.(Laumann 1994) When partners select one another within groups such as age, ethnicity, class, religion or other characteristics, diseases may not spread to all subgroups. When partnering is anonymous or random, a disease can spread more quickly through all groups.
 When partners select one another within groups such as age, ethnicity, class, religion or other characteristics, diseases may not spread to all subgroups. When partnering is anonymous or random, a disease can spread more quickly through all groups. Random spread broadens transmission. An infection spreads quickest when partnering is random.(Laumann 1994) When partners select one another within groups such as age, ethnicity, class, religion or other characteristics, diseases may not spread to all subgroups. When partnering is anonymous or random, a disease can spread more quickly through all groups..")
40
Examples of factors encouraging disassortative mixing Gender norms Gender norms Public sex venues Public sex venues Sex-ratio imbalances Sex-ratio imbalances Secrecy/lack of dialogue regarding sexual histories Secrecy/lack of dialogue regarding sexual histories

41
Concurrency Overlapping sexual partnerships Overlapping sexual partnerships –Sexual partnerships in which a new sexual partnership is initiated prior to the termination of another. Bacterial STDs are known to travel faster in populations with greater concurrency, but with equal rates of new partnerships. Bacterial STDs are known to travel faster in populations with greater concurrency, but with equal rates of new partnerships.

42
Concurrency Increases the probability for transmission, because earlier partners can be infected by both earlier and later partners. Further, they can serve as “nodes”, connecting all persons in a dense cluster, creating highly connected networks that facilitate transmission. Increases the probability for transmission, because earlier partners can be infected by both earlier and later partners. Further, they can serve as “nodes”, connecting all persons in a dense cluster, creating highly connected networks that facilitate transmission. Concurrent partners can connect each of their respective clusters and networks as well. Concurrent partners can connect each of their respective clusters and networks as well. Concurrency alone can fuel an epidemic even if the average number of partners is relatively low.(Morris, 1997) Concurrency alone can fuel an epidemic even if the average number of partners is relatively low.(Morris, 1997)
 Concurrency alone can fuel an epidemic even if the average number of partners is relatively low.(Morris, 1997).")
43
Summary – Sexual Networks Networks integrate “core transmitters” into the larger population. Networks integrate “core transmitters” into the larger population. Dense networks help maintain STD endemicity. Dense networks help maintain STD endemicity. Core transmitters are key to population- based STD control. Core transmitters are key to population- based STD control.

44
Sexual network structure of African American Communities Factors which influence these patterns Factors which influence these patterns –Male-to-female sex ratios –Social and residential segregation –Incarceration –Gender and cultural norms –Racial oppression that diminishes opportunities for advancement, especially for Black men

45
CONTEXT-NETWORK PATHWAYS P O V E R T Y/SEGREGATION Pool of Relationship marriageable menInstability CONCURRENCY SEX RATIO

46
Male-to-female sex ratios Higher numbers of women than men across age groups. Higher numbers of women than men across age groups. Caused by differential Caused by differential –Mortality –Incarceration –Military service Compounded by differential Compounded by differential –Rates of interracial relationships –Unemployment

47
Marital Status Black women are less likely to marry, marry later, and more frequently divorce than white women. Black women are less likely to marry, marry later, and more frequently divorce than white women. Black women ages 15+ years, are nearly half as likely as white women to be married and living with their spouse [Table A1. Marital Status of People 15 Years and Over, by Age, Sex, Personal Earnings, Race, and Hispanic Origin, 2003 - US Census] Black women ages 15+ years, are nearly half as likely as white women to be married and living with their spouse [Table A1. Marital Status of People 15 Years and Over, by Age, Sex, Personal Earnings, Race, and Hispanic Origin, 2003 - US Census]

48
Social and residential segregation Black people are the most racially segregated group in the US. Black people are the most racially segregated group in the US. Black/white segregation indices are still quite high: 69%. Black/white segregation indices are still quite high: 69%. Blacks tend to be concentrated in metropolitan areas (58%). Blacks tend to be concentrated in metropolitan areas (58%). –Lower and middle-class African Ams more likely to live in low-income urban areas than poor and middle-class Whites.
. Blacks tend to be concentrated in metropolitan areas (58%). –Lower and middle-class African Ams more likely to live in low-income urban areas than poor and middle-class Whites..")
49
Incarceration of Black Men Nearly 5% of men are incarcerated at any given time. Nearly 5% of men are incarcerated at any given time. –Among men ages 20-29 years, nearly 1 in 3 are under criminal justice supervision. Projection: Nearly 1 in 3 men will be imprisoned in lifetime. Projection: Nearly 1 in 3 men will be imprisoned in lifetime. –Nearly 60% of low-income men who did not graduate HS will be imprisoned. Bureau of Justice Statistics: http://bjs.ojp.usdoj.gov/ Bureau of Justice Statistics: http://bjs.ojp.usdoj.gov/ Bureau of Justice Statistics: http://bjs.ojp.usdoj.gov/ Bureau of Justice Statistics: http://bjs.ojp.usdoj.gov/

50
Dual Epidemics

51
Impact of incarceration Imbalanced gender ratios Imbalanced gender ratios Disrupted relationships - “correctional concurrency” Disrupted relationships - “correctional concurrency” Spread of STI’s within prison Spread of STI’s within prison Normalization of incarceration and effects on normative community values of sex, violence and drug use Normalization of incarceration and effects on normative community values of sex, violence and drug use Diversion of human/economic resources Diversion of human/economic resources N.T. Harawa and A. Adimora. “Incarceration, African Americans, and HIV: advancing a research agenda.” J Natl Med Assoc 100 (2008) 57-62.
")
52
Gender and cultural norms Economic/historical circumstances have altered some gender norms but strengthened others. Economic/historical circumstances have altered some gender norms but strengthened others. –Women historically have been employed. –Women often play crucial decision-making roles within institutions. –Masculine roles within families strongly upheld/defended given threats/assaults in other areas.

53
Racial oppression Diminishes opportunities for economic advancement, especially for Black men. Diminishes opportunities for economic advancement, especially for Black men. CONTEXT - NETWORK RELATIONSHIPS residential segregation by race concentration of adverse social and economic influences (poverty, drugs, violence) selection of partners from neighborhood
 selection of partners from neighborhood.")
54
Proximal/Distal Determinants A determinate is an element that identifies or determines the nature of something or that fixes or conditions an outcome PROXIMAL DETERMINATES directly affect disease risk. DISTAL DETERMINANTS help shape behavior and the risks associated with given behaviors.

55
Determinants of Heightened STD Risks in African American Communities MAJOR PROXIMAL DETERMINATES: High prevalence of STDs High prevalence of STDs Sexual network patterns: concurrency and mixing among different subpopulations Sexual network patterns: concurrency and mixing among different subpopulations Risk behaviors Risk behaviors DISTAL DETERMINANTS Poverty, inequality, discrimination, segregation Poverty, inequality, discrimination, segregation Healthcare access and utilization Healthcare access and utilization

56
NHANES Survey

57
African American MSM Higher HIV rates despite Higher HIV rates despite –Similar to lower risk behaviors Number partners Unprotected sex Risky drug use... Compared with other MSM

58
Other Key Issues Enhanced HIV testing a critical component Enhanced HIV testing a critical component –About 60% of HIV+ black MSM unaware of infection in NBS Outness and homophobia may play key roles, but not always in the expected directions. Outness and homophobia may play key roles, but not always in the expected directions. –A number of studies have shown higher levels of risky behavior among out and gay- identified men than other MSM

59
‘Out’ to health provider by race/ethnicity and known HIV status % Source: L.A. Men’s Survey 2008, National HIV Behavioral Surveillance

60
Potential alternative explanations for high HIV rates in Black MSM Other indicators of partner type may better indicate risk (e.g., age, race, SES, etc.) Other indicators of partner type may better indicate risk (e.g., age, race, SES, etc.) Greater levels of concurrency Greater levels of concurrency Differential misreporting of risk behaviors Differential misreporting of risk behaviors Differences in frequency of anal sex Differences in frequency of anal sex Missed and delayed diagnosis of HIV infection among MSM of color and their partners Missed and delayed diagnosis of HIV infection among MSM of color and their partners Higher STD prevalence Higher STD prevalence Biological differences (e.g., CCR5 mutation) Biological differences (e.g., CCR5 mutation)
 Other indicators of partner type may better indicate risk (e.g., age, race, SES, etc.) Greater levels of concurrency Greater levels of concurrency Differential misreporting of risk behaviors Differential misreporting of risk behaviors Differences in frequency of anal sex Differences in frequency of anal sex Missed and delayed diagnosis of HIV infection among MSM of color and their partners Missed and delayed diagnosis of HIV infection among MSM of color and their partners Higher STD prevalence Higher STD prevalence Biological differences (e.g., CCR5 mutation) Biological differences (e.g., CCR5 mutation)")
62
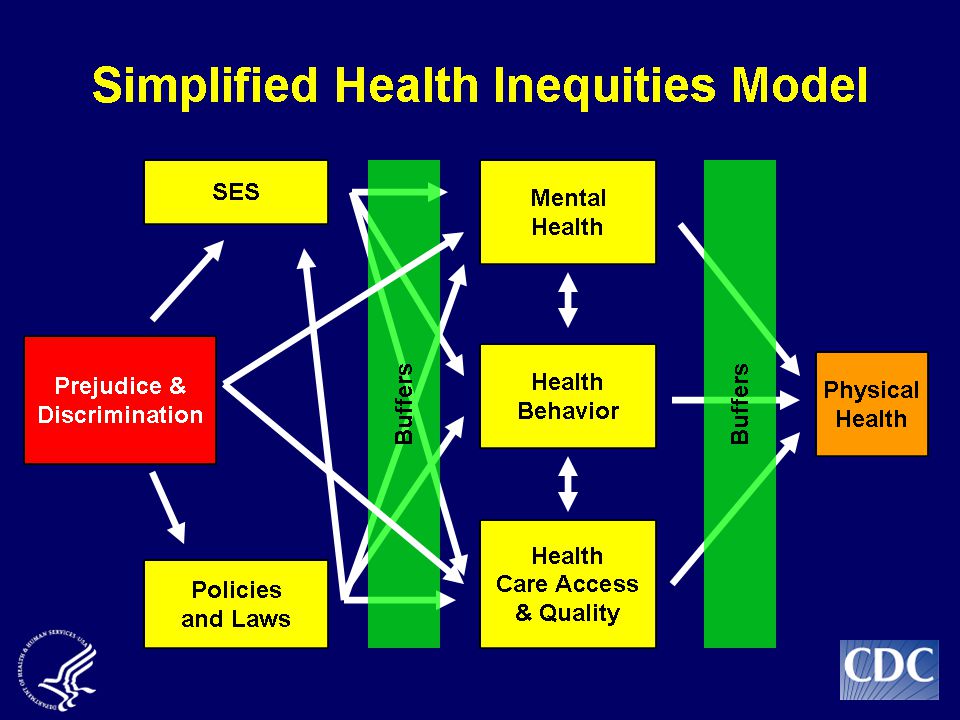
Important Buffers Sources of resiliency Sources of resiliency –Religious institutions –Spirituality –Family bonds/support –History of overcoming challenges –Pride –Creativity

Similar presentations


 287-5193>")

>")
 Public Health England London,>")


