Download presentation
Presentation is loading. Please wait.

1
Berton Hamamoto (B), ABR, CRB, CRS, CFP Property Profiles Inc.
, ABR, CRB, CRS, CFP Property Profiles Inc.")
2
Did YOU miss the boat??

3
Metric% change from one year agoComment NAR Median Price + 11.3% (September) Mix of homes impact price … fewer distressed sales recently … Case-Shiller +2.0% (June, July, August average) Lagging indicator Near double-digit on an annualized basis in recent months FHFA + 4.7% (August) Monthly gains in 9 of recent 10 months
 Mix of homes impact price … fewer distressed sales recently … Case-Shiller +2.0% (June, July, August average) Lagging indicator Near double-digit on an annualized basis in recent months FHFA + 4.7% (August) Monthly gains in 9 of recent 10 months")
6
Distressed Sales Market Share 2010 … 33% 2011 … 33% 2012 … 25% 2013 … 15% 2014 … 8% 2015 … 5%

7
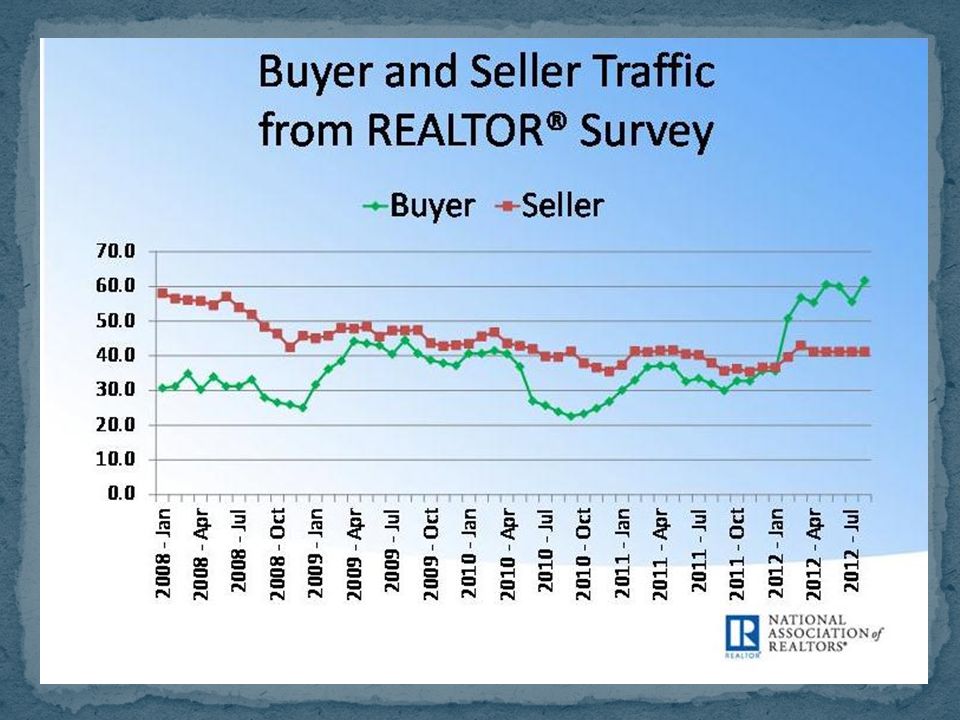
Source: Case-Shiller

15
IslandSingle Family Condo Oahu+ 7.8% ($620,000) +5.8% ($317,500) Maui+9.0% ($ 470,000) +16.0% ($358,995) Kauai+ 0.55% ($457,500) + 26.97% ($289,500) Big Island+ 5.26% ($260,000) +21.88% ($259,000) Statistics provided by HBR, HIS & RAM
 +5.8% ($317,500) Maui+9.0% ($ 470,000) +16.0% ($358,995) Kauai+ 0.55% ($457,500) % ($289,500) Big Island+ 5.26% ($260,000) % ($259,000) Statistics provided by HBR, HIS & RAM")
16
2012% chg from 2011 Jan 2012- 9.3% February- 4.9% March -12.1% April- 19.4% May-19.5% June-15.9% July-19.3% Aug-20.7% September-19.7% October-24.9% November-21.0% December-18.4%

17
2012% chg from 2011 Jan 2012- 7.8% February- 6.4% March -10.1% April- 7.4% May- 7.0% June-11.3% July-12.5% Aug- 8.7% September-14.3% October-12.1% November-16.5% December-13.5%

18
Statistics provided by HBR Category % chg ytd 2012 Unit sales + 6.5% Median price + 7.8% ($620k) Inventory - 18.4% Pending sales + 81.5% Months supply - 47.9% (2.5mo) Days on Market - 14.3% (30 days)
 Inventory % Pending sales % Months supply % (2.5mo) Days on Market % (30 days)")
19
Statistics provided by HBR CategoryAnnual % chg Unit sales + 8.2% Median price + 5.8% ($317.5k) Inventory - 13.5% Pending sales + 63.8% Months supply - 40.0% (3.0mo) Days on Market - 50.0% (41 days)
 Inventory % Pending sales % Months supply % (3.0mo) Days on Market % (41 days)")
20
Statistics provided by HBR NeighborhoodAnnual % chg Kailua/Waimanalo +2.0% $794,500 Hawaii Kai - 3.0% $880,000 Mililani nc $590,000 Pearl City/ Aiea +2.0% $583,750 Ewa Plain +5.0% $460,400 Makaha / Nanakuli +11.0% $315,000

21
Statistics provided by HBR NeighborhoodAnnual % chg Ala Moana area + 1.0% $355,000 Hawaii Kai + 3.0% $525,000 Mililani +14.0% $289,000 Pearl City/ Aiea + 1.0% $275,000 Ewa Plain + 3.0% $310,000 Waikiki +28.0% $365,000 North Shore + 5.0% $300,000

22
2011 History 2012 Forecast 2013 Forecast 2014 Forecast GDP Growth+1.8%+2.1%+2.5%3.1% Existing Home Sales 4.26 million4.64 million5.05 million5.3 million New Home Sales 301,000368,000575,000650,000 Housing Starts612,000776,0001,128,0001,300,000 Existing Home Price $166,100$176,100$ 185,200$195,000 Fed Funds Rate 0.1% 30-yr Mortgage 4.7%3.7%4.0%4.6%

23
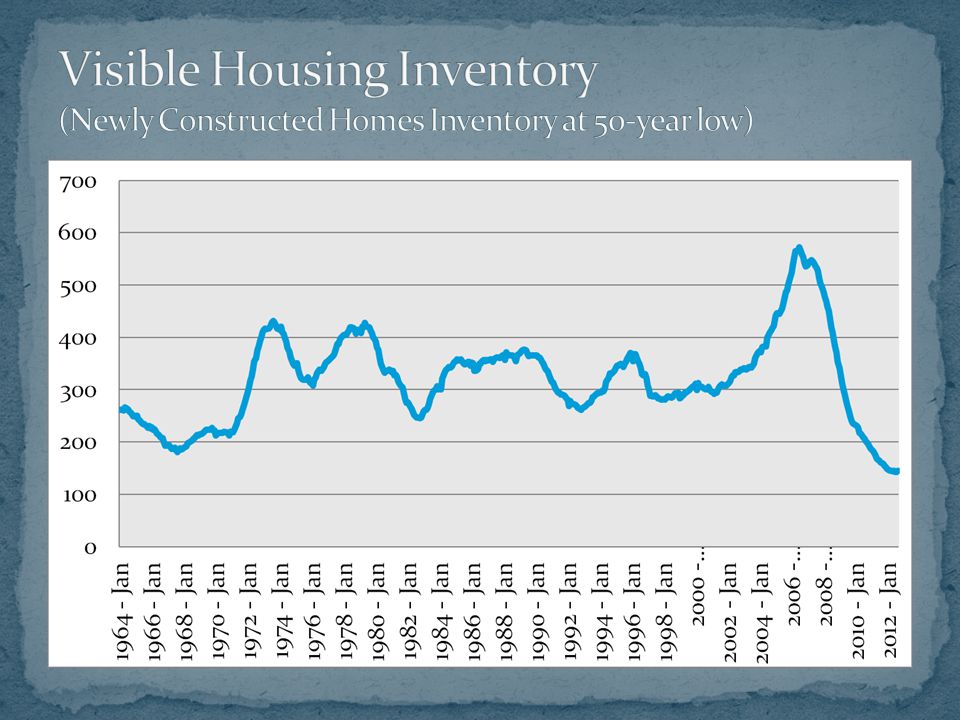
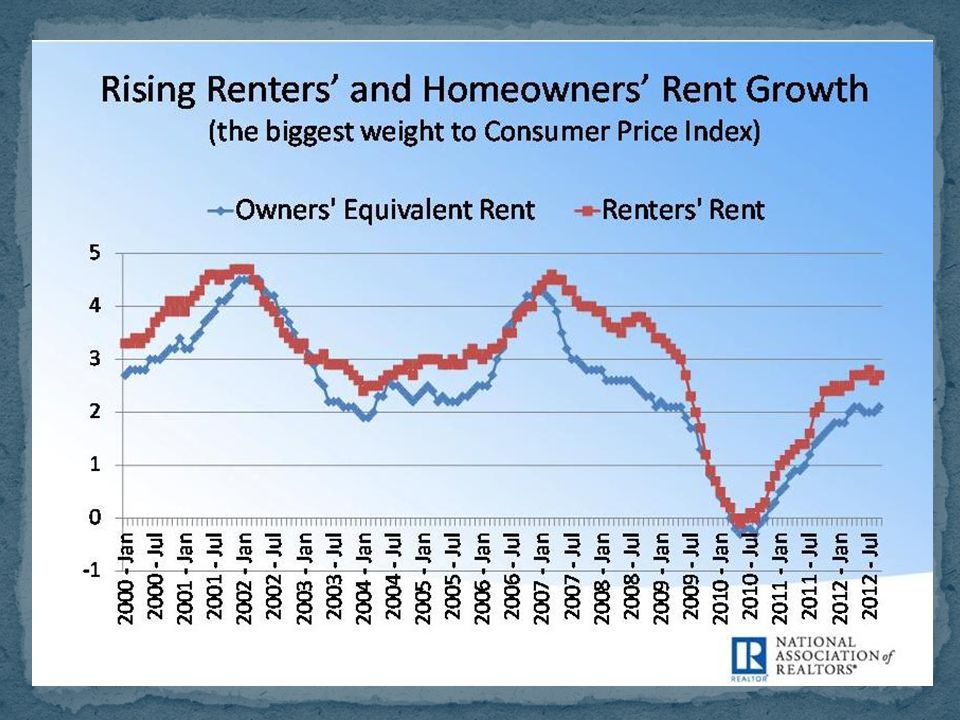
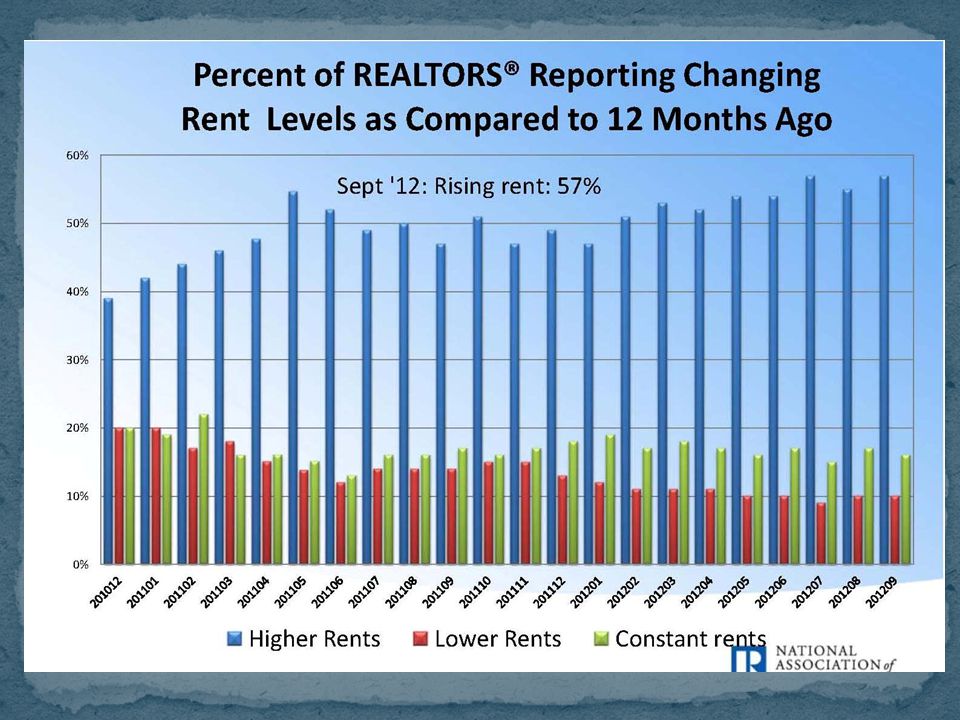
Higher home prices 10%– 15% in some neighborhoods Little inventory added to market will decrease supply Rents will increase due to competition for housing Investors increasing share of market

24
2009 - $340,000 2011 - $ 360,000 – $370,000 2012 - $405,000 - $410,000 (+20%)
")
25
Upside … Credit Availability Housing recovery up so far even with tight credit What happens if mortgage accessibility opens up? Demand outpacing supply Downside … Washington Policy QRM 20% down payment requirement? Basel 3 … capital rule that punishes private mortgage with low down payment and commercial loans Trim mortgage interest deduction? Capital gains tax on home sale?

26
Still time to buy… BUT YOU WANT TO BUY NOW!!!!!!! Talk to a REALTOR

Similar presentations


, ABR, CRB, CRS, CFP Property Profiles Inc.>")


