Download presentation
Presentation is loading. Please wait.

1
NEW DEVELOPMENTS IN FABRICATED TEES – A QUALITY ASSURANCE DESIGN GUIDELINE A.C. Seibi and R. J. Lawrence, GPPA

2
Outline Background Approach Quality Control o Lab. Tests o Finite Element Modeling Results & Discussion Conclusions & Recommendations

3
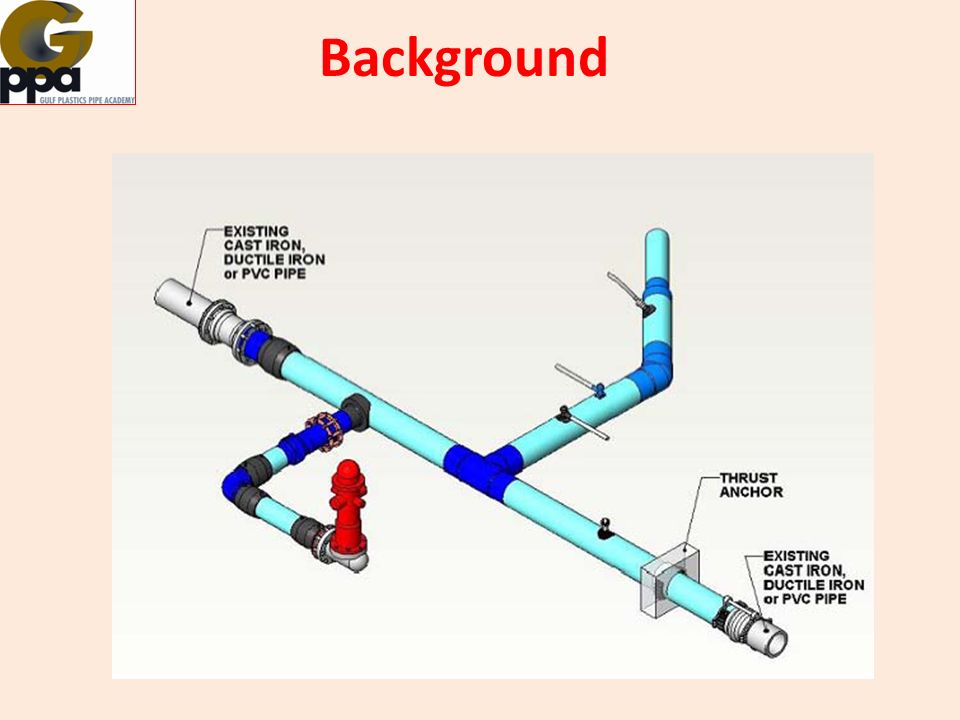
Background

5
Design????

6
Background – Questions ???? Are we overdesigning PE pipes? Which design criteria do we have to use (PN, yield/burst stress, failure strain)? Where does SCF occur in tees? Where does failure occur in fittings? Should we revisit welding practices of fittings?
. Where does SCF occur in tees. Where does failure occur in fittings. Should we revisit welding practices of fittings .")
7
Background Do we have to strictly follow ISO 4427 ????

8
Approach 1.Search for field reports of failures. 2.Examine welding fabrication process. 3.Perform finite element analysis. 4.Carry out laboratory burst tests on elbows and tees. 5.Compare results of 3. and 4.

9
Preliminary Findings 1.Very few field failures of pipe fittings. 2.Overlapping beads at tee joints may present weakness in fittings. 3. Soaking time for large diameter pipes should be revisited. 4.Bead not welded properly

10
1 st Joint 2 nd Joint Pipe yielding Parrot beak QC: Lab Results

11
Long Term Test (Tees). 12.4 MPa for 100 hrs at 20 o C 5.4 MPa for 165 hrs at 80 o C Temperature ( o C) Derating factor Size (mm) 63 – 250560 - 9002000 20 0.8 0.9 0.95 1 Pass Fail Pass Fail Pass --- 80 0.8 0.9 0.95 1 Pass Fail Pass Fail Pass ---
 Derating factor Size (mm) 63 – Pass Fail Pass Fail Pass Pass Fail Pass Fail Pass ---.")
12
QC: Finite Element Modelling Elbow Tee

13
Press. vs. displ FEM Results Stress contours

14
Results Size (mm) Bend Angle (deg.) Thickness (mm) Pressure FEA (bar) Pressure Experimental (bar) Error (%) 317.54512.721.8235.39 225.6901533.837.59.87 167.19015.146.649.25.28 1614514.9546010.00 225.84513.834.9534.90.14 Difference ≈ 0.1 – 10%
 Bend Angle (deg.) Thickness (mm) Pressure FEA (bar) Pressure Experimental (bar) Error (%) Difference ≈ 0.1 – 10%")
15
Stress concentration Displacement contours Deformed shape Max. & not at the same place. Why? Failure occurs at intersection due to viscoelastic material behavior

16
Longitudinal strain Transverse strain FEM Results

17
Practical Solution - UPI UPI developed a 2000 mm reducer tee. No worry about pipe derating.

18
FEM Results It was recommended to create fillets at the inner and outer sections of the junction.

19
Conclusions 1.A derating factor of 0.8 for modern PE100 like HE 3490 LS pipe tees can be safely accepted. 2.Most failures in tees take place in either 1 st or 2 nd weld. Need further investigation. 3.FE results showed a good agreement with burst pressures of pipe bends. 4.FE results showed that the max. stress is concentrated at the tee junction and that potential failure is anticipated to take place at the intersection of the welds.

20
Recommendations 1.Need to understand reasons behind tee failure along the welds. 2.Must develop a strain based failure criterion for plastic pipes and fittings. 3.Damage mechanics should be considered in FEM to better understand failure modes in fabricated pipe fittings. 4.Should take a look at the soak time in welding of large size fittings.

Similar presentations


 2 3 1 4.>")